Development of a Single-Phase DSP based Power Quality Analyzer using New Signal Processing Algorithms for Detection and Classification Tomáš Radil1, Fernando M. Janeiro2 and Pedro M. Ramos3 1
2
Instituto de Telecomunicações, Av. Rovisco Pais 1, 1049-001 Lisbon, Portugal, Phone: +351-218418489; Fax: +351-218418472; e-mail:
[email protected]
Instituto de Telecomunicações and Universidade de Évora, Rua Romão Ramalho 59, 7000-671 Évora, Portugal Phone: +351-266745300; e-mail:
[email protected] 3
Instituto de Telecomunicações and Department of Electrical and Computer Engineering, Instituto Superior Técnico, Technical University of Lisbon, Av. Rovisco Pais 1, 1049-001 Lisbon, Portugal Phone: +351-218418485; Fax: +351-218418472; e-mail:
[email protected]
Abstract.
In this paper, the development of a single-phase digital signal processor (DSP) based power quality analyzer is described. In this stage of development, special attention is devoted to the selection of the signal processing algorithms to be implemented in the prototype. The algorithms must be capable of efficiently detecting and classifying the large range of power quality disturbances that can vary immensely either in amplitude or duration. The broad range of disturbance types is also an important factor since different algorithms may be required for the detection of smaller classes of disturbances.
Key words Power quality detection and classification, signal processing algorithms, DSP based instrumentation.
1. Introduction Increasing deregulation in the power utilities distribution and production markets, together with the use of nonlinear loads by the ever growing market of consumer electronics devices, have drawn the attention of companies and users to power quality (PQ) issues. Power quality events can range from harmless short duration and small amplitude transients up to nationwide interruptions that may cause loss of revenue for companies or even lead to social problems when they affect medical or heating systems for example. Longer interruptions can be caused by lightning, catastrophic failures in crucial production facilities or excess overload in some systems. Although consumers are also affected by these situations, other power quality disturbances may cause consumer electronics devices to be irreparably damaged. Most of the times, the users do not even know that the failure was caused by disturbances in the power delivery system. In order to trace, detect, classify and eventually correct the causes behind power quality events, utilities
companies are beginning to deploy (at consumer request and mainly only for larger power consumption clients) power quality analyzers that continuously monitor the delivered power, detect and classify PQ disturbances (also called events) and automatically report the results back to the company’s technical department. These are expensive instruments developed and commercialized by specialized companies. In many situations, the power utilities engineers are skeptic of the results since they were obviously not involved in the PQ analyzer development, they cannot adjust internal operating parameters of the device and documentation is superficial. Recommendations regarding measurement and monitoring of PQ events have been published by IEEE [1] and IEC [2]. In this paper the development of a single-phase digital signal processor (DSP) based PQ analyzer is described. The simple nature of the algorithms employed makes the device very efficient with regards to algorithm implementation in DSP based instrumentation and very easy to understand and modify for potential users.
2. Measurement setup The first step in the development of the prototype was the measurement and storage of real power quality disturbances that occur in a single-phase power system. The recorded data can be used to test the developed algorithms without having to wait for the events to occur again. However, since the detection and classification stages of these instruments are very similar and adapted to each class of disturbances it is normal that the early implemented algorithms failed to detect and record some events. With the improvements made mainly in the detection part, the number of undetectable events has been reduced and the algorithm became more robust.
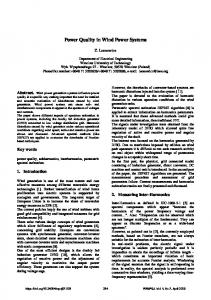
To interface the power line (single-phase power system, 230 V/50 Hz) two Hall effect sensors from LEM are used (see Fig. 1). The first sensor (LV 25-P) measures the voltage; while the second sensor (LA 25-NP) monitors the current flowing to a potential load connected to the power line. However, only the voltage sensor is employed in the current version of the proposed algorithm. The outputs of the sensors are acquired using a National Instruments data acquisition board (DAQ) with maximum sampling rate of 100 kS/s and 16-bit resolution in the ±10 V range (USB-9215A BNC). The DAQ is connected to the PC by a USB connection and is controlled with either Matlab or LabVIEW for continuous acquisition at 50 kS/s per channel.
Within the acquisition program, the detection is performed while the next batch of signals is being acquired by the DAQ. This means that, since the detection is faster than the acquisition process, all samples are processed without any data gaps. The data is acquired in batches that are 2 minutes long. If an event is detected within the batch, the program proceeds to the classification stage where the type of the event and its parameters are determined. The corresponding data (relevant to the detected disturbance) is saved on the PC hard drive in individual directories for each type of event. By saving only the data corresponding to the disturbance, some data reduction is achieved. However, even under these circumstances, the amount of data is extremely large. This is caused by the many transients that are detected but also by the large amounts of data from the longer events (sags, swells, interruptions, etc.) whose length might even exceed the length of one batch of signals. All the devices used in the detection (PC and the sensor box) are powered by an uninterruptible power supply (UPS) so that long duration sags and interruptions can be measured from start to finish.
Fig. 1. Block diagram of the measurement setup.
To view and analyze the measured and saved events, the acquisition program is accompanied by a program with a graphical user interface (GUI) developed in Matlab. This program (Fig. 2) enables the analysis of the performance of the proposed algorithm, examine the influence of the setting of individual thresholds on the detection and classification result thus helping to assess what changes (if any) to the algorithm are required.
Fig. 2. Matlab GUI for analyzing of the measured PQ events.
3. Detection and classification algorithms The traditional detection and classification algorithms are wavelets [3], namely the discrete wavelet transform (DWT). Using the correct mother wavelet (Daubechies wavelet is applied most often [3,4]), it is possible to detect disturbances in the measured power signal. To accurately detect disturbances, decomposition up to the 4th order is usually used and sometimes even decomposition up to the 6th order is needed. The order of decomposition carries with itself an increased computational burden. This means that faster DSPs are required. In addition, the DWT fails to detect events when the disturbance appears slowly. This is the case of some interruptions or sags, where the power signal amplitude decreases slowly and/or where the recovery of the amplitude is gradual. With respect to the differences between the characteristics of individual types of PQ disturbances, the proposed detection and classification algorithms to replace the DWT are divided into two parts. Each part takes care of detection and classification of one group of PQ disturbances: A) transients and waveform distortions and B) short and long duration disturbances. The first category includes: transients, harmonics, interharmonics, notching and noise. The second includes: sags, swells, interruptions, over- and undervoltages. The detection process is different for the two categories.
In this category, the data segment with the normalized voltage signal (uNORM) to be processed is filtered using a 6th order elliptic IIR high-pass filter. This is done to remove the 50 Hz power signal and some of its lower harmonics. After filtering, the mathematical morphology operation dilation [5] is applied to simplify the detection and classification process. The filtered signal (uHP) is dilated with a structuring element (SE), which in our case is a binary vector (a vector of ones) with the length equal to 1/10 of the voltage signal’s period. Whenever the result of the morphology (uMORPH) exceeds a set threshold value (Morph_THR), an event has occurred and must be recorded and classified. Together with the morphology result, the RMS value of uMORPH is also determined and is used for the classification stage. When the morphology result exceeds the threshold once, and the RMS value also has a spike, a transient was the cause. If, on the other hand, the morphology result exceeds the threshold frequently (for example, every period) and the RMS value is consistently higher, a waveform distortion is the cause. In Fig. 3, two of these situations are depicted. 0.08 0.06 0.04
u MORPH Morph_THR
0.02
RMS(u MORPH)
0.00
A. Transients and Waveform Distortions
0
Table I shows a summary of disturbances included in the first category of PQ disturbances and their typical parameters. The most distinctive feature of these disturbances is their frequency which is higher (usually significantly higher) than the power system’s fundamental frequency. TABLE I. – Typical Parameters of Transients and Waveform Distortions Disturbance
Duration
Frequency
Typ. voltage magnitude
Transient Harmonics Interharmonics Notching Noise
ns – µs steady state steady state steady state steady state
5 kHz – 5 MHz up to 5 kHz up to 6 kHz
0 – 8 pu 0 – 0.2 pu 0 – 0.02 pu
broad-band
0 – 0.01 pu
Figure 2 depicts the block diagram of the proposed detection and classification process of these disturbances.
Fig. 2. Block diagram of the algorithm that detects and classifies transients and waveform distortions.
50
100
a)
150 200 Time [ms]
0.04
300
u MORPH
Morph_THR
0.03
250
0.02 0.01 RMS(u MORPH)
0.00
b)
0
50
100
150 200 Time [ms]
250
300
Fig. 3. Morphology result and its RMS value for two different events. In a) the morphology result exceeds the set threshold only once while the RMS value also has a spike at the same instant. In b) the morphology result exceeds the threshold multiple times, and the RMS has a higher steady state value (no peaks). The following figures depict some examples of the disturbances from the first category of events measured in the monitored single-phase power systems. In Fig. 4 an example of a waveform distortion is shown. The duration of the distortion was 482.8 ms and its peak magnitude was 0.11 pu. The voltage signal with the disturbance is shown in Fig. 4a (Fig. 4c shows a detail of the disturbance) while Fig. 4b depicts the uMORPH signal which was used to detect and classify the disturbance. Note that the current version of the proposed algorithm
does not distinguish between individual types of waveform distortions (e.g. notching, harmonics, noise – see Table I).
Figures 5 and 6 show two examples of detected transients: an oscillatory transient (Fig. 5) and an impulsive transient (Fig. 6). Both sets include the waveform of the normalized voltage uNORM and the corresponding uMORPH signal employed in the detection and classification process.
u NORM [pu]
1.5
The oscillatory transient (Fig. 5) had a duration of 8.42 ms and a magnitude of 0.18 pu. The duration of the impulsive transient (Fig. 6) was 5.62 ms and its magnitude was 0.85 pu.
0
-1.5 0
a)
100
200
300 400 Time [ms]
500
600
Note that due to the length of the used structuring element, the minimal determined duration of the disturbance is 2 ms (1/10 of a 50 Hz signal’s period). However, this does not limit the ability of the algorithm to detect shorter events.
u MORPH [pu]
0.12 u MORPH 0.08
Morph_THR
B. Short and Long Duration Disturbances
0.04
The PQ disturbances included in the second category are voltage magnitude variations whose typical duration start from a half of the power system’s period and may exceed 1 minute – see Fig. 7.
0 0
b)
100
200
300 400 Time [ms]
500
600
u NORM [pu]
1.5
c)
0
-1.5 100
120
140 160 Time [ms]
180
200
Fig. 4. Example of measured waveform distortion: a) normalized measured voltage; b) morphology result used for detection of the event; c) detail of the voltage signal with clearly visible disturbance.
Fig. 7. Disturbance duration vs. magnitude characteristics of typical short and long duration PQ disturbances. 1.5 u NORM [pu]
u NORM [pu]
1.5
0
-1.5
-1.5
0
10
20 Time [ms]
30
40
u MORPH [pu]
10
20 Time [ms]
30
40
1
0.2 u MORPH
0.15
Morph_THR
0.1 0.05
u MORPH
0.8
Morph_THR
0.6 0.4 0.2 0
0 b)
0
a)
u MORPH [pu]
a)
0
0
10
20 Time [ms]
30
40
Fig. 5. Example of measured oscillatory transient: a) normalized measured voltage; b) morphology result used for detection of the event.
b)
0
10
20 Time [ms]
30
40
Fig. 6. Example of measured impulsive transient: a) normalized measured voltage; b) morphology result used for detection of the event.
would make the determination of the event’s duration using the DWT very inaccurate and unreliable. 2 u NORM [pu]
In this category of events, only the RMS values of the uNORM signal are determined (see Fig. 8). The RMS values are calculated from an interval one period long and are updated each half period of the uNORM signal. The values are then compared to two thresholds (RMS_THR+ and RMS_THR–) and the results are sent to classification.
1 0 -1 -2
a)
0
0.2
0.4
0.6 0.8 Time [s]
1
1.2
1
1.2
Fig. 8. Block diagram of the algorithm that detects and classifies short and long duration disturbances. Using the RMS values and the comparison with these thresholds, sags, swells, overvoltages, undervoltages and interruptions are detected, measured and their duration is determined. The distinction between the different disturbances is achieved using the disturbance’s amplitude and duration together with the typical characteristics for each disturbance. In Fig. 9 a typical sag disturbance is shown together with the RMS value evolution and the thresholds. The disturbance duration is 200.2 ms while during the disturbance, the minimum amplitude is 0.868 pu.
u NORM [pu]
2
0 -1 0
100
200 Time [ms]
300
400
u RMS [pu]
1.2 0.8 u RMS 0.4
RMS_THR
0 b)
0.8
u RMS RMS_THR
0.4 0
b)
0
0.2
0.4
0.6 0.8 Time [s]
Fig. 10. Example of measured interruption. a) normalized measured voltage and b) evolution of the voltage RMS.
4. Conclusions In this paper, the early stages of the development of a single-phase, DSP based power quality analyzer were described.
1
-2 a)
u RMS [pu]
1.2
0
100
200 Time [ms]
300
400
Fig. 9. Example of measured sag. a) normalized measured voltage and b) evolution of the voltage RMS. In Fig. 10 an example of a measured interruption is shown (the event is the same as shown in Fig. 2). For this example, the disturbance duration is 841 ms while the minimum amplitude is 0.004 pu. This interruption represents a typical case of a complex event where the traditionally used DWT does not provide reliable results. Especially the slow return to the nominal RMS voltage
The reliable measurement setup has been working in three different locations without interruption for the last few months detecting and registering real power quality events. While the algorithms have been improved, the classes and number of measured events have increased. Since the previously detected events were saved (together with the raw acquired data), the improved algorithms can be tested on the growing number of recorded events. As far as the actual algorithms are concerned, the traditionally used wavelet transform was considered. However, the DWT is very computationally demanding and is not useful when slow long duration disturbances occur. Because of this, two different algorithms were implemented and fine tuned. These algorithms split transients and waveform distortions from sags, swells, interruptions, overvoltages and undervoltages. Experimental results covering the most common measured PQ disturbances were presented. The next stages of the development will include increasing the ability of the algorithm to detect some types of disturbances (especially waveform distortions), increasing the accuracy of determination of disturbance’s parameters and the implementation of the proposed algorithms in a DSP based prototype.
Acknowledgement Work sponsored by the Portuguese national research project reference IT/LA/318/2005.
References [1] IEEE Std. 1159-1995, IEEE Recommended Practice for Monitoring Electric Power Quality”, The Institute of Electrical and electronics Engineers, Inc., New York, December 1995. [2] IEC 61000-4-30 Electromagnetic compatibility: Testing and measurement techniques – Power quality measurement methods, IEC 2003.
[3] S. Santoso, E. J. Powers, W. M. Grady, P. Hofmann, “Power quality assessment via wavelet transform analysis,” IEEE Trans. Power Del., vol. 11, no. 2 pp. 924-930, Apr. 1996. [4] H. He, J. A. Starzyk, "A self-organizing learning array system for power quality classification based on wavelet transform," IEEE Trans. Power Del., vol. 21, no. 1, pp. 286–295, Jan. 2006 [5] R. M. Haralick, S. R. Sternberg, X. Zhuang, “Image analysis using mathematical morphology,” IEEE Trans. Pattern Anal. Mach. Intell., vol. 9, no. 4, pp. 532-550, July 1987