Bozeman, Montana, USA. ABSTRACT. Hyperspectral imagery leverages the use of spectral measurements to detect objects of interest in a scene that may not ...
DEVELOPMENT OF A WEB-BASED APPLICATION TO EVALUATE TARGET FINDING ALGORITHMS D. Snyder, J. Kerekes
I. Fairweather, R. Crabtree
J. Shive, S. Hager
Rochester Institute of Technology Rochester, New York, USA
HyPerspectives, Inc. Bozeman, Montana, USA
YERC Bozeman, Montana, USA
ABSTRACT
data set without the ability to tune the results as can be done with known data sets.
Hyperspectral imagery leverages the use of spectral measurements to detect objects of interest in a scene that may not be discernable from their spatial patterns alone. This paper describes a project to make available to the community a set of hyperspectral airborne images on which anyone can run a target detection algorithm to find selected objects of interest in an image. The image and target spectral signatures are publicly available but the pixel location of targets within the image is withheld to allow for independent algorithm evaluation and scoring. To distribute these data, a website has been created which allows users to download the hyperspectral data and upload their target detection results which are then automatically scored. The Target Detection Blind Test website is located at http://dirs.cis.rit.edu/blindtest/.
The data for this project were collected as part of a field experiment conducted in July 2006 in and around the small town of Cooke City, Montana, USA. The hyperspectral imagery was collected by the HyMap sensor operated by HyVista [2]. The HyMap imagery has approximately 3 meter ground resolution. Civilian vehicles and small fabric panels were used as targets. Field measurements of the vehicle reflectance spectra were made using an Analytical Spectral Devices, Inc. FieldSpec Pro. Samples of the fabric panels were brought back to the laboratory and their reflectance spectra were measured by a Cary 500 spectrophotometer. The HyMap images were georegistered using ground control points and are available both in calibrated spectral radiance as well as in spectral reflectance after atmospheric compensation by the HyCorr routine.
Index Terms— Hyperspectral imagery, target detection 1. INTRODUCTION One of the challenges for the hyperspectral image target detection algorithm research community has been the lack of available well ground truthed imagery. The well-known Indian Pines AVIRIS data set [1] has served this function in the hyperspectral land cover classification community, but no such similar data set for target detection is available. While some hyperspectral target detection data sets have been studied extensively, they typically have restricted distribution and are not easily obtainable. To help fill this need we have created an interactive web site containing hyperspectral image data and an automated scoring routine. The site includes a self test image for which the target truth locations are provided, as well as a blind test image for which the truth locations are withheld. Upon submission of a target detection test result by a user, an automated scoring system reports back with a metric scoring the result. The objective of this is to allow the community to objectively compare algorithms on a common
978-1-4244-2808-3/08/$25.00 ©2008 IEEE
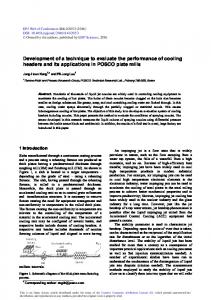
The rest of this paper describes the steps taken to prepare the data for distribution, the implementation and additional descriptions of the web site and the data, and the operation and method of scoring for the results. 2. DATA PREPARATION Several tasks have been accomplished to prepare the data. In order to help locate the targets in the hyperspectral images, high resolution color images collected from the aircraft at the same time as the hyperspectral data have been mosaicked together and geographically registered. Dozens of ground truth spectral measurements have been averaged to remove noise to be provided as truth target signatures. Using GPS coordinates of the targets collected at the same time as the airborne data, the high resolution imagery and our own detection algorithm results, the pixel location of those targets have been found in the hyperspectral images. For other targets without GPS information, the high resolution imagery and algorithm results alone were used to identify their pixel locations. A sample hyperspectral image from our data set is shown in Figure 1.
II - 915
IGARSS 2008
Figure 1. Color rendering of self test hyperspectral image.
Figure 2. Screenshot of home page for Target Detection Blind Test website.
II - 916
3. IMPLEMENTATION The implementation of this project is a web application that automatically scores the ability of target finding algorithms to identify regions of interest in the image. Figure 2 provides a screenshot of the web application, located at http://dirs.cis.rit.edu/blindtest/. The user is provided with two sample data sets, a self test set and a blind test set. There are several targets which vary in size, shape, and material in both data sets. The self test set contains a hyperspectral image, spectral reflectance measurements of targets, pixel locations of targets in the image, and sample target detection results. This data set allows the user to become familiar with the provided data. The blind test data
set includes a hyperspectral image and spectral information about targets, but does not include the pixel location in the image of the targets. This information is withheld and used by the web application to score the performance of algorithms. Once the user has generated results for blind test data, the user can upload them to the web application which scores the algorithm using the following method. The application finds the location of the selected target in the image and gets the pixel value at that location. The number of pixels in the scene with that value or a greater value is counted. This count is used as the performance metric. For this metric, a perfect score is one pixel, indicating that the algorithm gave the strongest response for the target pixel in the image.
Figure 3. Web site organization. 4. WEBSITE AND DATA The website is organized as shown in Figure 3. Upon registration the user can navigate among the pages shown to find out more about the project, download the data, upload results and review their scores along with the top scores of other users. Both datasets contain hyperspectral imagery, photographs of the scene, and spectral library files. Additionally, the self test dataset includes ENVI-compatible region of interest (ROI) files indicating the pixel locations of the targets in the image, and sample result files. The hyperspectral images are provided in both calibrated
spectral radiance and after atmospheric compensation to surface reflectance. There are seven targets in the self test image: four fabric panels and three vehicles. The blind test image has six targets: three different fabric panels and the same three vehicles, which are in different locations from the self test image. Figure 4 shows the three vehicle targets. 5. OPERATION AND SCORING After registering and activating their account, users can download the self test and blind test data sets. The self test data set includes the true locations for the seven test targets and the user can verify their algorithms on the truth. For the
II - 917
blind test image, the user is asked to generate a scalar image of the same size with each pixel containing a floating point number representing the “likelihood” of the pixel containing the target. The scoring will assume the higher the number, the more likely the target is present. For each target the user can upload a separate scalar image with these results for automatic scoring. Within a very short period, the web site
will report back to the user their score, which is the number of pixels with likelihood values exceeding that of the pixel corresponding to the correct location. This score represents the number of false alarms for correct detection of the target. As an example, a sample result image for the self test is shown in Figure 5, the results for a fabric panel with a score of 2 false alarms.
Figure 4. Target vehicles.
Figure 5. Self test sample result for fabric panel F1, the score for which was 2 false alarms (inside red box).
6. SUMMARY A website has been developed providing hyperspectral image target detection data sets for the community to use for algorithm development and independent evaluation. Two HyMap images from a July 2006 field data collection are provided along with spectra of the targets of interest. A self test image is provided with the true target locations. A blind test image is also provided along with a mechanism for uploading the results of a user’s algorithm and immediate automatic scoring. It is hoped these data will be adopted by the community and used to provide unbiased algorithm comparisons. ACKNOWLEDGMENT
reprints for Governmental purposes notwithstanding any copyright notation thereon. The views expressed in this article are those of the authors and do not reflect the official policy or position of the United States Air Force, the Department of Defense, or the U.S. Government. REFERENCES [1] Landgrebe, D.A.., Signal Theory Methods in Multispectral Remote Sensing, Wiley, Hoboken, New Jersey, USA, 2003. [2] Cocks, T., R. Jenssen, A. Stewart, I. Wilson, and T. Shields, “The HyMap Airborne Hyperspectral Sensor: the System, Calibration and Performance,” Proc. 1st EARSeL Workshop on Imaging Spectroscopy, EARSeL, Paris, pp. 37-43, 1998.
This work was supported by the Air Force Research Laboratory’s Sensors Directorate under agreement FA865004-1-1717 (BAA 04-03-SNK Amendment 3). The U.S. Government is authorized to reproduce and distribute
II - 918