A Life Cycle Inventory of existing biomass import chains for “green” electricity production
Kay Damen André Faaij
NW&S-E-2003-01 ISBN 90-393-3289-4 January 2003
This study is contracted by Essent Energie to the Department of Science, Technology and Society, Utrecht University. Contact persons: Kay Damen MSc, André Faaij PhD Department of Science, Technology and Society Copernicus Institute Utrecht University Padualaan 14 3584 CH Utrecht The Netherlands Phone: +31-30-2537600 Fax: +31-30-2537601 E-mail:
[email protected],
[email protected] Web: http://www.chem.uu.nl/nws
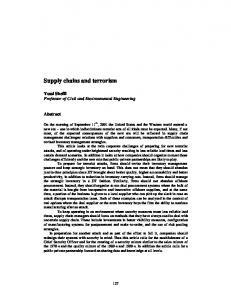
Abstract Essent Energie, a Dutch utility company, recently initiated the import of clean biomass for co-firing purposes in its coal plants. Key reasons for import are the fact that the availability of biomass with good co-firing properties in the Netherlands is limited and imported biomass can be competitive with biomass available in the Netherlands. In order to verify whether a certain biomass source meets formulated sustainability criteria, Essent Energie strives to create a certification system for biomass import. This study is set up to support the creation of such a certification system, by performing a Life Cycle Inventory (LCI) on biomass import chains. An LCI describes and quantifies the inputs (resources) and outputs (emissions) for each component of the biomass import chain, from biomass production to conversion. In doing so, the environmental performance can be determined. Objective The main objective of this study is to carry out a LCI on 2 existing biomass import chains to provide a basis for judging the overall environmental impact of biomass import and its application as fuel in coal plants to generate electricity by co-firing. Approach In this study, the import of wood pellets from Canada and palm kernel shells (PKS) from Malaysia are considered, 2 existing biomass import chains. The biomass is cofired in the Amer 9 unit, a 600 MWe coal fired power plant. For several components of the chain, case specific data provided by actual companies involved in the biomass import chain were used. If no such data were available, data from scientific publications and LCA databases were used. A mass and energy balance is set up to calculate the net avoided primary energy and the emissions of the most important greenhouse gasses, NOx, SO2, particulates and several heavy metals are quantified. The energy use and emissions related to biomass import and co-firing are compared to several reference situations for electricity/heat production (a coal plant in the Netherlands and the average Dutch fuel mix), in which the biomass fate when it would not have been used for energy purposes is accounted for as well. Also the use of biomass in the country where it is produced in stand-alone combustion systems is considered. Finally, the net avoided primary energy and emissions of biomass import and co-firing is compared to the reference systems and the use of biomass as fuel in the country where it is produced. Results As can be concluded from figure A-1 and A-2, biomass import and co-firing in coal fired plants in the Netherlands is an efficient way to reduce fossil fuel use and greenhouse gasses in comparison to power production from 100% coal or the average Dutch fuel mix. The emission of SO2, particulates (figure A-3) and heavy metals (figure A-4) of biomass co-firing are also lower in comparison to emissions caused by power production from fossil fuels. This is mainly explained by the fact that coal mining and transport to the Netherlands is an energy consuming process causing high emissions of especially CH4, SO2, particulates and heavy metals. Also the avoided emissions of CH4 caused by decomposition of wood residues at landfills in Canada and CH4, N2O, SO2 and particulate emissions caused by palm kernel shells burning in the open air in Malaysia contribute to the positive impact of biomass import and co-
firing. According to the results of this study, biomass import and co-firing has some less desired impacts as well. NOx emissions (figure A-3) might increase when importing and co-firing of wood pellet. Co-firing the biomass sources considered in this study will also lead to an increase in heavy metal content of the ash, due to the high quantities of mainly Mn in both wood pellets and palm kernel shells. This could hamper the return of the ash to the country where the biomass was produced. Ash contains significant quantities of nutrients required for biomass growth, so it would be desirable to recycle the ash to the forest in Canada or to the palm oil plantations in Malaysia. net avoided primary energy 1.2
7%
0.8
pellet co-firing vs Dutch power 20%
PKS co-firing vs 100% coal
0.4
PKS co-firing inc soybean production vs 100% coal pellet heat boiler Canada
0.2
pellet CHP plant Canada
0.6
PKS power plant Malaysia
0.0
Figure A-1: Net avoided primary energy per unit biomass energy of pellet and palm kernel shells (PKS) import and co-firing and use in stand-alone combustion systems in the country where the biomass is produced. Different co-firing shares were accounted for; the left column of each series refers to 7% (on mass basis) and the right column to 20%. The stand-alone combustion systems included in the analysis are local boilers for heat production and a small-scale CHP unit in Canada and a small-scale power plant in Malaysia. Different reference systems were used in the calculations. Dutch power refers to electricity generation from the average Dutch fuel mix. The application of PKS as cofiring fuel might compete with its application as resource for fodder production in the Netherlands. Therefore, the production and transport of an alternative resource (soybeans from the USA) is included as reference.
GHG emissions co-firing 1500 1000 g CO2-eq/kWh
GJprim/GJbio
1.0
pellet co-firing vs 100% coal
500 0 -500 -1000
pellet co-firing inc landfilling PKS co-firing inc pile burning PKS co-firing inc soybean production reference 1a: 100% coal reference 1b: Dutch power production
-1500
Figure A-2: GHG emissions of pellet and PKS import and co-firing in the Amer plant (g/kWh bio) in comparison to reference power production (g/kWh fossil).
NOx, SO2 and particulate emissions co-firing
g/kWh
3 2
pellet co-firing inc landfilling
1
PKS co-firing inc pile burning
0 -1
PKS co-firing inc soybean production
N S P
reference 1a: 100% coal
-2 -3
reference 1b: Dutch power production
-4
Figure A-3: NOx (N), SO2 (S) and particulate (P) emissions of pellet and PKS import and co-firing in the Amer plant (g/kWh bio) in comparison to reference power production (g/kWh fossil).
heavy metal emissions co-firing 60 40
µg/kWh mg/kWh
20 0 -20
pellet co-firing inc landfilling Cd Hg shm PKS co-firing inc pile burning reference 1a: 100% coal
-40 -60
Figure A-4: Heavy metal emission of pellet and PKS import and co-firing in the Amer plant in comparison to reference power production (µg/kWh fossil). The emissions of Cd and Hg are given in µg/kWh bio and the sum of other heavy metals (shm) is given in mg/kWh bio.
The prospects of pellet and palm kernel shell utilization as fuel in stand-alone combustion systems in the country where the biomass is produced is less promising then transporting the biomass to the Netherlands for co-firing, in spite of energy use and emissions caused by sea transport over a large distance. This is explained by the lower efficiency of those relatively small-scale systems in comparison to the Amer plant considered for co-firing. Secondly, the relatively high energy use and emissions of coal mining and transport to the Netherlands are avoided when co-firing biomass. A third reason that makes export preferable above intern use for these specific cases, is the larger share of renewables in the electricity mix of especially Canada, in which 60% of the electricity is produced in hydro-electric plants. Consequently, avoided emissions of biomass use are lower than when used in the Netherlands.
Conclusions This study has shown that the choice of the biomass resource, origin and reference system is very important for the environmental performance of biomass import and co-firing. The country/region of interest where a biomass potential exists, local conditions and market effects of biomass trade should be considered with care. Crucial aspects are the type of biomass, the fate of the biomass when it is not exported, the local/regional demand, competition with other applications and the energy system of a country. In conclusion, not only the availability, composition and price of biomass should be decisive, but also the context in which biomass production and trade occurs.
Abbreviations ______________________________________________________________ 1 1
Introduction ___________________________________________________________ 2
2
Methodology ___________________________________________________________ 4
3
2.1
Life Cycle Inventory ________________________________________________ 4
2.2
Overview considered chains __________________________________________ 6
2.3
Mass and energy balance_____________________________________________ 8
2.4
Emissions ________________________________________________________ 11
2.5
Nutrients _________________________________________________________ 15
System components ____________________________________________________ 16 3.1 Pellets production in Canada ________________________________________ 16 3.1.1 Production and logistics of wood and forestry residues __________________ 17 3.1.2 Pellet production________________________________________________ 18 3.1.3 Pellet transport to conversion plant _________________________________ 19 3.2
Palm kernel shells from Malaysia_____________________________________ 20
3.3
Composition of fuels _______________________________________________ 22
3.4 The coal fuel cycle and biomass co-firing ______________________________ 23 3.4.1 Coal mining and transport ________________________________________ 24 3.4.2 Amer coal-fired power plant_______________________________________ 24 3.4.3 CHP fired with 100% biomass _____________________________________ 27 3.4.4 Heat production in households _____________________________________ 28 3.5 Reference systems _________________________________________________ 28 3.5.1 Reference system 1b: Average Dutch electricity and heat production _______ 29 3.5.2 Reference system 2a: Average electricity and heat production in biomass exporting country ______________________________________________________ 30 3.5.3 Reference system 2b: Alternative biomass utilization ___________________ 31 4
Results_______________________________________________________________ 34 4.1
Mass balance _____________________________________________________ 34
4.2 Energy balance ____________________________________________________ 35 4.2.1 Energy use biomass supply________________________________________ 35 4.2.2 Net avoided primary energy _______________________________________ 36 4.3 Emissions ________________________________________________________ 39 4.3.1 Greenhouse gasses ______________________________________________ 40 4.3.2 NOx, SO2 and particulate emissions _________________________________ 44 4.3.3 Heavy metal emissions ___________________________________________ 47 4.4 5
6
Ash and nutrients__________________________________________________ 48
Discussion____________________________________________________________ 50 5.1
Mass balance _____________________________________________________ 50
5.2
Energy balance ____________________________________________________ 50
5.3
Emissions ________________________________________________________ 51
5.4
Ash recycling: nutrients and heavy metals _____________________________ 53
Conclusion ___________________________________________________________ 55
References _______________________________________________________________ 59 Appendix I: Emissions cultivation, harvesting, road and water transport _____________ 62 Appendix II: Emissions electricity and heat production ___________________________ 64 Appendix III: Emissions coal mining__________________________________________ 66 Appendix IV: NOx calculations Aspen plus _____________________________________ 67
Abbreviations BIJSTER BOO CHP EFB ESP FFB FGD GEMIS GHG GWP HFO kt ktdm ktfw LCA LCI LHV Mt PKS REB SIMAPRO SOTA tkm WWT
Model to determine several emissions in coal fired power plant Model to determine impact of co-firing on efficiency Combined heat and power production Empty fruit bunches Electrostatic precipitators Fresh fruit bunches Flue gas desulphurisation Global emission model for integrated systems, LCA software and database Greenhouse gas Global warming potential Heavy fuel oil kilo tonne kilo tonne dry matter kilo tonne fresh weight Life Cycle Assessment Life Cycle Inventory Lower heating value mega tonne Palm kernel shells Regulerende Energie Belasting (Regulatory Energy Tax, tax exemption for electricity from renewable energy sources) LCA software and database State of the art tonne kilometer Waste water treatment
1
1 Introduction In the Netherlands, the import of biomass from other countries for energy purposes is taking place and expected to grow. The main reason is to increase the share of renewable energy in the energy supply system in order to reduce the emission of greenhouse gasses. The Dutch government set a target in the 3rd energy paper, which implies that 10% of the primary energy demand in 2020 should be generated from renewable sources. Biomass (consisting of a wide variety of forestry and agricultural residues, organic waste and dedicated energy crops) is considered to play a key role in the realisation of this target; about 40% of the renewable energy should be produced from biomass. The energy sector will play a key role in the realisation of this target. In order to stimulate the production of renewable energy, the Dutch government introduced an incentive for the production of “green” (renewable) electricity. Green electricity is certified and the owner of the green certificate (often the distribution companies) is exempted from the so-called “regulerende energie belasting” (REB) for each MWh of green electricity sold, which makes green electricity economically attractive and competitive with electricity produced from fossil fuels/nuclear power. Moreover, the electricity producer directly receives an allowance for each green MWh produced. Essent Energie is one of the utility companies, which strives to increase its market share of green electricity. One of the activities they recently undertook to increase the share of green electricity is the import of clean biomass from other countries, which is co-fired in its coal plants. Wood pellets (from Canada and Latvia), palm kernel shells (from Malaysia, Indonesia and Nigeria) and citrus pulp (from Brazil) were purchased and co-fired. Furthermore, there are plans to import olive oil from Spain and palm oil for co-firing purposes. There are several reasons to import biomass instead of using biomass available in the Netherlands itself. Key reasons are amongst others availability, contractability, fuel quality (availability of biomass with good co-firing properties in the Netherlands is limited) and price (imported biomass can be competitive with biomass available in the Netherlands). Since green electricity has a high market value, strict requirements are set on the environmental and socio-economic impact of the product. In order to be sold as green electricity, the sustainability of biomass production and import should be guaranteed. This is a complicated task, since the production, harvesting and transport of the biomass takes place in another country, which makes it very hard to introduce and regulate rules with regard to sustainable production of biomass specific for the Netherlands. Especially large-scale, intensive biomass cultivation may have environmental and socio-economic impacts, which might not be in line with sustainability criteria. Essent Energie strives to create a certification system, allowing to verify whether a certain biomass source meets formulated criteria. This study is set up to facilitate the creation of such a certification system. The work consists of two key parts: a Life Cycle Inventory (LCI) is set up and an inventory is made of certification systems.
2
This report will focus on the first step. In basic terms, an LCI describes and quantifies the inputs (resources) and outputs (emissions) for each component of the chain, from fuel production to conversion. By doing so, the net avoided primary energy and the overall emissions of a product (which can be either biomass or electricity) can be determined for the complete biomass import and co-firing chain studied. Objective The objective of this study is to carry out a LCI on 2 biomass import chains to provide a test case and a basis for judging the overall environmental impact of biomass import and its application as fuel in coal plants to generate electricity by co-firing. In order to obtain results for the actual situation, the LCI is performed on 2 existing biomass import and co-firing chains: wood pellets from Canada and palm kernel shells from Malaysia. Approach A mass and energy balance is set up and the emissions of the most important greenhouse gasses, NOx, SO2, particulates and several heavy metals are determined. Nutrients are considered in a more general way. The complete chain is considered, including biomass production/collection, pre-treatment, local and international transport and conversion of the biomass into electricity. The energy use and emissions related to biomass import and co-firing are compared to several reference situations for electricity/heat production (a coal plant in the Netherlands and the average Dutch fuel mix). The fate of biomass when it would not have been used for energy purposes (dumping at landfills, burning, fodder production) is accounted for as well in energy use and emissions. Also the use of biomass in the country where it is produced in stand-alone combustion plants is considered. Finally, the net avoided primary energy and emissions of biomass import and co-firing is compared to the reference systems and the use of biomass in the country where it is produced/becomes available. From this comparison it can be concluded whether international biomass trade is a desirable strategy for currently available biomass resources, considering net avoided primary energy and emissions. In chapter 2, the methodology to determine net avoided primary energy and net emissions is discussed. Chapter 3 will describe the considered biomass import chains, including the data used for the analysis, from which the results are given in chapter 4. The results will be discussed more extensively in chapter 5 and conclusions will be drawn in the final chapter.
3
2 Methodology In the first paragraph of this chapter, the different steps and relevant issues of a LCI are explained. The second paragraph gives an overview of the different chains to be compared in this study. A mass and energy balance is set up for each chain, which is explained in more detail in paragraph 3. In paragraph 4, the methodology to determine the emissions occurring in the entire chain is discussed and in paragraph 5, the nutrient issue is described.
2.1 Life Cycle Inventory A Life Cycle Inventory (LCI) is the second step in a Life Cycle Assessment (LCA), which consists of 4 phases (CML 2001): 1. Goal and scope definitions 2. Inventory analysis (LCI) 3. Impact assessment 4. Interpretation In the first phase, the goal of the study is formulated in terms of the exact question, target audience and intended application. The scope of the study is defined in terms of temporal, geographical and technological coverage, and the level of sophistication of the study in relation to its goal. The inventory analysis is the phase, in which the product system(s) is defined: the system boundaries are set, the flow diagrams with unit processes are designed, data are collected for each process and allocation rules (when dealing with by-products) are performed. This results in an inventory table listing the quantified inputs and outputs top the environment associated with the functional unit. Energy and raw material requirements, emissions, effluents and solid waste are quantified for each process, from resource extraction to final product use and disposal (Cradle-to-the-Grave approach). In the impact assessment, the set of results of the Inventory analysis is further processed and interpreted in terms of environmental impacts and societal preferences. A list of impact categories is defined, and models for relating the environmental interventions to suitable category indicators for these impact categories are selected. Finally, the category indicator results can be grouped and weighted to include societal preferences of the various impact categories. Interpretation is the phase, in which the results of the analysis and all choices and assumptions made during the course of the analysis are evaluated, and overall conclusions are drawn (CML 2001). In this study, the impact assessment (phase 3) will not be performed. In the introduction, the goal and scope were already defined. This chapter will first consider the considered product system, the emissions to be considered, the type of data and the issue of allocation. The product system When performing an LCI, a distinction should be made between the economy (product system) and the environment by defining an economy-environment border. In the LCI, energy flows and emissions crossing this border are quantified. In this study, the choice of the boundary between the product system and environment system is done according to the guidelines for detailed LCA given in (CML 2001). 4
Human control over processes is the main criterion for regarding a process as a unit process and hence include it in the product system. The product system considered in this study includes a biomass import chain and several reference systems. The biomass import chains consist of production and transport of biomass and fossil fuel and the conversion into electricity/heat. These chains are then compared to different reference systems, which include an alternative electricity/heat production system and the fate/application of biomass when it is not exported for co-firing purposes. Only 1st and 2nd order energy inputs (based on LHV) are accounted for in the energy balance; 3rd order energy inputs (for construction and dismantling of capital goods) are not considered, which is justified considering the very small contribution to the total energy use. This is confirmed in several LCA studies, e.g. in a LCA study for an integrated coal gasification combined cycle from Smit (1994). Another reason not to include 3rd order energy inputs is that these are rather similar for comparable chain types. Emissions to air In this study, the most important greenhouse gases (CO2, CH4 and N2O), NOx, SO2, particulates and heavy metals are considered. Although the emission of CH4 and N2O are generally small in comparison to CO2 emissions, they are accounted for, since the greenhouse warming potential of these compounds is much higher than for CO2. NOx and SO2 emissions cause acid rain and the former also stimulates the formation of smog. Fine particles have proven to cause serious health problems. Air emissions of Cd, Hg and other heavy metals combined (As, Co, Cr, Cu, Mn, Ni, Pb, Sb and V) occurring during production, transport and conversion of the fuels are estimated as well. Cd and Hg are considered separately, since these metals are extremely toxic. In analysing heavy metal emissions, emphasis is put on the conversion part. Nutrients Nutrient flows of biomass export and conversion are quantified in a more general way. It is determined how much nutrients are removed from the production sites and how much can theoretically be recovered and returned to the fields in the form of ash. Type of data In this study, data used to perform the LCI can be divided into 3 categories, ranging from very accurate and specific to very rough and general. 1. Case specific data provided by actual companies involved in the biomass import chain. 2. Data from scientific publications or quotes from experts. 3. Data from LCA databases and energy statistics. If possible 1st category data were used and verified by comparing them with scientific literature. If no specific data on chain components were available, data from scientific publications and LCA databases were used. Allocation In this study, several allocation problems will arise. For residues, the energy use and emissions caused by the cultivation/harvesting of the main crop might be divided over different products. In that case, allocation of energy use and emissions is required. Different possibilities exist for allocation; it can be done on the basis of the mass,
5
economic value, energy and exergy content of the product. It was decided to allocate energy use and emissions on mass base, the method traditionally used in energy analysis. Allocation is also required to assess which part of the emissions is attributed to electricity and which to heat when the considered conversion system is a CHP plant. In this study, emissions are allocated to the exergy content of heat and power. This method will be explained in more detail in paragraph 2.4.
2.2 Overview considered chains As mentioned before, different chains will be considered in this study: import and cofiring of biomass and the use of biomass in the country where it is produced as a fuel in different stand-alone combustion systems. Each chain is compared to one or more reference systems, which represent the operations that will be avoided when (co-) firing biomass. In the figures below, the considered chains, including the reference systems, are summarised.
System 1: Biomass import and co-firing Biomass collection and pre-treatment in country A
Biomass transport to country B
Power/heat production by co-firing biomass in coal plant in country B
Coal transport to country B
Power/heat production in coal plant in country B
Reference system 1a: Coal fuel cycle Biomass alternative country A(B)
Coal mining in country C
Reference system 1b: Energy production based on national fuel mix Biomass alternative country A(B)
biomass
Fuel production in country C
Fuel transport to country B
coal
Average national power/heat production in country B
average fuel mix
Figure 2-1: Biomass import and co-firing in the Netherlands with reference systems Country A = biomass exporting country (Canada/Malaysia) Country B = biomass importing country (Netherlands) Country C = coal/gas/oil producing country, can be country B
System 1 includes the production and transport of biomass from Canada/Malaysia to the Netherlands, where it is co-fired in a coal-fired power plant. The dashed line distinguishes the operations performed in the country where biomass/fossil fuel is produced from the operations, which occur in the Netherlands, where the biomass is co-fired. As mentioned before, the reference system consists of a system for power/heat generation from fossil fuels and a system that considers the fate of biomass when it is not exported as co-firing fuel.
6
The most logical reference for the generation of electricity/heat by co-firing is the same coal-fired power plant without co-firing; the co-fired biomass in fact replaces a part of the coal. It was decided to consider the average electricity/heat production based on the Dutch fuel mix as well. The reason to include this reference system is because it can be argued that the electricity produced by co-firing biomass in a coalfired power plant replaces an equivalent electricity from the grid (a reservoir with electricity produced by different plants and fuels). The fate of biomass depends on the resource and the country. It is plausible that if residues will not be used, they are burned in the open air or disposed at a landfill. For palm kernel shells, the situation is more complicated, since this residue is used as fuel in the local palm oil industry. It might also be used as a resource for the production of fodder in the Netherlands. If a growing demand of palm kernel shells for energy purposes abroad is created, competition may occur with local energy application and fodder production. Since this study deals with the excess, competition with local energy application is not considered. When palm kernel shells are indeed used as resource for fodder production, the energy use and emission associated with the production and transport of an alternative resource for fodder production (e.g. soybeans) should be accounted for. It was decided to consider a best case (burning of palm kernel shells in the open air) and worst case (fodder production of palm kernel shells) scenario, to get insight in the ranges of the overall environmental impacts.
System 2: Energy production from biomass in boiler or CHP/power plant Biomass collection and pre-treatment in country A
Power/heat production from biomass in boiler or CHP/power plant in country A
Biomass transport in country A
Reference system 2: Energy production based on national fuel mix Biomass alternative country A
biomass
Fuel production in country C
Fuel transport to country A
Average national power/heat production in country A
average fuel mix
Figure 2-2: Energy production from biomass in the country where biomass is produced with reference system Country A = biomass exporting country (Canada/Malaysia) Country C = coal/gas/oil producing country, can be country A
System 2 investigates the option to use the biomass in the country where it is produced in a boiler or CHP/power plant fuelled with 100% biomass. The reason to include these systems in this study is to investigate the overall efficiency of a biomass trade system from a broader point of view. From the perspective of avoiding CO2 emissions, it might be more efficient and environmental benign to use the biomass in the country where it is produced/becomes available in a boiler or CHP/power plant fuelled on biomass instead of transporting it to the Netherlands and use it as co-firing fuel. In Canada, basically 2 options can be distinguished. The pellets can be used as fuel in a stand-alone CHP plant. Pellets can also be used as a fuel for boilers to 7
produce heat in detached houses. Another option is to use the forestry residues (bark, sawdust and shavings) directly in the place where they are produced (chip mills or sawmills), replacing the electricity required in the production of chips, timber wood. This option is not considered in this study. It must be noted that the electricity in Canada is generated to a large extent by hydro-electric plants, so the emission reduction potential will be limited. In Malaysia, it is not probable that biomass is used to produce heat for district heating. There might be a heat demand in the industry, but this is not considered in this study. For Malaysia, we consider production of electricity in a stand-alone biomass fired power plant.
2.3 Mass and energy balance The first step in the LCI is to set up a mass balance, which is the basis for the energy balance and is also relevant for quantifying the emissions. An important element for biomass import in the mass balance is to account for dry matter losses occurring in the biomass supply chain. The moisture content of the biomass is another important parameter, because it changes along the chain and thus influences the total required capacity of logistic facilities. The energy balance is set up to determine primary energy inputs for each system component in order to calculate the amount of primary energy, which can be avoided by the replacement of coal by biomass. The net avoided primary energy and avoided emissions can be attributed to a GJ of biomass or a kWh of produced electricity/heat. The formulas and assumptions made to calculate the avoided primary energy are discussed below. Net avoided primary energy In order to calculate the net avoided primary energy per unit biomass energy for cofiring, the energy content of the avoided coal should be corrected for: • Primary energy use to produce and transport the biomass. • Effects of co-firing on the electric efficiency • Primary energy involved with avoided operations that would have taken place if the biomass had not been co-fired. Primary energy inputs for biomass production and logistics The energy inputs for the production, pre-treatment and transport of the biomass are determined and normalised with respect to the amount of dry tonnes of biomass before conversion into electricity. For residues (e.g. palm kernel shells and the raw material for pellet production), it is reasonable not to account for energy use and emissions caused by the cultivation/harvesting of the main crop, because the residues can be considered as a waste stream. On the other hand, it can also be argued that the energy use for the residues should be accounted for by allocation, since the residues are effectively used. In this study, both cases are included in the calculations. As mentioned before, allocation of energy use and emissions is performed on mass base. Co-firing biomass in the CHP plant The electricity and heat production is calculated assuming a certain co-firing share of biomass on mass base. When co-firing biomass, the electricity and heat output can decrease for several reasons:
8
•
• • •
The power consumption of coal mills might increase when biomass is added to the coal mixture, because biomass has a different structure than coal (which affects the sizing) and eventually by the higher total mass throughput when co-firing (see last point). Biomass has a different chemical composition, so the gas stream might have a different heat exchange coefficient, influencing the boiler efficiency. With increasing biomass portion, a slight decrease of carbon burnout could occur (Hamelinck and Faaij 2001). The biomass has a lower calorific value than coal and therefore the total mass input has to be increased to keep the heat input equal to 100% coal when co-firing biomass. This compensation can often be executed at low co-firing shares. However, at higher co-firing shares, relatively more air is required to burn the fuel mix in comparison to coal only. This causes a higher throughput of flue gas through the boiler, which may result in a lower heat transfer for steam production (more heat will be lost through the chimney). This effect will depend on the design of the boiler. When the boiler is designed for a maximum gas volume, the fuel input must be reduced, which results in a lower steam production. This is also referred to as de-rating and will be discussed in detail in section 3.4.2 for the coal plant considered.
Avoided operations Operations that are avoided when co-firing biomass include mining and transport of the avoided coal and burning/decomposition of the biomass. When biomass is disposed at a landfill when it is not exported for energy purposes, CO2 and CH4 will be formed during decomposition. The latter can be collected to produce electricity in a gas-engine and this is accounted for in the net avoided primary energy (landfill gas utilisation). When palm kernel shells are used for fodder production, the primary energy use to produce and transport an equivalent amount of an alternative resource for fodder should be accounted for. To calculate the net impact (in energy terms) of co-firing biomass, the eventual loss in electricity/heat production caused needs to be expressed in net terms per unit of cofired biomass. The avoided primary energy per unit biomass energy in comparison to a conventional coal fired power plant (reference system 1a) can be calculated by means of the formula below: (% biomass × E coal ) (E coal × η e ,coal − E cofiring × η e ,cofiring ) − − Ebio sup ply − E alternative η η e,average coal sup ply η= Ebiomass
in which: η = net avoided primary energy per unit biomass energy (MJprim/MJbiomass) %biomass = biomass co-firing share on energy base Ecoal = energy input 100% coal (MJprim) Ecofiring = energy input co-firing (coal and biomass) (MJprim) ηcoalsupply = efficiency coal production and transport ηe coal = electric efficiency 100% coal ηe cofiring = electric efficiency co-firing 9
ηe average = average electric efficiency Dutch fuel mix Ebiosupply = energy required for the production and transport of the biomass (MJprim) Ealternative = energy use/production of alternative fate biomass, which is either dumping at landfills or fodder production (MJprim) Ebiomass = biomass input co-firing (MJbio) The first term in the numerator represents the energy content of the avoided coal when co-firing, including coal mining and transport. The second term gives the energy penalty caused by lower efficiency when co-firing and de-rating. When de-rating is applied at the considered plant, the fuel input (and hence the energy input) is reduced in comparison to the 100% coal situation, decreasing the net avoided primary energy. When the average Dutch power and heat production are used as reference (reference system 1b), it is assumed that an equivalent amount of electricity and heat should be delivered by the Dutch electricity production system and gas fired boilers, respectively. In formula: E cofiring × η e,cofiring × % biomass E cofiring × η th ,cofiring × % biomass + − Ebio sup ply − E alternative η e,average η th ,average η= Ebiomass
in which: η = net avoided primary energy per unit biomass energy (MJprim/MJbiomass) Ecofiring = energy input co-firing (coal and biomass) (MJprim) ηe cofiring = electric efficiency co-firing ηth cofiring = thermal efficiency co-firing ηe average = average electric efficiency Dutch fuel mix ηth average = average thermal efficiency %biomass = biomass co-firing share on energy base Ebiosupply = energy required for the production and transport of the biomass (MJprim) Ealternative = energy use/production of alternative fate biomass, which is either dumping at landfills or fodder production (MJprim) Ebiomass = biomass input co-firing (MJbio) When the biomass is not transported to the Netherlands for co-firing purposes, but is used in the country where it is produced as a fuel in biomass dedicated CHP plant, the equation given below is used to calculate the net avoided primary energy per unit biomass energy. Ebiomass × η e ,CHP Ebiomass × η th ,CHP + − Ebio sup ply − E alternative η e,average η th ,average η= Ebiomass
in which: η = net avoided primary energy per unit biomass energy (MJprim/MJbiomass) Ebiomass = biomass input (MJbiomass) ηe CHP = electric efficiency biomass dedicated CHP ηth CHP = thermal efficiency biomass dedicated CHP
10
ηe average = average electric efficiency Dutch fuel mix ηth average = average thermal efficiency Ebiosupply = energy required for the production and transport of the biomass (MJprim) Ealternative = energy use/production of alternative fate biomass, which is either dumping at landfills or fodder production (MJprim) When considering a power plant fuelled with biomass as alternative system, the net avoided primary energy per unit biomass energy can be calculated with this formula as well, using the electric efficiency of the CHP plant without heat production and setting the heat terms at 0. Moreover, the average electric efficiency of the country where the biomass is produced must be used. For the calculation of the net avoided primary energy when using pellets to produce heat in household boilers (Canada), this equation can also be applied, using the thermal efficiency of such boilers and the average Canadian electric efficiency and setting the electricity terms at 0.
2.4 Emissions Emissions are quantified and attributed to a kWh power/heat. For a power plant fired with 100% coal, all the emissions can be attributed to the coal. In the co-firing systems and the systems in which heat/power is produced with 100% biomass, emissions are determined for a kWh of power and heat from biomass (kWhe,bio and MJth,bio), because after all, we focus on the emissions of a “green kWh”. Hereto, it must be determined which part of the produced power/heat is attributed to biomass in order to define a kWh from biomass. This is done on the basis of the energy input. Allocation is required to assess which part of the emissions is attributed to heat and which to coal when the considered system is a CHP plant. As mentioned earlier, emissions occurring at CHP plants are allocated to the exergy content of heat and power. In formula:
XE =
E X E + βH
XH =
βH X E + βH
in which: XE = emission of compound X allocated to electricity production XH = emission of compound X allocated to heat production X = total emission of compound X E = net electricity production of the CHP plant (enthalpy basis) H = net heat production of the CHP plant (enthalpy basis) β = the ratio between the exergy and enthalpy of the heat produced. For electricity this ratio is unity. For heat flows the value is much lower depending on the temperature of the steam. Typical values for β are 0.4 for process steam and 0.2 for hot water in district heating systems (Blok 2001). In the figure below, the different conversion systems with the formula to calculate the emissions occurring during conversion are given.
11
emissions coal
electricity
xcoal ,e =
X total E + βH
heat
xcoal ,th =
( X total × βH ) /( E + βH ) H
CHP plant
emissions coal
xbiomass ,e =
heat
xbiomass ,th =
( X total × β ( H × % biomass ) /( E × % biomass + β ( H × % biomass ) H
electricity
xbiomass ,e =
X total E + βH
heat
xbiomass ,th =
( X total × βH ) /( E + βH ) H
CHP plant biomass
X total + β ( H × % biomass )
electricity
E × % biomass
emissions biomass
CHP plant
Figure 2-3: Emissions related to different conversion systems xcoal,e = emission of compound X for 100% coal allocated to electricity (g/kWhe) xcoal,th = emission of compound X for 100% coal allocated to heat (g/MJth) xbiomass,e = emission of compound X allocated to electricity produced from biomass (g/kWhe) xbiomass,th = emission of compound X allocated to heat produced from biomass (g/MJth) Xtotal = total emission of compound X (g) E = net electricity production of the CHP plant (kWhe) H = net heat production of the CHP/heat plant (MJth) β = ratio between the exergy and enthalpy of the heat produced %biomass = biomass co-firing share on energy base
In order to calculate the net emissions per kWh, the emissions from avoided operations should be subtracted from the emissions occurring during production, transport and conversion of the biomass. When palm kernel shells are applied as resource for fodder production, the emissions related to the production and transport of an alternative resource should be added to the emissions occurring during production, transport and conversion of the biomass. Below, the emission of each compound in the various stages of the chain and of the avoided operations is discussed. CO2 emissions CO2 emissions occur in various stages: during mining and transport of coal, collection and transport of biomass, but mainly during combustion of coal/biomass. CO2 emissions caused by either the use or the decomposition of biomass are assumed to be zero, since it can be argued that in both cases the released CO2 makes part of the short-rotation cycle; it is absorbed by the trees/crop again in a next growth cycle. The only CO2 emissions that are attributed to biomass, are those caused by fossil fuel burning for biomass collection and transport.
12
CH4 and N2O emissions Methane and N2O emission factors are less well known than CO2 emission factors. From methane emissions within the coal fuel cycle, the emissions associated with the mining of coal are by far the largest; estimates of methane emissions from conventional coal combustion are much smaller and therefore not accounted for in this study. It should be kept in mind that methane emissions for mining are highly site specific. In particular, methane emissions from opencast mining are at least an order of magnitude smaller than underground mining (CIEMAT 1999). Essent Energie purchases its coal mainly from opencast mines (de Vos 2002). The methane emission during anaerobic decomposition of biomass when the biomass is not applied as fuel (or to produce a fuel) can be significant as well. When biomass is used for co-firing, these emissions are avoided. N2O emissions during transport and power production are generally very low. N2O emissions might play a role in the production of biomass; they occur during fertilizer production and can occur during denitrification of nitrogen in the soil. NOx emissions In general, the majority of NOx emissions (NO and NO2) occur during power production. Unfortunately, NOx emissions caused by power production are very hard to predict, since they depend not only on the nitrogen content and volatility of the fuel. Measurements of NOx emissions during co-firing tests at the Naantali power plant in Finland showed that the boiler and operating conditions (load and stoichiometric ratio) have a strong influence on emissions as well. If the temperatures in the boiler stay sufficiently low (limiting the formation of thermal NOx) the NOx emissions can be reduced by co-firing, since the nitrogen content of the biomass is generally lower than for coal. A high-volatile matter content of the fuel (biomass has a significantly higher volatile matter content than coal) combined with low NOx combustion techniques can reduce the NOx emissions formed. The principle of low NOx burners in reducing NOx emissions is based on the effect that by staging the addition of air, fuel is devolatised under conditions of low stoichiometry, promoting the conversion of fuel nitrogen to molecular nitrogen. The higher the volatile content of the fuel, the better, because nitrogen, bound to volatiles, is released already in the burner zone, so that NOx formation can be controlled and it can be controlled (Kostamo 2002). Moreover, low NOx burners will also probably reduce the formation of thermal NOx formation. Since no data of measurements of NOx emissions when co-firing are available for the plant considered in this study, NOx emissions were estimated by means of a simple model. Aspen plus is used to estimate the difference between NOx emissions with 100% coal and co-firing. The distribution of N between (NO, NO2 and N2O) is calculated, assuming a chemical equilibrium in the boiler. It is assumed that NOx emissions are solely due to the amount of fuel-bound nitrogen in the biomass (nitrogen in the air is modelled inert), just like Mann (2001) assumed in her study on biomass co-firing in coal plants. This is a highly simplified approach leading only to order of magnitude estimates; it is however a manageable approach given the absence of data. Full combustion modelling for the considered plant is out of the scope of this study though. SO2 emissions Nearly all sulphur in the fuel is oxidised to SO2 during combustion. Between 85-90% of the formed SO2 is converted into gypsum (CaCO3 reacts with SO2 into CaSO4 and
13
CO2) in the flue gas desulphurisation unit (FGD) and the remaining SO2 is emitted into the atmosphere. A small fraction of the SO2 is converted into SO3, which is to a large extent reabsorbed to form sulphates with the alkali metals in the fly ash. Part of the SO2 also migrates to the fly ash, to what extent depends on the alkali earth metal content of the fly ash (Hamelinck and Faaij 2001). SO2 emissions are a function of the sulphur content in the fuel and the efficiency of the flue gas desulphurisation unit. When co-firing biomass, it can be expected that the change in SO2 emission at the power plant will mainly depend on the sulphur content of the biomass. In this study, it is assumed that the change in SO2 emission in comparison to the basic situation (100% coal) is linearly dependant from the fuel sulphur content.
Particulate emissions Particulates emissions occur in various stages: during mining and transport of coal and limestone, collection and transport of biomass, during pelletisation and during combustion of coal/biomass. It must be noted that the emission of particulates is not clearly defined; each database/literature source uses other definitions. In GEMIS, the emissions of particulates are presented, whereas SIMAPRO gives the emission of dust, which is further classified in coarse and PM 10 (mobile/stationary). In this study, particulates are not further classified in the size of the particles; all particles, both coarse and fine, are accounted for. The change in particulate emissions occurring during power generation when cofiring biomass in comparison to the reference situation of 100% coal was calculated by the BIJSTER model developed by the KEMA. By means of this model, several emissions occurring in a coal-fired power plant can be predicted on the basis of coal and biomass composition and quantities. A co-firing share of 10% biomass (on energy basis) and a mixture of different biomass sources, among which wood and citrus pellets, palm kernel shells, and rest products of cacao, is assumed for these calculations. This calculation is used to estimate the particulate emission occurring during co-firing of wood pellets and palm kernel shells (no distinction is made). It is assumed that the change in particulate emission is 100% attributed to biomass. Cd, Hg and other heavy metal emissions Heavy metals are emitted throughout the entire chain, to the air, water and in the form of solid waste (ash). As mentioned earlier, emphasis in this study is put on the conversion part. The electrostatic precipitators (ESP’s), where fly ash is partly removed from the flue gas and the FGD are the main sinks for trace elements, among which heavy metals. Trace elements can be classified into 3 groups. Category 1 heavy metals (e.g. Al, Ca, Fe and Mg) do not vaporise during combustion (Meij 1994). Heavy metals from category II (among which As, Cd, Cu, Pb, Se and Zn) volatise during combustion, but condense on the fly ash particulates and are removed in the electrostatic precipitators. The content of several heavy metals is further reduced in the FGD by the removal of particulate matter, to which several heavy metals are adsorbed. Mercury, a category 3 element (those elements are mainly present in the gas phase), vaporises during combustion and condenses within the installation (in the ESP and FGD), but a great part is emitted to the atmosphere. The distribution of the heavy metals between bottom ash, fly ash and air will not change when co-firing biomass, so the emission of heavy metals with co-firing biomass is completely depending on the heavy metal content of the biomass in
14
comparison to coal. So heavy metal emissions are assumed to be linearly dependent on the heavy metal content of the fuel.
2.5 Nutrients When biomass is applied as (co-firing) fuel, nutrients (N, P, K, Ca, Mg) are removed from the system in the country of origin. These elements are needed for the growth of the plants that form the feedstock of biomass utilization (Narodoslawsky and Obernberger 1996). Nitrogen is emitted to the air during combustion of the biomass. P, K, Ca and Mg are mainly encountered in the fly and bottom ash in the form of P2O5, K2O, CaO and MgO. It is possible to close the nutrient cycle by returning the ash to the fields, where it can be applied as fertilizer. The problem is however, that besides nutrients, the ash also contains heavy metals. The highly volatile heavy metals (like Cd, Hg, Pb and Zn) are mainly encountered in the cyclone fly ash and the filter fly ash. Especially cadmium poses a risk to the use of wood ash in agriculture. The least volatile heavy metals (like Co, Ni, Cr and V) are concentrated in the bottom ash and the cyclone fly ash. The main problem is the cyclone fly ash, which contains relatively high amounts of heavy metals (especially Cd), but also contains relatively large amounts of nutrients. Disposal of contaminated cyclone fly ash causes a significant loss of nutrients and moreover, is a considerable economic burden to biomass utilization (Narodoslawsky and Obernberger 1996). The ash from coal-fired power plants is generally applied as resource in construction material. However, too much biomass ash can disturb this market. For ash utilization, it is relevant whether biomass is applied as fuel in dedicated plants or as co-firing fuel in coal-fired plants. When biomass is co-fired in coal fired plants, the ash will also be contaminated with heavy metals originating from the coal. In that case, return of the ash to the fields seems undesirable. Since clean biomass like wood pellets and palm kernel shells generally contain small quantities of heavy metals, the recycling of ash from biomass combustion plants seems more feasible.
15
3 System components In this chapter, the different fuel chains and chain components considered are described in detail, including the relevant data required to perform the LCI. As mentioned in the previous chapter, 3 categories of data distinguished. Case specific data delivered by companies involved in the biomass supply are the composition of the fuels, the technical data of the pellet production process and the technical data and emissions of the conversion systems, which are given in the so-called MER report set up for biomass co-firing (Boudewijn and Koopmans 2002). Data from publications or quotes from experts are mainly used for technical data on biomass production and logistics. The LCA databases considered in this study are GEMIS and SIMAPRO 5.0. These databases contain many industrial and agricultural processes, transport systems and products (fuels, agricultural and industrial products). For each process, the resource use and emissions are reported. Emissions and resource use include 3rd order energy inputs and emissions caused by production of capital goods and fuels. Data from LCA databases are mainly used for the emissions of biomass and coal production and transport and also for the emissions of electricity and heat production in the Netherlands and Canada. International energy statistics from the IEA are used for the average efficiency of electricity and heat production in the considered countries.
3.1 Pellets production in Canada In several regions in Canada, large amounts of residues become available at chip mills and sawmills, among which bark, sawdust and shavings. These residues can be used to produce pellets by a densification process. Pellets are a high quality fuel, since the energy density is very high and they can immediately be substituted for coal (Suurs 2002). Due to the high energy density, pellet transport is more efficient and cheaper than transport of bulky biomass like chips. Moreover, transport and storage of pellets is safer and the energy content does not change during storage, because decomposition does not occur. Pellets are used as fuel for large electricity and heat utilities (for co-firing purposes) and also for small heating systems in households. One of the suppliers of wood pellets is Fulghum Fiber Fuels Ltd Georgia USA. In 2001, the first load of 7132 metric tonnes wood pellets was delivered. The total logistic chain is given in figure 3-1: lumber
sawdust shavings bark
sawmill forestry area
pelletisation
stems
pellets chip mill
bark
chips
Figure 3-1: Pellet production and transport
16
harbour Halifax
harbour Rotterdam
Amer plant
In summary, wood cultivated for timber or chip production is transported to saw/chip mills, where bark, sawdust and shavings become available. These residues are transported to a plant and converted into pellets, which are transported to the Netherlands by truck, ship and barge and used as co-firing fuel in a coal plant. Below, each component is discussed extensively. 3.1.1 Production and logistics of wood and forestry residues Wood (spruce, fir, pine and birch) is extracted from a large forestry area near Truro, Nova Scotia. The harvest area is cut clear completely, after which the area is checked on natural growth. Only if necessary, additional trees are planted (Essent Duurzaam 2001). It is assumed no energy is required for tree cultivation. Harvesting is performed mechanically by harvesters (de Vos 2002), which fell, delimb and buck the trees right in the stump area. A forwarder carries the logs to the road and loads it to a truck, ready for transport. The best trees are delivered to sawmills and the less qualitative stems are transported to chip mills by truck with a load of approximately 35 t (Stadig 2002). The average distance between production sites and the Mactara sawmill, the largest supplier of residues, is estimated at 75 km. The Keywood chip mill, a large supplier of sawdust to the pellet production plant, is located 50 km from the production sites (Essent Duurzaam 2001). At the saw/chip mill, the trees are debarked by a drum debarker, after which the bark is crushed by a hammer mill. The 300 kWe drum debarker has a capacity of 180 m stem/minute (t/min) (Stadig 2002). The diameter of the stems varies between 9 and 25 cm, an average of 15 cm is assumed. The density of the stems is estimated at 0.8 tfw/m3, assuming a bulk density of 0.5 tdm/m3 for spruce and pine (Patterson 1988) and an average moisture content of 60% of the dry mass (Forest Products Laboratory 1999). The residues from the sawmills (sawdust, bark and shavings) and the chip mills (bark) are transported to the pellet plant by trucks with a load of 30 t. The average transport distance between the chip mill and the pellet plant is estimated at 75 km (Stadig 2002). The sawmill is located very close to the pellet plant, so additional transport of residues from the sawmill is not accounted for. It is unknown how much wood is exactly harvested to produce the resource quantities given in table 3-2, since the mass balance of the sawmill (Mactara) is not available. The amount of wood to be harvested is estimated using the total amount of bark required to produce 1 tdm of pellets (see table 3-2) and the bark content of the stems (0.14 tfw bark/tfw stems) bark reported by Keywood in (Essent Duurzaam 2001). It is assumed that the stems delivered to Mactara according this calculation will produce the quantities of sawdust and shavings required for pellet production. Biomass losses occurring during loading and transport of the wood to the mills are assumed to be 0.
Energy use and emissions Data for energy use of wood harvesting of stems and residues are given in table 3-1. No data for diesel use of Canadian trucks were available, so road transport of wood, residues and pellets is assumed to be performed with trucks with a capacity of 35-40 t and a diesel consumption of 0.45 l/km, which is based on Swedish trucks reported in (Suurs 2002). For the emissions occurring during harvesting and forwarding the logs, data given in GEMIS for a process describing the cutting of pine logs are used (see appendix I). Emissions occurring during truck transport are calculated by means of
17
emission data given per tkm in GEMIS for a truck plus trailer with capacity of 32-40 t and a pay load of 27 t (see appendix I). Table 3-1: Energy use and capacity of biomass harvesta
Single-grip harvesterb Capacity (m3/productive machine hour) Diesel use (l/m3) Hydraulic oil consumption (l/m3) Chainsaw oil consumption (l/m3) Forwarderb Capacity (m3/productive machine hour) Diesel use (l/m3) Hydraulic oil consumption (l/m3)
15- 20 1.5 0.03-0.04 0.025-0.04 20 0.7-0.8 0.01-0.02
a
Allocation of energy use and emissions occurring during harvest and transport of the stems is done by multiplying the total energy use and emissions with the bark content of the stems, which is 0.136 tfw bark/tfw stems (Essent Duurzaam 2001). b These values represent capacity and consumption of diesel and lubricants for single-grip harvesters and forwarders for Swedish conditions (Athanassiadis 2002). No data for Canadian harvesters/forwarders were available, but in the harvest area considered in this study, the same machinery is used.
3.1.2 Pellet production Pellets are produced at Fulghum Fibre fuels. The annual pellet production is about 100 kt/yr, which requires 169 kt48%/yr of residue-mix and 39 kt50%/yr of sawdust for heat production. The pellets produced consist of circa 65% bark and 35% sawdust/ shavings. The moisture content of the pellets is about 6-8% and the pellet diameter and length are 7 mm and 20-40 mm, respectively. In the table below, the resources to produce 100 kt pellets are given: Table 3-2: Resources to produce 100 kt pellets
Resource 72 kt bark 41 kt sawdust 27 kt shavings 22 kt bark 46 kt bark
Moisture content 57% 50% 17% 50% 50%
Supplier Mactara sawmill Mactara sawmill Mactara sawmill Keywood chip mill Other mills
The pelletisation process involves several steps. First, the residues are crushed by a coarse hammer mill, after which they are dried by dry air with a temperature of 650°C to a moisture content of 6%. Stones are removed and the dried residues are crushed again by two fine hammer mills, which make them ready for compression under high pressure and temperature. The final step is cooling and sieving, after which the pellets can be transported. It was estimated that dry matter losses during pelletisation are roughly 1%. The thermal (steam and hot dry air) requirements in the process are fulfilled by a boiler, which is fired with sawdust. In addition, 2000 kW electricity is required in the pelletisation process (Essent Duurzaam 2001).
18
Energy use and emissions The primary energy use for the electricity requirement is calculated by means of the average Canadian electric efficiency. The diesel and lubrication oil for internal transport and loaders given in (Kjellström 2002) are used (respectively 11 and 2.2 kWh for 1 tonne of pellets). The emissions caused by burning the sawdust are estimated by means of emission data for a furnace fuelled with wood presented in SIMPAPRO (see appendix II). Dust emissions occurring during pellet production are unknown, but are strongly dependent on the installation and filters used. Indirect emissions related to the generation of the required electricity are calculated by means of the emission data for the average Canadian electricity production presented in GEMIS (see appendix II). 3.1.3 Pellet transport to conversion plant Pellets are transported to the harbour of Halifax over a distance of 60 km by trucks with a capacity of 35 t. In the scenario of pellet use as fuel in a central CHP plant, it is assumed pellets are transported by truck over a distance of 100 km. When the pellets are supplied to households for local heat systems (pellet boilers), the transport distance is expected to be even larger: a value of 200 km is assumed. At the harbour, the pellets are stored in large silos with a total capacity of 144,000 m3 and then loaded to a sea ship, which takes the load to Rotterdam. The capacity of the ocean vessel is 9000 tonne. The distance between Halifax and Rotterdam is 2705 sea miles (5000 km). In Rotterdam, the cargo is unloaded and subsequently, the pellets are transferred to barges, which deliver the biomass to the Amer power plant, located 52 km from the Rotterdam harbour. At this moment, there is a temporal biomass deposit in Waspik, from where the biomass is transported to the Amer plant by truck. However, biomass storage capacity is constructed beside the power plant, so in the nearby future, the biomass can directly be transported to the power plant. In this study, it is assumed biomass is directly transported to the Amer plant.
Energy use and emissions The diesel consumption of a truck for pellet transport with a maximum capacity of 35 t (80 m3) is 0.45 l/km (Suurs 2002). Emissions for truck transport are calculated by means of emission data given per tkm in GEMIS for a truck plus trailer with capacity of 32-40 t and a pay load of 27 t (see appendix I). During loading of the pellets to the ship, dust emissions were observed (Essent Duurzaam 2001), but these are not quantified and will also depend on the measures taken. The average of the fuel consumption of two ocean vessels transporting conventional bulk with a capacity of 21300 and 7000 m3 (corresponding to 12780 and 4200 t pellets) is used for the vessel transporting pellets. Fuel consumption for the return trip is not accounted for, since this ship will transport another bulk good on the way back (Essent Duurzaam 2001). For the barges transporting the biomass from Rotterdam to the Amer plant, diesel consumption is assumed to be 0.10 g/tkm according to data for barges presented in (Kaltschmitt and Reinhardt 1997). It is assumed that the barge returns empty to Rotterdam, so the fuel consumed on the way back should be accounted to biomass transport. Fuel consumption during freights of non-dedicated transports is assumed to be 65% of the full load consumption (Suurs 2002). Emissions caused by ship transport (both ocean and inland) presented in SIMAPRO are used (see appendix I), although these data are not really up-to-date (they refer to the time period 1990-1994).
19
Table 3-3: Energy use and capacity ocean vessel and barge transporting pellets
Ocean vessel Aa Capacity (m3) Fuel use (t HFO/km) Ocean vessel Ba Capacity (m3) Fuel use (t HFO/km) Average fuel consumption pellet vessel (kg HFO/tkm) Barge (inland transport) Capacity (t)b Fuel use (kg diesel/tkm)c
21300 0.03 7000 0.015 0.003 2000-2200 0.01
a
(Suurs 2002) (de Vos 2002) c (Kaltschmitt and Reinhardt 1997) b
3.2 Palm kernel shells from Malaysia Malaysia is the major producer of palm oil in the world (Husain et al. 2002). During the production of palm oil, several residues become available, among which fibre, (palm kernel) shells, the empty fruit bunches and palm oil mill effluent. In general, the fresh fruit bunch (FFB) contains (by weight) about 21% palm oil, 6-7% palm kernel, 14-15% fibre, 6-7% shell and 23% empty fruit bunches (Husain et al. 2002). The major part of the fibres and shell is applied as fuel in boilers to produce steam and electricity for the palm oil production process. The total electrical power generation capacity in the palm oil industry in Malaysia for own milling process consumption is 250 MWe, representing only 20% of the potential energy of the solid wastes (Shamsuddin 2002). Much of the residues are wasted by pile burning in the open air with attendant air pollution, dumped in areas adjacent to the mill, or utilized as manure in the palm oil plantation (Husain et al. 2002). An alternative for these resources, which does not require additional investment, is export for energy purposes or fodder production. Essent Energie recently started to import palm kernel shells. The total logistic chain is given in figure 3-2: other residues (excess fibres, EFB, mill effluent)
palm plantation
palm oil mill FFB
excess pellets
harbour Malaysia
harbour Rotterdam
palm oil
Figure 3-2: Logistics palm kernel shells
An oil palm starts to produce three years after field planting (Mahlia et al. 2001). Energy inputs during cultivation are given in the table below.
20
Amer plant
Table 3-4: Energy input palm oil cultivation (Wambeck 2002).
Energy input (GJ/ha/yr) Fertilizersa Pesticides, herbicides, rat baits Machinery Others
19.2 11.2 0.8 5.14 2.06
a
3 rounds a year or equivalent to twice rate of 650 kg N/ha/yr. Extra fertilizer application might be necessary when the palm kernel shells would have been applied as fertilizer if not exported. However, it is unknown whether the excess of palm kernel shells is indeed returned to the fields and if so, how much would be applied as fertilizer. So in this study, no additional energy is accounted for.
The FFB are harvested manually and transported to the mill located within a range of 1-10 km from the plantations by trucks with a load of 1-4 ton (Shamsuddin 2002). The average FFB yield is approximately 25 t/ha/yr (Mahlia et al. 2001). At the mill, the fruit bunches are stored for several days. Palm oil is extracted from the mesocarp and kernel of the matured fruits on the fresh fruit bunches (FFB). First, the fresh fruit is cooked before digested and pressed by using steam (sterilisation), after which the sterilised fruits are separated from the sterilised bunch stalks. Then the fruit is reheated (digestion) and the oil is extracted by pressing. Finally, the crude oil is extracted and the nut and fibre is separated. The electrical and steam requirements of the palm oil production are 20-25 kWh and 0.73 t steam per tonne of fresh fruit bunches, respectively. The boilers are fuelled with shells and fibre. According to Shamsuddin (2002), between 50 and 70% of the available shells are required for this energy requirement. In this study, it is assumed that 60% of the available shells are being used as boiler fuel and the remaining 40% can be either exported or burned/dumped/ applied as fertilizer. This number is required to calculate the amount of FFB to be harvested to produce 1 tonne excess palm kernel shells. The palm kernel shells, which become available at mills in the entire country and are exported, are transported to the harbour (Port Klang and Kuantan port) by small trucks with a capacity of 3-10 tons. An average distance of 100 km is assumed. The same logistics are assumed when the palm kernel shells are applied as fuel in a central electricity plant in Malaysia. At the harbour, the shells are loaded to an ocean vessel transporting bulk material of the type Panamax (de Vos 2002). The maximal capacity of this vessel is 60 kt and shells are loaded in quantities of minimal 10 kt. The harbours are located in proximity of Singapore. The distance between Singapore and Rotterdam is 8350 sea miles (around 15500 km). In Rotterdam, the cargo is unloaded and transferred to inland ships, which deliver the biomass to the Amer power plant. It is assumed that dry matter losses are negligible along the chain. In a study of Suurs (2002) considering different biomass logistic chains, it is assumed that dry matter losses only occur as a result of decomposition when biomass is chipped and has a moisture content above 20%. Considering the moisture content of palm kernel shells (approximately 7%), this seems justified.
Energy use and emissions The emissions caused by production and application of fertilizers are reported in (Kaltschmitt and Reinhardt 1997) and are given in appendix I. No specific data on energy use and emissions for truck transport in Malaysia are available. Data for a 6 wheel diesel truck with a maximum load of 5.3 t used to transport agricultural residues in Thailand were used (Dick 2000). Average diesel use is between 0.25 l/km 21
(unloaded) and 0.29 l/km (loaded). Emissions for light trucks driving in rural areas give in GEMIS are used (see appendix I). For the ocean vessels used to transport palm kernel shells, the HFO consumption of 40 kt vessels transporting wood chips between the US and Japan is used, which amounts 0.0022 kg/tkm (Schonewille 2002). Emissions from ocean vessels presented in SIMAPRO are used (see appendix I). The energy use and emissions of barges have already been discussed in the previous paragraph.
3.3 Composition of fuels The composition of wood pellets, palm kernel shells and coal is given in table 3-5. Table 3-5: Composition fuels considered in this study (ar = as received, db = dry basis)
Resource Wood pellets LHV (MJ/kg, ar) 18.03a Proximate analysis (wt%, ar) Moisture content 5.16a Ash 2.01a Volatiles 72.14a Ultimate analysis (wt%, ar) C 50.1b H 5.5b O 43.6b N 0.27b S 0.02a (0.03b) Elemental analysis (ppm, db) As