PNAS PLUS
Differential modulation of global and local neural oscillations in REM sleep by homeostatic sleep regulation Bowon Kima,b,1, Bernat Kocsisc,d,1,2, Eunjin Hwanga, Youngsoo Kimc,e, Robert E. Streckerc,e, Robert W. McCarleyc,e, and Jee Hyun Choia,b,2 a Center for Neuroscience, Korea Institute of Science and Technology, Seoul 02792, South Korea; bDepartment of Neuroscience, University of Science and Technology, Daejeon 34113, South Korea; cDepartment of Psychiatry, Harvard Medical School, Boston, MA 02215; dDepartment of Psychiatry, Beth Israel Deaconess Medical Center, Boston, MA 02215; and eResearch Service, Veterans Affairs Boston Healthcare System, Brockton, MA 02301
Edited by Nancy Kopell, Boston University, Boston, MA, and approved January 5, 2017 (received for review September 23, 2016)
|
chronic sleep deprivation low-frequency cortical oscillation oscillation EEG topography sleep function
|
|
T
| fast cortical
here has been substantial recent progress in understanding the neuronal mechanisms of two seemingly unrelated but, more likely, complementary functions of sleep. The first, conceptualized as the synaptic homeostasis theory (1), produced experimental evidence for a global downscaling of synaptic strength during sleep to offset the unsustainable upscaling associated with neuronal activation during the preceding period of wakefulness (2). The second line of research keeps accumulating data to support an active role of sleep in offline memory processing (3) and argues that certain synapses not only escape global downscaling in sleep but instead are potentiated; firing rate and synchrony in select neuronal ensembles representing newly acquired and deemed relevant information are increased. The mechanisms of how these two proposed functions of sleep are reconciled on the network or ensemble level are poorly understood. From the very beginning, both processes were linked to specific oscillatory patterns of neuronal activity. The synaptic homeostasis hypothesis, and sleep homeostatic regulation in general, was correlated with EEG delta power (4) and memory consolidation was associated with episodic fast oscillations during non-REM (NREM) sleep (5). Recent evidence from network level investigations concur. On the one hand, different measures of homeostatic downscaling on the neuronal level (synaptic depotentiation, decrease in firing rate, decreased synchrony, etc.) were shown to correlate with the global decrease in delta power (6). On the other hand, reactivation of memory traces primarily occur during spindle-ripple events (7) and requires the temporal organization provided by local fast oscillations for coordination of firing within local neuronal ensembles. Slow and fast oscillations, respectively, support global and local processing, not only in NREM sleep but also in any brain state, in general. Slow oscillations (delta, theta, alpha, beta1) allow
www.pnas.org/cgi/doi/10.1073/pnas.1615230114
synchronization of neuronal activity over large networks, whereas fast oscillations (beta2, gamma, ripple) coordinate neuronal firing locally. Here, we test the hypothesis that global processes, such as homeostatic regulation, may differentially affect fast versus slow oscillations, in accordance with each category of oscillations appearance and different functional roles in sleep-related processing. In fact, in NREM sleep the synaptic downscaling was shown to entirely materialize in delta-dominated interripple periods, whereas within-ripple firing and synchrony actually increased over the course of sleep (8). In rapid eye movement (REM) sleep, slow and fast oscillations occur simultaneously and are strongly coupled. However, as we demonstrate in this study using a chronic sleep restriction (CSR) paradigm, slow and fast oscillations undergo entirely different adaptations to homeostatic challenge which may benefit different sleep functions. REM sleep shows strong homeostatic regulation; acute losses are compensated by rebounds proportional to the lost amount of REM sleep (9, 10). However, recent studies using the CSR paradigm, which better resembles common human sleep loss (11, 12), revealed limitations of this mechanism, demonstrating that after the first day of sleep loss, REM sleep rebound settles on a persistent elevated level and does not show a progressive increase over days as REM sleep debt keeps accumulating. The goal of Significance This study demonstrates that slow and fast cortical oscillations undergo different adaptations to homeostatic challenge of chronic sleep deprivation, which may benefit different functions of sleep. When mice sleep only 6 h/d for 5 d, rapid eye movement (REM) sleep settles on a persistently elevated level, even though sleep debt continues to accumulate. Using highdensity EEG, we found that different forms of slow oscillations follow this general pattern, whereas all high-frequency oscillations showed progressive daily increases. Slow and fast oscillations play distinct roles in coordination of brain cell activity on different scales, and thus our results help to reconcile two seemingly opposite functions of sleep in synaptic homeostasis and sleep-dependent memory consolidation. Author contributions: Y.K., R.E.S., R.W.M., and J.H.C. designed research; B. Kim, E.H., and J.H.C. performed research; B. Kim, B. Kocsis, Y.K., and J.H.C. analyzed data; B. Kocsis contributed new reagents/analytic tools; and B. Kocsis and J.H.C. wrote the paper. The microarrays are available by contacting J.H.C. The authors declare no conflict of interest. This article is a PNAS Direct Submission. Freely available online through the PNAS open access option. 1
B. Kim and B. Kocsis contributed equally to this work.
2
To whom correspondence may be addressed. Email:
[email protected] or
[email protected].
This article contains supporting information online at www.pnas.org/lookup/suppl/doi:10. 1073/pnas.1615230114/-/DCSupplemental.
PNAS | Published online February 13, 2017 | E1727–E1736
NEUROSCIENCE
Homeostatic rebound in rapid eye movement (REM) sleep normally occurs after acute sleep deprivation, but REM sleep rebound settles on a persistently elevated level despite continued accumulation of REM sleep debt during chronic sleep restriction (CSR). Using highdensity EEG in mice, we studied how this pattern of global regulation is implemented in cortical regions with different functions and network architectures. We found that across all areas, slow oscillations repeated the behavioral pattern of persistent enhancement during CSR, whereas high-frequency oscillations showed progressive increases. This pattern followed a common rule despite marked topographic differences. The findings suggest that REM sleep slow oscillations may translate top-down homeostatic control to widely separated brain regions whereas fast oscillations synchronizing local neuronal ensembles escape this global command. These patterns of EEG oscillation changes are interpreted to reconcile two prevailing theories of the function of sleep, synaptic homeostasis and sleep dependent memory consolidation.
this study was to test how this behavioral/state level regulation of sleep rebound after deprivation translates to population activity of different cortical networks. Using high-density EEG as depicted in Fig. S1 (13), we investigated the dynamics and topography of slow and fast oscillations in REM sleep during CSR in which mice were only allowed to sleep 6 h/d for 5 consecutive days. We found an overall increase in oscillatory synchronization in different frequency bands over wide areas of the cortex and the underlying hippocampus. However, there was a clear separation in the pattern of activation between slow and fast oscillations across days, such that slow oscillations followed the pattern of persistent elevation paralleling the behavioral adaptation of REM sleep, whereas power at higher frequencies showed cumulative increase, starting with slight or no change on the first day of sleep restriction (SR1) and reaching a maximum on SR5. This rule was common for different areas of the cortex even though specific frequency bands of both low and high-frequency components and their cross-frequency coupling (CFC) patterns varied by cortical region. Results Persistent Increase in REM Sleep Time Rebounds After Repetitive Sleep Deprivation. Sleep-wakefulness architecture during the daily
6-h periods from Zeitgeber time (ZT) 0 to ZT6 was analyzed for a baseline (BL) day, CSR days SR1, SR3, and SR5 and days R1 and R3 of the recovery that followed the 5 d of CSR. The timeline for the experiment is depicted in Fig. S2. During the daily sleep opportunities on CSR days, total sleep time gradually decreased throughout CSR, whereas there was no change on SR1 compared with BL (two-way ANOVA, P = 0.380; Fig. 1A). Substantial sleep loss reached 16 ± 13% on SR3 (7.0 ± 5.6 min of sleep loss per
hour, P = 0.006) and 27 ± 14% by SR5 (11.1 ± 6.4 min, P = 0.001). Total sleep time fully recovered after 2 d of recovery sleep (twoway ANOVA, P = 0.051 for R1 and P = 0.804 for R3). These results were consistent with previous observations using this paradigm (11, 14). Decomposition of total sleep to NREM and REM sleep states showed that the reduction of total sleep time during CSR was due to reduction in NREM sleep (Fig. 1B), whereas the time spent in REM sleep actually increased. Importantly, REM sleep rebound immediately appeared during the first sleep opportunity on SR1 which occurred immediately after the first 18 h of acute sleep deprivation and continued throughout the sleep deprived nights on a nearly constant level (2.2 ± 1.0, 1.8 ± 1.2, and 2.3 ± 1.2 min/h REM sleep increase on SR1, SR3, and SR5, respectively). The amount of this rebound REM sleep increase was between 40–70% of normal REM sleep time (cf., 3.8 ± 1.2 min/h on the day before CSR). REM sleep rebound disappeared as soon as CSR ceased, in R1 (two-way ANOVA, P = 0.632). Persistent increase in REM sleep and progressive reduction of NREM sleep resulted in a cumulative homeostatic increase in REM/NREM ratio (Fig. 1C). We further analyzed the details of REM sleep time to verify the pattern of persistent REM sleep elevation as opposed to a progressively increasing rebound due to accumulation of homeostatic REM sleep drive over 5 d. First, analysis of REM sleep rebound in individual mice revealed an SR1 enhancement in all mice, with no coherent additional enhancements on the subsequent days (Fig. 1D; null-hypothesis test for slope of a regression line, P = 0.859) [i.e., four of nine mice showed positive trends (R2 = 0.368 ± 0.126), whereas the remaining five showed negative trends (R2 = 0.739 ± 0.119)]. Second, we analyzed REM sleep
Fig. 1. Changes in sleep architecture across CSR. (A) Grand average of total sleep time during sleep opportunity, which is a cumulative NREM and REM states during ZT0 to ZT6. BL, SR, and R refer to baseline, sleep restriction, and recovery days, respectively. (B) Grand average of total duration of wake, NREM, and REM states within ZT0 to ZT6 plotted with respect to days. (C) Percentage of NREM and REM sleep stages. (D) Significant increase in REM episode duration within ZT0 to ZT6 in SR days compared with BL. Note that the increase was not progressive. Colors indicate individual mice. I Time-resolved spectrum in BL (top) and SR5 (bottom) in an individual mouse. Gray traces (Movement) show the signal of an accelerometer. Time is referenced to ZT0. (F) Representative sleep-wake patterns in BL, SR1, and SR5 of the same mouse shown in E. (G) Scatter plot of REM sleep episode duration in each mouse. The size of marker corresponds to the occurrence rate. The order of column in each day block corresponds to the order of animals, representing the same order for different days. (Inset) Grand average of REM sleep episode duration. Error bars indicate the SEM of the mice. Only sleep across ZT0 to ZT6 was counted. All comparisons were carried out using nonparametric ANOVA. *P < 0.05.
E1728 | www.pnas.org/cgi/doi/10.1073/pnas.1615230114
Kim et al.
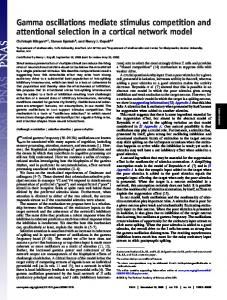
Persistent Increase in REM Sleep Low-Frequency Oscillations During CSR. The Fig. 2 A and B heat maps show the topographies of
relative EEG spectral power during REM sleep after sleep deprivation compared with baseline power at each frequency in the range of 1–90 Hz. Color represents the relative power change and black dots on each map indicate the channels with significant change in power (paired t test, P < 0.05) compared with REM sleep in BL. The hertz-by-hertz relative power maps indicate that sleep deprivation affects the EEG rhythms in a frequency and region dependent manner. Potentially, some of these observed changes in different EEG components may reveal progressive homeostatic modifications from SR1 to SR5, in contrast to the persistent REM sleep time rebound. We used two statistical measures to identify these patterns in the EEG power in different frequency bands. First, spectral power in different frequency bands were averaged within cortical regions on SR1, SR3, and SR5 and compared with BL (Table S1). Second, linear regression of EEG spectral power in these frequency bands was calculated for individual mice and the slope was statistically tested for the group using the sign test to distinguish the patterns of progressive increase or decline from persistent level throughout SR1 to SR5 (Table S2). Fig. 2A compares low-frequency oscillations on SR1 and SR5, and Fig. 2B compares high-frequency oscillations, derived from the same EEG signals. At low frequencies, statistically significant increase in power was observed from SR1 through SR5 in different frequency bands (black dots in the maps in Fig. 2A) accompanied with modifications of the dominant frequencies within these bands. In contrast, fast oscillations were not altered in SR1, but distinct high-frequency EEG components significantly increased in SR5 at specific locations (Fig. 2B). Delta power (1–4 Hz). Persistent elevations in the delta range were concentrated in specific narrow-band oscillations in the motor and sensory cortex at 1 Hz and in the prefrontal cortex (PFC) at 2 and 4 Hz (Fig. 2A). When averaged over the motor and the sensory cortex regions, 1-Hz power showed significant elevations after SR1 (P = 0.045 and P = 0.004), SR3 (P = 0.027 and P = 0.031), and SR5 (P = 0.021 and P = 0.038; Table S1) compared with BL with no significant trend of increase or decrease over SR days in either the motor or sensory cortex (P = 0.169 and P = 0.512; Table S2). A widely distributed significant increase at 4 Hz (P = 0.043 and P = 0.011 in motor and sensory cortex) after SR1 became restricted in the following CSR days to a strong tendency of increase, selectively localized in the two most anteriorly located leads (channels 1 and 2) (P = 0.092 and P = 0.090 on SR3 and SR5, respectively), however, again with no significant trend over the SR days (Table S2). The spatial and frequency distribution of narrow-band delta oscillations during REM sleep localized at specific regions were markedly different from wideband delta activity of NREM sleep which showed uniform increase during CSR at all delta frequencies over the entire cortex (Fig. S3). Theta power (5–10 Hz). Theta power (5–10 Hz) showed similar dynamics to the alterations observed in delta power [i.e., an initial wide-band (5–10 Hz) theta increase on SR1 compared Kim et al.
PNAS PLUS
with BL over the entire cortex and the underlying hippocampus was followed by a robust redistribution of power within the theta band after repetitive sleep deprivation]. Theta2 power (8–10 Hz) followed the pattern of the persistent elevation throughout the next 4 d of SR [P < 0.05 for SR1, SR3, and SR5, over all cortical regions (Table S1) and no significant trend in alterations over subsequent SR days (Table S2)]. In contrast, low-frequency theta (5–7 Hz) showed a reduction in power starting on SR3 and reaching its maximum reduction on SR5 (decrease on SR5: P = 0.002; and negative trend: R2 = 0.72 ± 0.13, P < 0.001). Progressive Increase in REM Sleep High-Frequency Oscillations During CSR. Beta power (15–30 Hz). Overall, beta activity after SR1 was similar
to BL but then gradually increased in subsequent days in the somatosensory cortex (not significant on SR1 and SR3; P = 0.009 on SR5; Table S3). This trend was verified by linear regression (R2 = 0.43 ± 0.11, P = 0.022; Table S4). However, post hoc detailed analysis of frequency distribution within the beta power band (Fig. 2C) showed that homeostatic activation of beta power in the somatosensory cortex was limited to beta2 frequencies (18–27 Hz; strongest at 27 Hz) (R2 = 0.57 ± 0.11, P < 0.001), whereas changes in beta1 power (12–16 Hz) followed the pattern of persistent elevation throughout SR1-SR5 (tendency of persistent increase: P = 0.031, P = 0.109, and P = 0.054 in SR1, SR3, and SR5, respectively; with no trend, P = 0.729). Gamma power (30–90 Hz). Homeostatic changes were observed in specific EEG gamma band frequencies during REM sleep responses to CSR (Fig. 2B). Similar to beta2 power alterations, gamma power showed a slight but nonsignificant increase after SR1 which was followed by a progressive rise after repetitive days of SR. After SR5, enhancements in the gamma1 range (30–50 Hz) compared with BL were observed over a wide area including prefrontal (P = 0.025), motor (P = 0.039), and sensory (P = 0.090) cortices, with positive trends verified by regression analysis in all regions (R2 = 0.65 ± 0.11, P < 0.001 in PFC; R2 = 0.60 ± 0.12, P = 0.008 in motor; and R2 = 0.52 ± 0.12, P = 0.022 in sensory cortex). In the gamma2 range (70–90 Hz) EEG power significantly increased in sensory cortex (and possibly in the underlying hippocampus) in SR3 and SR5 but not in SR1 (P = 0.782 in SR1, P = 0.049 in SR3, and P = 0.010 in SR5) and an increasing trend was observed in the motor cortex (R2 = 0.42 ± 0.13, P = 0.013). Table 1 and Table S5 summarizes the statistically significant changes in distinct EEG rhythms during REM sleep throughout the periods of SR and recovery sleep compared with the BL. A persistent increase (i.e., a pattern similar to increase in REM sleep time) was found at low frequencies, including selective delta range oscillations (1 Hz in somatosensory motor and 4 Hz in PFC), theta2 (over all regions indicating its primary origin in the underlying hippocampus), and beta1 (over the somatosensory cortex) rhythms. In contrast, high-frequency oscillations showed progressive increase over the CSR days, specifically in the beta2 (sensory cortex), gamma1 (prefrontal and somatosensory-motor cortex), and gamma2 band (centroparietal leads, suggesting somatosensory cortex and volume conduction from the hippocampus). Interaction Between Slow and Fast Oscillations in REM Sleep During CSR. It was also noticeable in the topographies (Fig. 2 A and B)
that progressive increase in fast oscillations at different frequencies colocalize with increases in low-frequency oscillations characteristic for specific areas. Thus, progressive increases in beta2 (18–27 Hz) coincide with enhanced narrow-band oscillations at 1 Hz in motor cortex; progressive increase in gamma1 power (30– 50 Hz) coincide with narrow-band 4-Hz oscillations persistently increased in PFC, and the region of progressive increase in fast gamma power (70–100 Hz) overlaps with the region of permanent increase in theta2 oscillations. Therefore, we next PNAS | Published online February 13, 2017 | E1729
NEUROSCIENCE
episode lengths in individual mice and found that longer REM sleep episodes occurred more frequently after sleep deprivation. Fig. 1 E and F compares BL and SR5 in a representative experiment on an individual mouse; the duration of each REM episode for each mouse is plotted in Fig. 1G. Average REM sleep episode duration increased significantly from 77 ± 10 s during BL by 24 ± 9 s, 26 ± 11 s, and 21 ± 22 s in CSR days 1, 3, and 5, respectively (two-way ANOVA: P = 0.0001 for SR1, P = 0.0001 for SR3, and P = 0.02 for SR5) with no positive trend from SR1 to SR5 (Fig. 1G, Inset). Regression analysis on median and maximal values of REM sleep episode duration was performed; neither of these parameters correlated with CSR days but both showed statistically significant, persistent increase compared with the BL.
Fig. 2. Changes of slow and fast EEG rhythms in REM sleep. Topographic changes of slow (A) and fast (B) EEG powers in SR days with respect to BL power in REM sleep. The numbers next to each map show the corresponding EEG frequency in Hz. The channel locations of significantly increased or decreased EEG power with respect to baseline power are marked as black dots. The rhythms of interests were defined as follows: delta (1–4 Hz), theta1 (5–7 Hz), theta2 (8–10 Hz), beta1 (12–16 Hz), beta2 (18–30 Hz), gamma1 (30–50 Hz), and gamma2 (70–100 Hz). Note increased power (yellow to red to dark red and black dots) in slow rhythms in A in both SR1 and SR5 over different regions in contrast to increases in high-frequency power (B) limited to SR5. (C ) The location of EEG electrodes over different cortical regions and power ratio (±SEM) of significantly changed EEG rhythms across SR and R days. Note persistent increases in slow rhythms and progressive increases in fast rhythms. The cortical regions of brain are shown as the representation of EEG channels. A regression analysis was performed on EEG powers with respect to SR days in each mouse, and P values show the null-hypothesis test on the slope sign. The r value was calculated for significantly increasing rhythm. Note persistent elevation for slow rhythms (upper row) and progressive rise in power for fast rhythms (lower row).
E1730 | www.pnas.org/cgi/doi/10.1073/pnas.1615230114
Kim et al.
PNAS PLUS
Table 1. Summary of significant relationship between EEG power and sleep pressure EEG changes across CSR Progressive increase Significant positive trend Significant increase in SR5 but not in SR1 (without significant trend) Persistent increase Significant increase in SR1, SR3, and SR5 (without significant trend) Trend of increase in 2 SR days
Prefrontal
Motor
Somatosensory
Gamma1 Beta2 (SR5)
Gamma1, Gamma2 Beta2 (SR5)
Beta2, Gamma1 Gamma2 (SR3, SR5)
Theta2*
1 Hz, Theta2*
1 Hz, Theta2*
1 Hz (SR3, SR5), 4 Hz (SR3, SR5)
Progressive decline Significant negative trend
—
Beta1 (SR1,SR5)
—
Theta1
*Originating in underlying hippocampus. —, not shown.
SR5 relative to this baseline. Three topographically distinct CFC patterns can be clearly distinguished. First the most prominent CFC was observed between theta2 and gamma2 oscillations in centro-parietal recordings. Differential comodulograms (Fig. 3B) show a strong enhancement of this CFC component by CR5, along with a spatial expansion covering a wider area. Second, less prominent but significant MI was observed between 1 Hz and beta2 in motor and somatosensory cortex in BL which also expanded to the most lateral EEG leads in SR5. Finally, in SR5, a highly localized CFC pattern between delta phase and gamma1 amplitude appeared in the two most anterior EEG leads (channels 1–2) over the PFC.
NEUROSCIENCE
investigated the possibility of specific cross-frequency relationship between these slow and fast oscillations and their topography over different cortical regions. It was suggested that CFC facilitates the coordination of activity between larger networks oscillating at lower frequencies and local neuronal ensembles oscillating at higher frequencies (15). The modulation index (MI) between the phase of slow EEG rhythms (1–20 Hz) and the amplitude of high-frequency EEG components (20–100 Hz) was calculated for each day, for all signals and the results, averaged across experiments, are presented as maps of comodulograms (Fig. 3). Fig. 3A is the array of comodulograms of BL REM sleep and Fig. 3B shows the changes in
Fig. 3. Increased CFC of slow and fast rhythms in the REM sleep of SR5. (A) Group averages of comodulogram at BL. MI quantifying modulation of high-frequency oscillations (fA, 20–100 Hz) by the phase of low-frequency oscillations (fP, 1–13 Hz). Strong phase-frequency coupling was observed between theta phase and gamma2 amplitude in broad region of centro-parietal cortex (dark red spots). Couplings between 1 Hz and beta2 (20–27 Hz), and between delta and gamma1 were found in temporal and frontal cortex, respectively. (B) Differential comodulogram (ΔMI) of SR5 with respect to baseline comodulogram. Note strong increase in theta2– gamma2 coupling over a wider area shifted to higher fA and fP frequencies [i.e., a decrease at fA ∼60-Hz, fP ∼7-Hz frequencies (blue spots) and increase at fA ∼80-Hz, fP ∼9-Hz frequencies (dark red)]. Enhanced delta range (2–4 Hz) modulation of gamma1 (∼40 Hz) was restricted to the two most anteriorly located leads over the PFC, whereas no change in was seen in low-frequency modulation of beta2 oscillations in sensory-motor cortex, relative to BL.
Kim et al.
PNAS | Published online February 13, 2017 | E1731
Hippocampal Theta and Coupled Gamma Activity in REM Sleep During CSR. Hippocampal theta–gamma nesting is the most well studied
CFC phenomenon. The location of the strong comodulation between theta2 phase and gamma2 power in centro-parietal EEG leads with local maxima at approximately anteroposterior = −2.0 and mediolateral = ±1 mm in CSR (Fig. 3) matched the extent of the underlying hippocampus indicating that at least the theta component originated from the massive hippocampal theta generator. Throughout the experiment (BL, SR, and R days), gamma amplitude was modulated by theta phase (as exemplified in Fig. 4D), but the frequency band for stronger comodulation broadened and shifted to the right with SR days as shown in an individual R 10 mouse in Fig. R 104E. The center frequency pairs calculated as 6 MIðf Þ × f df = 6 MIðf Þdf for each mouse for each day (Fig. 4F) showed a strong linear trend (R2 = 0.4). Statistical comparison (P < 0.05, paired t test, n = 9) of MI values on different SR and recovery days relative to BL verified the significant increase in CFC strength starting on SR1 and lasting until SR5 at theta2– gamma2 frequencies and a progressive decline of CFC at theta1– gamma2 frequencies starting on SR3 (Fig. 4G). We next studied the nature and the possible origin of the theta2 rhythm which appears in CSR. Fig. 2A shows the opposing behaviors of low and high-frequency theta oscillation during
CSR which could be due either to a shift of the peak frequency or a discrete switch between the 7-Hz theta in BL and a dominant 9-Hz oscillation in SR5 (Fig. 4A). Starting on SR1, the power spectra showed a permanent broadening to cover the 6–10-Hz range in all mice which persisted even after recovery sleep (Fig. 4B; tested for half-width of the spectra, P < 0.05). The peak frequency of the power spectrum in each mouse was obtained by using zerocrossing of first derivatives of the power spectrum. In most of the mice, double peaks in the power spectrum were observed and a clear separation of the two bands at ∼7 Hz and at ∼9 Hz was noticed (Fig. 4C). This frequency bifurcation suggests a transition of REM theta oscillation from unimodal to bimodal oscillations. As fast theta oscillation normally appear during short episodes of phasic REM sleep, we also tested whether the emergence of the theta2 component in CSR is due to an increase of phasic REM sleep episodes. Phasic REM sleep episodes were identified according to the criteria of Montgomery et al. (methods section of ref. 16) during ZT1–3 every day, using high-density EEG averaged over centro-parietal cortex channels. In BL, phasic REM epochs covered 1.0 ± 0.4% of total REM sleep time. This ratio significantly decreased in SR1 (0.7 ± 0.3%; P = 0.01), but returned to the baseline in the following days (1.0 ± 0.6% in SR3, 1.5 ± 0.6% in SR5, P > 0.05). The average duration of
Fig. 4. Changes of theta and coupled gamma activity in REM sleep during CSR. (A) Average power spectra (±SEM) in the theta frequency band (5–11 Hz) during REM sleep in BL, SR1, and SR5. Marker on bottom shows the frequencies of significant differences in SR1 (yellow) and SR5 (red) compared with BL (gray). Note that double peaks are prominent in SR5. (B) The full-width half-maximum (FWHM) of the power spectrum across SR and R days. The broadening of power spectrum in theta rhythm was statistically significant in all SR and R days. (C) Frequency of spectral peaks from BL and SR and R days in the individual experiments. Asymptotic lines were fit to emphasize the bifurcation of peak frequency. (D) Representative signal traces of raw and filtered EEG above hippocampus. The filtered signals show a prominent gamma2 modulation corresponding to the positive peaks of theta rhythm. The modulation of gamma1 oscillation by theta phase is less prominent. (E) The MI of theta and gamma oscillations from individual mice in BL and SR and R days (sorted by baseline value). The phase frequency nesting gamma was broaden and shifted to the higher value. (F) The scatter plot of center frequency in the comodulogram showing positive correlation between phase (fP, theta) and amplitude frequency (fA, gamma). (G) The differential comodulogram in the theta and gamma bands obtained by subtracting the BL comodulation. The region of significant change compared to BL (P < 0.05, paired t test) was marked by the boundary. Note enhanced gamma modulation by theta2 from SR1 to SR5, and decreased modulation by theta1 in SR3 and SR5.
E1732 | www.pnas.org/cgi/doi/10.1073/pnas.1615230114
Kim et al.
Low- and High-Frequency Oscillations in the Frontal Cortex in REM Sleep During CSR. Although delta activity (1–4 Hz) is the signature
EEG pattern of NREM sleep, strong activity in the delta band appears in active waking as well, associated with cognitive tasks (17), and was also observed during REM sleep in this study, mainly in the frontal cortical leads (Fig. 2A). The characteristics of this activity, however, differ from the wide-band NREM delta; they appear as real, narrow-band oscillations at different frequencies within the delta range. The sinusoidal character of these oscillations in which the phase can be unequivocally identified as monotonically rising, a necessary condition for CFC analysis (18), allowed testing their capacity to modulate the homeostatically increased high-frequency oscillations in CSR. In the PFC, EEG power increased at 2 and 4 Hz starting in SR1 and was maintained throughout SR5. As shown in Fig. 2A, after SR1, this activity became highly localized in space (channels 1 and 2) and frequency (e.g., no activity at 3 Hz; Fig. 2A). Fig. 5 A and B show an example of the raw signal recorded over the PFC and the corresponding high-resolution time-frequency plots (short-time FFT: Δf = 0.5 Hz, Δt = 100 ms), demonstrating the narrow-band, sinusoidal character of delta-band oscillations, at 2 Hz and at 4 Hz. Similar to awake animals (17), most of these oscillations were short-lived (with duration of 0.05). Oscillations at 1 Hz were strongly enhanced by CSR from SR1 throughout SR5 over the frontal cortex (Fig. 2A). CFC analysis indicated that the amplitude of ∼25-Hz beta2 activity was
Fig. 5. Alternating signals between 2 and 4 Hz in prefrontal area, modulating gamma1 during SRs. (A) Example of EEG trace during SR5 on prefrontal channel (channel #1) showing segments of 2-Hz and 4-Hz oscillations. (B) Power spectrogram (FFT, window size = 2.048 s, 50 ms moving). Two oscillations are alternating. The color was scaled to fit the power range (300– 2,100 mV2/Hz). (C) Comodulogram between delta and fast oscillation on prefrontal channel (channel 1). A weak coupling between delta (2–4 Hz) and gamma1 oscillation (30–40 Hz) in baseline sleep became strong as CSR continued; however with statistically insignificance (P = 0.29 and P = 0.28 for SR3 and SR5, respectively). (D) Comodulogram between delta and fast oscillation on motor cortex (channel 7). A broad band of fast oscillation was weakly modulated by 1-Hz oscillation in baseline sleep, and the modulated range became reduced in SR days. The color ranges from 0 to 2 × 10⁻⁴.
Kim et al.
Discussion We studied the spatial-temporal alteration of EEG oscillations in REM sleep during CSR (18 h daily sleep deprivation for 5 d). Our high-density EEG, covering the entire mouse cortex from frontal to occipital, revealed marked topographic differences between dominant slow and fast oscillations and their coupling in PFC, motor and somatosensory cortex, and the underlying hippocampus. The pattern of changes induced by CSR, however, followed a common rule across all areas. Slow oscillations (