6 31006 (2010) EPJ Web of Conferences 6, DOI:10.1051/epjconf/20100631006 © Owned by the authors, published by EDP Sciences, 2010
Digital image correlation: displacement accuracy estimation J.C. Dupré1,1, M. Bornert2, L. Robert3,4, B. Wattrisse5 On behalf of the Workgroup “Metrology” of the French CNRS research network 2519 “Mesures de Champs et Identification en Mécanique des Solides / Full-field measurements and identification in solid mechanics”. URL: http://www.ifma.fr/lami/gdr2519 1
Institut Pprime, UPR 3346 CNRS, Université de Poitiers, ENSMA, D3 PEM, SP2MI, Téléport 2, Bd M. et P. Curie, BP 30179, F86962 Futuroscope Chasseneuil CEDEX, France 2 Laboratoire Navier, École des Ponts ParisTech, Université Paris-Est, 77544 Marne-la-Vallée, France 3 Université de Toulouse; INSA, UPS, Mines Albi, ISAE; ICA (Institut Clément Ader); Campus Jarlard, F-81013 Albi, France 4 Ecole Mines Albi, Campus Jarlard, F-81013 Albi, France 5 Laboratoire de Mécanique et Génie Civil, UMR CNRS 5508, Université Montpellier 2, Place E. Bataillon, 34095 Montpellier, France Abstract. The aim of this collaborative work is to study the uncertainties associated with Digital Image Correlation techniques (DIC). More specifically, the link between displacement uncertainties and several correlation parameters chosen by the user and relative to the image analysis software and several image characteristics like speckle size and image noise is emphasized. A previous work [1] has been done for situations with spatially fluctuating displacement fields which dealt with mismatch error linked to the discrepancy between the adopted shape function and the real displacement field in the subset. This present work is focused on the ultimate error regime. To ensure that there is no mismatch error, synthetic images of plane rigid body translation have been analysed. DIC softwares developed by or used in the French community were used to study a large number of settings. The first observations are: (a) bias amplitude is almost always insensitive to the subset size, (b) DIC formulations can be split up into two families. For the first one, the bias amplitude increases with the noise while it remains constant for the second one. For both families, the mean value of the random error increases with the noise level and with the inverse of the subset size. Furthermore, the random error decreases with the radius of the speckle for the first family, while it increases for the second one. These two different behaviours of the tested DIC package are probably due to their underlying DIC formulation (interpolation, correlation criteria, optimisation process).
1
corresponding author, e-mail :
[email protected]
This is an Open Access article distributed under the terms of the Creative Commons Attribution-Noncommercial License 3.0, which permits unrestricted use, distribution, and reproduction in any noncommercial medium, provided the original work is properly cited.
Article disponible sur le site http://www.epj-conferences.org ou http://dx.doi.org/10.1051/epjconf/20100631006
14th International Conference on Experimental Mechanics
1 Introduction Displacement measurement by Digital Image Correlation (DIC) is useful for the mechanical experimental analysis of structures or materials [1,2]. Nevertheless, the uncertainty of this full-field optical technique is a function of a lot of parameters. The collaborative work carried out by the workgroup “Metrology” of CNRS research network 2519 aims at contributing to a systematic approach to this question [1,3]. In this paper, we propose to focus both (i) on the correlation parameters chosen by the user and relative to the image analysis software (correlation criteria, local subset transformation, gray level interpolation, subset size), and (ii) on several image characteristics like speckle size and image noise. The analysis is based on displacement error assessment from synthetic speckle images. Series of synthetic reference and deformed images with random patterns have been generated [4], assuming a known displacement field. Displacements are evaluated by several DIC packages developed by or used in the French community: Vic-2D (L. Robert, ICA, EMAC), JH (J. Harvent / J.-J. Orteu, ICA, EMAC), 7xD (P. Vacher, SYMME, ESIA), Aramis 2D (S. Mistou, LGP, ENIT), Correla (J.C. Dupré / P. Doumalin, PPRIME PEM, Poitiers), CorrelManuV (M. Bornert, Laboratoire Navier, Marne-la-Vallée), Kelkins (B. Wattrisse, LMGC, Montpellier), CinEMA (J.-S. Wienin, EMA), SPA (C. Poilâne, LRPMN) and Correli (F. Hild, ENS Cachan). It is pointed out that the aim of this work is not to compare the relative performances of these DIC packages, but to verify that results are linked to DIC formulation and not to specific software implementation.
2 Previous studies A first effort has been done for the quantitative evaluation of the performances of DIC measurements in situations with spatially fluctuating displacement fields [1], which needed to be investigated for a quantitative assessment of the spatial resolution of such techniques. Since it was experimentally difficult to generate non uniform deformation fields, it was necessary to perform the analysis on simulated images. In [1] the analysis has been done for plane sinusoidal displacements with varying spatial frequencies. The RMS errors of the displacements obtained with various DIC softwares were evaluated as functions of the spatial frequency and the amplitude of the displacement for various subset sizes and DIC formulations. Results have allowed us to establish the existence of various DIC error regimes. The first error regime, which is a known limiting situation for DIC, was for high frequency fields, for which no measurement could be performed when the period of the signal is smaller than the subset size. In other situations, it has been shown that the asymptotic error could be described by the following relation: RMS < sup (σm, σt). Whatever the adopted shape function, it was observed that σm was proportional to the first order term of the discrepancy between the adopted shape function and the actual displacement field in the subset and was linked to the mismatch error regime. For sufficiently small subset and small deformation the error was driven by σt which could be called the “ultimate error regime”, where the RMS error became independent on the frequency of the signal and the amplitude of the displacement gradient, and thus was no longer linked to the shape function mismatch. A precise observation of this regime has shown that it was governed by the same dependencies as in the case of pure translations (the RMS increases with the noise level and with the inverse of the subset size.), because the local transformation model of the subset matches exactly the real one. This actual work is focused on this “ultimate error regime” by analyzing both the random errors and the so-called systematic errors [5] correlated with the fractional of the displacement expressed in pixels.
31006-p.2
14th International Conference on Experimental Mechanics
3 Methodology 3.1 Synthetic images To ensure that there is no mismatch error σm whatever the adopted shape function, only synthetic images of plane rigid body translation have been generated. The imposed displacement uimposed is varying from 0 to 1 pixel with a step of 0.02 pixels. TexGen software [4] has been used to create both the reference and the translated images. One of the interests of this software is that any transformation is applied to a continuous texture function assuming perfect convection of image intensity, and the integration of each pixel is performed by a super sampling technique which mimics a real image sensor. Speckle patterns of three mean speckle radii r have been provided (r=r0/2 for the fine, r0 for the medium, and 2r0 for the coarse speckle with r0≈2 pixels), and four white noise intensity levels have been added to the images (standard deviation σb =0, 2, 4, 8, 16 grey levels). 3.2 DIC Parameters The main DIC parameters of the considered packages are sumarized in Table 1, the various settings have been chosen among the possible options of each package. Are considered: the order of the shape function φ describing the local transformation of the image (rigid to second order, φ∈{0,1,2}, knowing that it has no impact on pure translated images, see [1]), the correlation window size d chosen in this work to be 8, 16 or 32 pixels, the subpixel interpolation ι∈{l,b,q,F} (bilinear, bicubic, biquintic, Fourier), and the optimisation strategies ο∈{f,p,b} (full (f) or partial (p) optimization of shape function parameters, bi-parabolic interpolation of correlation coefficient (b)).
Table 1. Various settings for the used packages.
Package P1 P2 P3 P4 P5 P6 P7 P8 P9
Shape function (φ) 2nd order 0 order 1st order 0 order 0 order 0order 1st order 1st order 0 order
Interpolation (i) Linear (l) Quintic (q) ? Fourier (F) Cubic (c) Cubic (c) ? Cubic (c) Linear (l)
Optimisation (o) (bi-parabolic) b (full) f (full) f -----(full) f (full) f ? (partial) p (partial) p
Family 2 1 2 2 1 1 2 1 1
3.3 Statistical analysis Displacement error at the centre of a correlation window of coordinates (i,j) is obtained by: ∆u ij = u imeasured − u iimposed ,j ,j
The standard deviation σu (random error) is calculated by:
31006-p.3
(1)
14th International Conference on Experimental Mechanics 2
n∑ − ∑ ∆u ij i, j i, j (2) σu = n( n − 1) with n being the number of calculated values while the arithmetic mean (systematic error, or bias) is obtained as: ∆u ij2
∑ ∆u ij ∆u =
i, j
(3) n Displacements have been evaluated at all positions of a regular square grid in the initial image, with a pitch such that correlation windows at adjacent positions do not overlap, ensuring the statistical independence of the corresponding errors.
4 Results
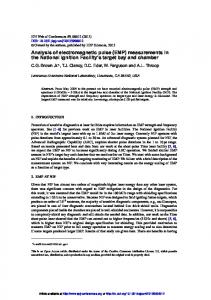
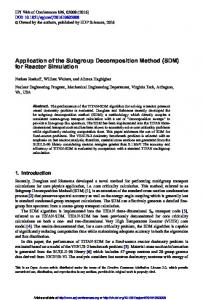
4.1 Errors versus imposed displacement In this section, medium speckle size of r=r0 is considered with a subset size of 16 pixels. In Figure 1-a are plotted the systematic errors given by the various packages as functions of the imposed displacement, for images without added noise. For most packages, we observe the well-known sinusoidal-shaped dependency with subpixel displacements (systematic errors), but three packages give non-sinusoidal curves with smaller amplitude. For all packages, the error vanishes for integer displacement, it vanishes also for half-integer displacements except for the three packages giving non-sinusoidal curves. When noise is added to the images (Figure 1-b), it is observed that the bias error increases with the noise level for a first family of DIC packages while it remains almost constant for the second one. We have chosen to classify the packages into two families depending of their behaviour with respect to noise, as it can be seen in the legend of Figure 1-b and in table 1.
a) Noiseless images
b) Noisy images
Fig. 1: Bias error for noiseless and noisy images (σb = 8 grey levels) versus imposed displacements obtained with the different packages
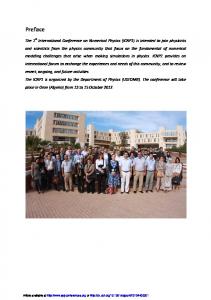
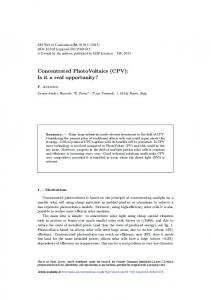
On the other hand, values of the standard deviation (random error) function of the imposed displacement given by the family 1 are smaller than the ones obtained by family 2 (see Figure 2).
31006-p.4
14th International Conference on Experimental Mechanics Nevertheless, for noisy images family 1 is sensitive to the imposed displacement with values that increase close to integer displacement values. Family 2 seems to be less sensitive to the imposed displacement.
Fig. 2: Random error for noiseless images and noisy images (b=8 grey levels) versus imposed displacements, obtained with the different packages
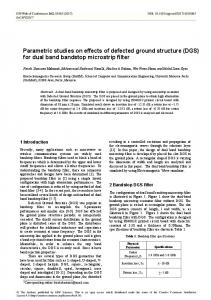
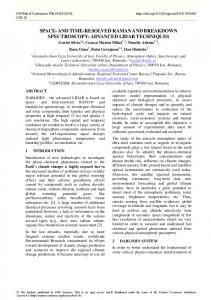
4.2 Systematic error study Figure 3 presents the amplitude of the systematic error as a function of the image noise level, for three subset sizes (d=8,16 and 32 pixels) and for the medium speckle size of r=r0. We observe clearly that family 2 is insensitive to image noise. The systematic error amplitude is also independent of the subset size for both families, excepted for family 1 at high noise values. For both families the maximum bias amplitude with no added noise is 0.025 pixel.
a) Family 1
b) Family 2
Fig. 3: Systematic error as a function of noise level and three subset sizes
Influence of the speckle size and sampling has been studied. For that, as systematic errors are independent of the subset size, we have analysed the 3 series of speckle size image (fine, medium and coarse), each series having the size of the speckle r linked to the subset size d in order to keep
31006-p.5
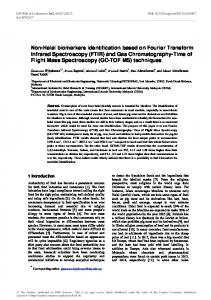
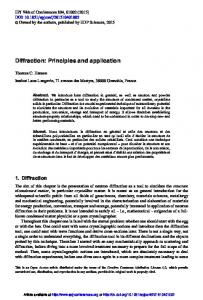
14th International Conference on Experimental Mechanics r/d constant: (for r=r0/2 d=8 pixels, for r=r0 d=16 pixels and for d=32 pixels r=2r0). First, the influence of the speckle size for various values of noise is shown in Figure 4. We observe again the two families. For small values of r, the amplitude of systematic error is often lower for packages from family 1 than for family 2. But this tendency is quickly inverted when both noise and speckle size increase. For family 1, it is worth noting that, for relatively high noise level, the systematic error normalised by the speckle size is almost independent of the speckle size (e.g. normalised bias of 0.1 for noise of 16 grey levels) but increases for decreasing speckle size for the family 2. These results can be compared to those derived from the expression of the systematic error developed by Wang et al. [6]. In their expression, the systematic error is calculated taking into account the grey level gradients of the initial and translated (or deformed) images and the noise level. Consequently, their expression is mainly linked to the grey level interpolation process used. We observe the same evolutions than the ones obtained by their expression for the package 9 corresponding to a bilinear grey level interpolation but only for small noise levels (below 4 grey levels). For a bicubic interpolation case, e.g. package 6, we observe differences with respect to the theoretical expression. It can be due to the fact that the expression of interpolation is probably not exactly the same.
Fig. 4: Systematic error normalized by the speckle size as a function of noise level for 3 speckle sizes.
4.3 Random error study Influence of the same parameters than for the systematic errors (image noise level, subset size and speckle size) have been also studied concerning the random errors. As the random error is not constant towards the imposed displacement, we have chosen to calculate the mean random error from results obtained in figure 2. Figure 5 presents the mean random error multiplied by the subset
31006-p.6
14th International Conference on Experimental Mechanics size versus noise level for the medium speckle pattern size. We show that the mean random error decreases with the subset size and increases with the noise level. For small noise values, family 1 gives better results. For this family, a master curve can almost be obtained whatever the subset size.
a) Family 1
b) Family 2
Fig. 5: Mean random error multiplied by the subset size versus noise level for various subset sizes.
Figure 6 presents the mean random error versus noise level for the three studied speckle sizes. It is reported that the mean random error is independent of the speckle size for the first family and decreases while the size increases for the second one. We have to note that for family 1 the mean random error can be given the form σu ~ k σb/d where k is a constant value which depends on the used package. Roux and Hild [7] have proposed an analytical expression of the random error showing that it scales linearly with image noise and pixel size and with the inverse of the mean square gradient and subset size. As for the systematic error, the random error is function of the interpolation process which generates particular grey levels gradients. It may explain the various slopes in Figure 6 that depends on both formulation and implementation of grey level image interpolations of each DIC packages.
a) Family 1
b) Family 2
Fig. 6: Mean random error for three speckle sizes versus noise level
31006-p.7
14th International Conference on Experimental Mechanics
5 Conclusion The purpose of this paper is to assess the ultimate error regime in DIC measurement. To ensure that there is no mismatch error, only synthetic images of plane rigid body translation have been analysed. The impact on DIC process of several image parameters and DIC parameters have been studied. The random error calculated as the mean value (over the prescribed displacement) of the standard deviation increases with the noise level and with the inverse of the subset size. As expected, the results show the same tendencies than the ones observed in the first study for the RMS of the ultimate error regime of spatially fluctuating displacement fields [1,3]. Nevertheless, it can be shown that DIC packages can be split up into two families. For the first one the mean random error is independent of the speckle size, while it increases with the speckle size for the second one. Furthermore, the systematic error as calculated by the bias amplitude has been also studied. It is almost always independent of the subset size. But according to the noise level, both families can be recovered: the systematic error increases with the noise level for the first one while it remains constant for the second one. These two behaviours can be explained by the formulations used in packages of family 2 (see Table 1): the interpolation procedures (Fourier transform rather than direct grey level interpolation, or unknown interpolation procedures), and the optimisation process (biparabolic interpolation of correlation coefficient). This seems to give to the concerned DIC packages some filtering capacity to the detriment of larger errors in the case of small subset and no image noise:for random error and for the same raisons, the packages of family 2 seem to be more efficient for high noisy images. On the other hand, for small amplitude of noise, family 1 gives better results.
References 1.
2. 3. 4. 5. 6. 7.
M. Bornert, F. Brémand, P. Doumalin, J.-C. Dupré, M. Fazzini, M. Grédiac, F. Hild, S. Mistou, J. Molimard, J.-J. Orteu, L. Robert, Y. Surrel, P. Vacher, B. Wattrisse, Exp. Mech. 49, 353-370 (2009). H.W. Schreier and M.A. Sutton, Exp. Mech. 42, 303–311, (2002) M. Bornert, Photomechanics 2006, Clermont-Ferrand, France (2006). J.-J. Orteu, D. Garcia, L. Robert and F. Bugarin, Speckle06, Slangen, P. and Cerruti, C., Eds, SPIE 6341 (2006). H.W. Schreier, J. R. Braasch and M.A. Sutton, Opt. Eng.. 39, 2915–2921, (2000) Y.Q. Wang, M.A. Sutton, H.A. Bruck. and H.W. Schreier, Strain 45, 160-178, (2009) S. Roux and F. Hild, Int. J. Fract. 140, 141–157, (2006)
31006-p.8