International Journal of Signal Processing, Image Processing and Pattern Recognition Vol.8, No.11 (2015), pp.299-308 http://dx.doi.org/10.14257/ijsip.2015.8.11.27
Dimension Reduction of Speech Emotion Feature Based on Weighted Linear Discriminant Analysis Jingjing Yuan1, Li Chen*1, Taiting Fan2 and Jian Jia3 1
School of Information Science and Technology,Northwest University, Xi’an , 710127, China 2 Xi’an productivity promotion center, Xi’an, 710048, China 3 Department of Mathematics, Northwest University, Xi’an, 710127, China
[email protected],
[email protected] Abstract
Feature dimension reduction is important for speech emotion recognition. The classical linear discriminant analysis has been used widely in this field, but the best projection separating class from others can’t be obtained with the linear discriminant analysis method due to outlier class. To approach this problem, a novel distance weighted function based on the linear discriminant analysis is introduced, which can improve the separability of sample data and has low computational complexity. In order to evaluate the proposed algorithm’s performance, some experiments are performed on two speech databases: UCI and CASIA. Experimental results on the UCI database demonstrate that the presented algorithm has a better performance. Experimental results on CASIA show that the proposed algorithm yields an average accuracy of 88.78% in the classification of four emotions, revealing that it is a better choice as feature dimension reduction for emotion classification than the traditional algorithms. Keywords: feature dimension reduction; linear discriminant analysis; weighted function; speech emotion
1. Introduction The result of speech emotion recognition is significantly affected by the merits of the speech emotion feature. One of the key points of speech emotion recognition is how to effectively extract the speech features characterizing the emotion state. In general, the emotion features can be divided into three types: prosody features, spectral-related features and sound quality parameters [1]. These features can be expressed using static statistical characteristics such as the mean, variance, maximum, range, etc. Speech emotion feature set can provide useful information for emotion discrimination. But some features contain little useful information, others are even redundant. Therefore, dimension reduction of the speech emotion feature is essential. The calculation amount of followingup work and the cost of memory are reduced by dimension reduction. In addition, the accuracy of emotion recognition can be further improved by eliminating the redundant features and the features contain little useful information. Considering the small amount of calculation, simpleness and efficiency, linear dimension reduction method is widely used. In the field of speech emotion recognition, the most popular linear dimension reduction techniques are Principal Component Analysis (PCA) [2-3] and Linear Discriminant Analysis (LDA) [4-5], etc [6]. *
Li Chen (
[email protected])
ISSN: 2005-4254 IJSIP Copyright ⓒ 2015 SERSC
International Journal of Signal Processing, Image Processing and Pattern Recognition Vol.8, No.11 (2015)
Using PCA dimension reduction, a set of comprehensive variables retaining most information of the original samples can be obtained. But the new data with low dimension may be suboptimal for classification. Besides, the target dimension is not fixed and is not easy to be determined by the algorithm [7]. LDA can effectively extract the features containing rich discriminant information [8]. Therefore, it is widely used in the field of speech emotion recognition [9-10]. LDA has been first proposed by Fisher in 1936 [11], it was only suitable for two-class problems at that time. Subsequently, it has been generalized to multi-class problems by Rao [12]. However, outlier class (samples of this class are far away from the other class in the distance space) is dominant in optimizing the Fisher criterion process of traditional LDA algorithm. As a consequence, the already wellseparated outlier class in original space can get a better classification effect in the new projection space. The neighboring classes in original space overlap in the new projection space, making it more difficult to be discriminated. To tackle this, Loog et. al., [13] have redefined between-class scatter matrix by introducing the weighted distance function, presented the weighted pairwise Fisher criterion for multiclass linear dimension reduction. Neverthless, the method has the disadvantage of high computation complexity Zhao li et. al., [6] have combined the two methods together, using PCA and LDA for dimension reduction successively in order to achieve a better performance. However, the amount of calculation is large and the time complexity is increased. The classical LDA overemphasis the status of the outlier class so that the projection obtained is not optimal. In this paper, a new weighted LDA method based on the classical LDA is proposed. The method can weaken the influence of the outlier class, thus a superior projection can be obtained. Compared with the method of literature [6] and literature [13], the introduced method in this paper has small computation complexity and lower time complexity. Besides, the proposed method can achieve a better performance compared with PCA and classical LDA. The rest of the paper is organized as follows: In Section 2, the classical linear discriminant analysis algorithm is briefly introduced. The weighted linear discriminant analysis method is described in Section 3. The experiment results are presented in Section 4, and finally in Section 5, a perspective analysis and conclusion are drawn.
2. Linear Discriminant Analysis LDA is a supervised dimension reduction method, it attempts to find a linear projection which can fully separate class from other classes. Given a D-dimension sample X consisting of C classes, the number of each class sample is
N i ( i 1, 2 , … , C)
and we get the equation:
The between-class scatter matrix follows:
SB
N1 N 2
NC n
and within-class scatter matrix
SW
.
are defined as
C
SB
p i ( m i m )( m i m )
T
i 1
(1)
C
SW
i 1
pi
( x m i )( x m i )
x c la s s i
T
(2)
p m Here, i is the prior probability of class i , i is the mean of i class samples, m is the mean of all sample data.
mi
300
1 Ni
x
(3)
x c la s s i
Copyright ⓒ 2015 SERSC
International Journal of Signal Processing, Image Processing and Pattern Recognition Vol.8, No.11 (2015)
m
1 n
C
x
(4)
i 1 x c la s s i
Fisher criterion is defined as: J
S B
T
SW
T
(5)
LDA searches for the projection maximizing the Fisher criterion, that is, maximizing the between-class scatter while minimizing the within-class scatter. It has been proved S
1
S
B that eigen decompose the matrix W and then take the d ( d C 1 ) largest eigenvectors corresponding to the d eigenvalues to constitute vector sets , the optimal projection can be obtained [11]. Thus, the original D-dimension space can be mapped into a new d -dimension subspace by a linear transformation Y X . The new d dimension space reserves the majority classify information of the original data. So a higher classification accuracy is achieved in the new low-dimension space.
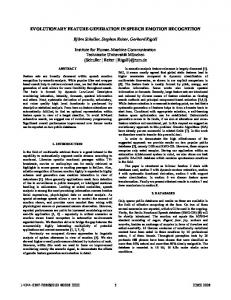
3. Proposed Method The classical LDA fails to consider the distance relationship between classes, simply assigning the same weight to all classes. So the projection space from LDA may be suboptimal for classification. As is shown in Figure 1, class 1 is close to class 2 in the distance space, class 3 is located remotely from other classes , known as outlier class [13]. The outlier class dominates in optimizing the Fisher criterion process, clearly separated from other class as far as possible. And in consequence, the already well-separated outlier class in original space can get a better classification effect in the new projection space. The neighboring classes in original space overlap in the new projection space and are not easier to be discriminated. However, classification accuracy is greatly affected by the separability of neighboring classes. So, the projection obtained with LDA may be suboptimal.
Figure 1. Two Different Projections The weighted function has been proposed to act as the penalty for the variance in the case of non-uniform distribution of data. Namely, to achieve a better effect for a dataset, the elements which have a large contribution to the result are given a high weight to
Copyright ⓒ 2015 SERSC
301
International Journal of Signal Processing, Image Processing and Pattern Recognition Vol.8, No.11 (2015)
emphasize the impact, the ones that have little contribution to the result are imparted low weight. For the above-mentioned problems of classical LDA, literature [13] has introduced the concept of weighted function and redefined the between-class scatter. The method tried to undermine the dominant role of the outlier class in the process of calculating projection and increase the contribution of neighboring classes. The effectiveness and efficiency were verified through theoretical analysis and experiment in the literature. In this paper, the outlier class is given low weight and the neighboring classes are assigned to high weights in the weighted between-class scatter formula. Thus, the weight is just inversely proportional to the distance. A higher classification accuracy is expected to obtain. Euclidean distance and Manhattan distance are generally used for the distance calculation. Manhattan distance measures the distance between two points along axes at right angles, so it is not suitable for use in this case. Euclidean distance calculates the linear distance between two points, which characterizes the degree of sample similarity between classes in some extent. So the Euclidean distance is adopted in this paper. The between-class scatter matrix is defined as follows: C
SB
p i ( m i m )( m i m )
i 1
T
di
(6)
di
m
Here, is the Euclidean distance between (the mean of all samples), also called 2-norm.
d i || m i m || 2
mi
(the mean of
i
class samples) and
(7) S
1
S
B Eigenvalue decompose the matrix W . Then fetch the d ( d C 1 ) largest eigenvectors corresponding to the d eigenvalues to constitute vector sets , the optimal projection is got. Classical LDA overemphasizes the influence of the outlier class, making the obtained projection suboptimal. In this paper, the outlier class is divided by a long distance to weaken the dominant role, neighboring classes are divided by a small distance to enhance their status, with the aim to get a projection which has a better classification effect. Obviously, this method tries to overcome the defect of the classical LDA, it is effective and can get better classification results than the classical LDA. Weighted Euclidean distance calculation method put forward in this paper can effectively reflect the similarity of sample points. Compared with the classical LDA, the time complexity of this method is slightly increased, but in exchange for a better classification projection direction. Eventually, we can achieve higher classification accuracy.
4. Experimental Results and Analysis In order to evaluate the validity and universality of the proposed method, the experiment is conducted on two datasets: UCI dataset [14] and CASIA Chinese emotional speech database [15]. The experiment is run on Matlab R2010a, the hardware platform is a desktop with 2G memory, the operating system is Windows XP Professional Edition.
302
Copyright ⓒ 2015 SERSC
International Journal of Signal Processing, Image Processing and Pattern Recognition Vol.8, No.11 (2015)
4.1. Experiment on UCI Dataset Six kinds of datasets are selected from the classical UCI standard datasets to verify the effectiveness and universality of the proposed method. The number of attributes of the six datasets differs and the relevant information is listed in Table 1. Table 1. Basic Information of the Datasets Name of datasets
Number of samples
Number of attributes
Number of classes
Iris
150
4
3
Wine
178
13
3
Red Wine Quality
1600
12
10
White Wine Quality
4898
12
10
Sonar
208
60
2
Dermatology
366
33
6
Reduce the dimension of the data with the weighted LDA, PCA and LDA for comparison. The low-dimensional data are as input for the classifier, then the classification accuracy acts as the evaluation criterion to access the effect of dimension reduction. As the stable performance, strong anti-interference and easy promotion, support vector machine(SVM) is applied to compare the effects of the three dimension reduction methods. To obtain stable results, 10-fold cross-validation is used. The experiment results are shown in Table 2. Table 2. Accuracy of Three Methods datasets\method
PCA
LDA
weightedLDA
iris
85.3%
90.5%
91.2%
wine
93.5%
97.1%
98.5%
Red Wine Quality
54.9%
58.3%
58.9%
White Wine Quality
45.5%
48.8%
49.8%
sonar
71.7%
86.8%
87.9%
Dermatology
78.6%
83.3%
84.1%
On the six UCI datasets, classical LDA brings about a higher accuracy rate than PCA, the highest accuracy rate increases by 15%. Weighed LDA is even better than the classical LDA, the accuracy rate increases about 1% (Table 2). Experimental results show that compared with PCA and classical LDA, the method in this paper is better, demonstrating the effectiveness of the method. 4.2. Experiment on CASIA Chinese Emotional Speech Database The experiment is carried out with the CASIA Chinese emotional speech database. Four professional speakers (two men and two women) read the 50 well-selected corpus in six emotions (angry, happy, neutral, sad, fear, surprise), 1200 emotional speeches are got. The pure recording environment is made available to the signal to noise ratio of about 35db. Sampling rate is 16000HZ and the sampled speech data is stored in 16bit pcm format. Four kinds of emotional (angry, happy, neutral, sad) speeches, including 800 speeches in total are chosen as experimental data.
Copyright ⓒ 2015 SERSC
303
International Journal of Signal Processing, Image Processing and Pattern Recognition Vol.8, No.11 (2015)
First, we extract the features of the emotional speech. The extracted emotional features are: pitch frequency, short-term energy, speech speed, first, second, third and fourth formants, 0-12 order, first and second order differential of Mel Frequency Cepstral Coefficients. These feature values are presented in the global statistical form, including maximum, minimum, mean, variance and range, constituting the 225-dimension emotional features. Then, the weighted LDA is used to reduce the dimension. At present, the most widely used dimension reduction techniques in the field of speech emotion recognition are PCA and LDA. So, PCA and LDA are used as comparison in this paper. The low-dimensional features are taken as input to the classifier, and the classification accuracy is the evaluation criterion to access the effect of dimension reduction. Considering support vector machine is commonly used in the field of speech emotion recognition [16-18]. Therefore, we adopt SVM classifier as emotional speech recognition algorithm. Repeated experiments indicate that the recognition effect is best taking the linear kernel, besides, the calculation amount of linear kernel is small. 5-fold cross-validation is performed. After dimension reduction with PCA, the emotion recognition accuracy is given in Table 3. Table 3. Recognition Rate for Features Dimension Reduced by PCA Recognition result Test sample angry
happy
neutral
sad
accuracy
angry
40
0
0
0
100%
happy
3
27
6
2
71.5%
neutral
1
5
29
3
76.3%
sad
1
5
4
28
73.7%
Average accuracy
80.40%
The average emotion recognition rate reaches 80.4% after dimension reduction with PCA. Angry emotion recognition accuracy is 100%.There are several misjudged samples in the happy emotional data. Some samples are mistaken for happy emotion in neutral and sad emotional data. After dimension reduction with LDA, the emotion recognition accuracy is shown in Table 4. Table 4. Recognition Rate for Features Dimension Reduced by LDA Test sample
Recognition result angry
happy
neutral
sad
angry
41
0
0
0
100%
happy
0
34
4
0
89.5%
neutral
0
1
21
15
55.3%
sad
0
0
11
28
73.7%
Average accuracy
304
accuracy
79.63%
Copyright ⓒ 2015 SERSC
International Journal of Signal Processing, Image Processing and Pattern Recognition Vol.8, No.11 (2015)
As can be seen from Table 4, after dimension reduction with LDA, angry emotion recognition is entirely accurate, there are a few happy emotion class samples are misclassified as neutral emotion, neutral emotion and sad emotion are difficult to separated from each other and misjudging one for another is frequently occurring. After dimension reduction with weighted LDA, the emotion recognition accuracy is listed in Table 5. Table 5. Recognition Rate for Features Dimension Reduced by Weighted LDA Test sample
Recognition result angry
happy
neutral
sad
accuracy
angry
38
0
0
0
100%
happy
1
34
5
0
89.5%
neutral
0
6
30
1
81.8%
sad
0
0
6
31
83.8%
Average accuracy
88.78%
After dimension reduction with weighted LDA, emotion recognition accuracy rate achieves 88.78%. Angry emotion recognition is entirely accurate. There are a few happy emotion class samples are misclassified as neutral emotion. The situation that neutral emotion and sad emotion are difficult to separated from each other in LDA method obviously improves. Only a very small amount of samples are misjudged. After using three different dimension reduction methods, the ultimate emotion recognition accuracy rate and the number of dimension after reduction are showed in Table 6. Table 6. Accuracy Rate for Features Dimension Reduced by Three Dimension Reduction Methods method
accuracy
dimension after reduction
PCA
80.40%
161
LDA
79.63%
3
Weighted LDA
88.78%
3
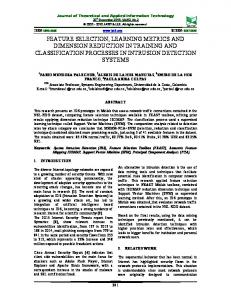
After the features dimension reduced with PCA, the recognition accuracy rate is higher than that with LDA, but the dimension after reduction is much higher. Obviously, the weighted LDA is better than the two mentioned methods and the dimension after reduction is low. The data processed with LDA dimension reduction and weighted LDA dimension reduction are visualized and presented in the form of scatter plot, shown in Figure 2.
Copyright ⓒ 2015 SERSC
305
International Journal of Signal Processing, Image Processing and Pattern Recognition Vol.8, No.11 (2015)
(a) Dimension reduced by LDA, (b) Dimension reduced by weighted LDA
Figure 2. Scatter Plot of Dimension Reduced Samples In the new projection subspace attained by dimension reduction with LDA, happy emotion samples are far away from angry emotion samples, namely, there is a sharp boundary between the two classes and a few samples are mistaken. Some overlap occur between happy emotion samples and neutral emotion samples, that is, the samples near the class boundary are easily misjudged. Some obvious overlap appear between neutral samples and sad samples, leading to a bad recognition effect. By contrast, in the new projection subspace gained by dimension reduction with weighted LDA, the state of happy emotion samples and angry emotion samples is similar with that in LDA. Some overlap exist between happy emotion samples and neutral emotion samples. While neutral emotion samples and sad emotion samples are much easier to separate from each other. Thus, the recognition rate is clearly improved by dimension reduction with weighted LDA.
5. Conclusion In this paper, a new distance weighted function with simple calculation is proposed based on classical LDA. Effectiveness of the weighted LDA method is validated by the experiment conducting on the UCI datasets. Applying the weighted LDA to reduce the dimension of speech emotion feature, the higher classification accuracy demonstrates that the performance of the proposed method exceeds that of PCA and classical LDA. Finally, further comparison demonstrates that the weighted LDA can effectively enhance the separability of the overlapping samples. But we just have to point out that we do not consider the recognition error rate in defining the weighted function. In the future, we will consider defining weight function by introducing the recognition error rate, so a higher recognition accuracy rate may be achieved.
Acknowledgments The work was supported by the National Key Technology Science and Technique Support Program (No. 2013BAH49F02, No. 2013BAH49F02), the National Nature Science Foundation of China (No.61379010), the Natural Science Basic Research Plan in Shaanxi Province of China (No. 2012JQ1012).
References [1]
306
HAN W J, LI H F and RUAN H B, “Review on Speech Emotion Recognition”, Journal of Software vol. 25, no. 1, (2014), pp. 37-50.
Copyright ⓒ 2015 SERSC
International Journal of Signal Processing, Image Processing and Pattern Recognition Vol.8, No.11 (2015)
[2] [3]
[4] [5] [6] [7] [8] [9] [10]
[11] [12] [13]
[14]
[15] [16] [17] [18]
Chuang Z J and Wu C H, “Emotion recognition using acoustic features and textual content”, Multimedia and Expo, 2004. ICME'04. 2004 IEEE International Conference on. IEEE, vol. 1, (2004), pp. 53-56. Ververidis D, Kotropoulos C and Pitas I, “Automatic emotional speech classification”, Acoustics, Speech, and Signal Processing, 2004. Proceedings. (ICASSP'04). IEEE International Conference on. IEEE, vol. 1, (2004), pp. I-593-6. You M, Chen C and Bu J, “Emotion recognition from noisy speech”, Multimedia and Expo, 2006 IEEE International Conference on. IEEE, (2006), pp. 1653-1656. You M, Chen C and Bu J, “A hierarchical framework for speech emotion recognition”, Industrial Electronics, 2006 IEEE International Symposium on. IEEE, vol. 1, (2006), pp. 515-519. Z. li and H. Chengwei, “Key Technologies in Practical Speech Emotion Recognition”, Journal of Data Acquisition and Processing, vol. 29, no. 2, (2014), pp. 157-170. Chuang Z J and Wu C H, “Emotion recognition using acoustic features and textual content”, Multimedia and Expo, 2004. ICME'04. 2004 IEEE International Conference on. IEEE, vol. 1, (2004), pp. 53-56. Fukunaga K, “Introduction to statistical pattern recognition”, Academic press, (1990). El Ayadi M, Kamel M S and Karray F, “Survey on speech emotion recognition: Features, classification schemes, and databases”, Pattern Recognition, vol. 44, no. 3, (2011), pp. 572-587. Schuller B, Batliner A and Steidl S, “Recognising realistic emotions and affect in speech: State of the art and lessons learnt from the first challenge”, Speech Communication, vol. 53, no. 9, (2011), pp. 10621087. Fisher R A, “The use of multiple measurements in taxonomic problems”, Annals of eugenics, vol. 7, no. 2, (1936), pp. 179-188. Rao C R, “The utilization of multiple measurements in problems of biological classification”, Journal of the Royal Statistical Society. Series B (Methodological), vol. 10, no. 2, (1948), pp. 159-203. Loog M, Duin R P W and Haeb-Umbach R, “Multiclass linear dimension reduction by weighted pairwise Fisher criteria”, IEEE Transactions on Pattern Analysis and Machine Intelligence, vol. 23, no. 7, (2001), pp. 762-766. C.L. Blake and C.J. Merz, UCI Repository of Machine Learning Databases, University of California, Irvine, Department of Information and Computer Sciences, 1996, http://www.ics.uci.edu/∼mlearn/MLRepository.html. http://www.chineseldc.org/resource_info.php?rid=76, CASIA Chinese emotional speech database, Accessed, (2015) January 20. Hassan A, “Damper RI. Multi-Class and hierarchical svms for emotion recognition”, In: Proc. of the 2010 INTERSPEECH. Chiba: ISCA, (2010), pp. 2354-2357. X. Lei, “Research of Feature Extraction and Recognition for Speech Emotion”, Thesis, Zhejiang SciTech University, (2013). Dai rui, “Speech Emotional Recognition Research Based on Features Extraction and Multi-modal Combination”, Thesis, Lanzhou University of Technology, (2014).
Copyright ⓒ 2015 SERSC
307
International Journal of Signal Processing, Image Processing and Pattern Recognition Vol.8, No.11 (2015)
308
Copyright ⓒ 2015 SERSC