ERGONOMICS, 10 OCTOBER, 2004,
VOL.
47,
NO.
12, 1301 – 1317
Dimensional differences for evaluating the quality of footwear fit CHANNA P. WITANA, JIEJIAN FENG and RAVINDRA S. GOONETILLEKE* Human Performance Laboratory, Department of Industrial Engineering and Engineering Management, Hong Kong University of Science and Technology, Clear Water Bay, Hong Kong Keywords: Footwear; Fit; Fore-foot fit; Mid-foot fit; Comfort. Very few standards exist for fitting products to people. Footwear is a noteworthy example. This study is an attempt to evaluate the quality of footwear fit using two-dimensional foot outlines. Twenty Hong Kong Chinese students participated in an experiment that involved three pairs of dress shoes and one pair of athletic shoes. The participants’ feet were scanned using a commercial laser scanner, and each participant wore and rated the fit of each region of each shoe. The shoe lasts were also scanned and were used to match the foot scans with the last scans. The ANOVA showed significant (p 5 0.05) differences among the four pairs of shoes for the overall, fore-foot and rear-foot fit ratings. There were no significant differences among shoes for mid-foot fit rating. These perceived differences were further analysed after matching the 2D outlines of both last and feet. The pointwise dimensional difference between foot and shoe outlines were computed and analysed after normalizing with foot perimeter. The dimensional difference (DD) plots along the foot perimeter showed that fore-foot fit was strongly correlated (R2 4 0.8) with two of the minimums in the DD-plot while mid-foot fit was strongly correlated (R2 4 0.9) with the dimensional difference around the arch region and a point on the lateral side of the foot. The DD-plots allow the designer to determine the critical locations that may affect footwear fit in addition to quantifying the nature of misfit so that design changes to shape and material may be possible.
1. Introduction Product performance can be broadly evaluated based on its function (that is, the product works as designed), form (appeal to the eye), and fit (match to the purpose). Form follows function for barefoot (Rossi 2001) but, for many consumer products, fit can govern function and is hence an important property. In traditional mechanical engineering applications, there are different types of fit depending on function. For example, coupling a hub to a shaft requires an interference fit (Norton 2000). In this case, the difference between the shaft diameter and the internal diameter of the hub has to be within a given tolerance in order to produce the required interference fit (AGMA 9003-A91; ISO 286-2:1988). In applications involving people, on the other hand, fit is generally not as well defined, even though there are numerous studies reporting anthropometric measurements (Freedman et al. 1946, Baba 1975, Rossi 1983, Rys and Konz 1989, Falcao and D’Angelo 1992, Pheasant 1994). A good example is footwear fit. Clinical reports of foot problems such as blistering, chafing, black toes, bunions, *Author for correspondence. e-mail:
[email protected] Ergonomics ISSN 0014-0139 print/ISSN 1366-5847 online # 2004 Taylor & Francis Ltd http://www.tandf.co.uk/journals DOI: 10.1080/00140130410001712645
1302
C. P. Witana et al.
pain, and tired feet are known to be a result of poor fitting shoes (Rossi 1988). This study is a means to understand the perceived feeling of fit and its relationship to an objective measure so that footwear can be designed in modular fashion to achieve a required level of fit especially in the fore-foot and mid-foot regions. The shoe last, a reproduction of the approximate shape of the human foot, is the single most important element of the shoe and is considered to be the heart of the shoe (Cavanagh 1980). It is the most complex part of the whole shoemaking process, and it is responsible for the fit, shape and style (Clarks 1989). Many researchers have reported the link between shoe fit and foot problems (Holscher and Hu 1976, Cavanagh 1980, Cheskin 1987, Hamill et al. 1989, Messier et al. 1991, Marr and Quine 1993). The problems related to shoe fit become further exacerbated when footwear manufacturers change important shape characteristics of shoe models resulting in the consumer being dissatisfied with the dimensional fit of the newer models. The Foot and Ankle sourcebook (Tremaine and Awad 1998) states that proper shoe fit requires ‘shape or last design with proper toe depth and shape, proper instep (vamp) depth, proper heel width, and proper curve (flare) of the shoe’. Unfortunately, the term, ‘proper’ has not been defined. The lack of information in relation to the proper match has hindered the progress of design and the selection of footwear (Rossi 2001). In recent years, with improvements in scanning technology, 3D visualization methods, and mathematical modelling techniques, computer scientists have been developing algorithms for matching 3D objects (Hilaga et al. 2001, Novotni and Klein 2001, Osada et al. 2001, Kos and Duhovnik 2002). The primary goal of such studies is to automatically search for matching objects (e.g., footwear) in 3D archives using reconstruction and similarity estimation techniques. These studies however have little or no understanding of a person’s feel of fit, even though allowances can be incorporated into the algorithms when searching for matching objects. As Novotni and Klein (2001) stated, ‘. . . a statistic should be built up (as to) how certain parts of the foot and shoe contribute to the overall comfort feeling’. This study aimed to at least partially address this issue. A shoe that is ‘loose’ on the foot is generally not as uncomfortable (even though function may be impaired) as when it is tight (Luximon et al. 2001). In either case, the acceptable looseness or tightness is subjective and rarely quantified. Worst of all, the wearer cannot predict the ‘fit-drift’ and the bearability or even acceptability of the shoe-foot fit in the long term. The ANSI/ ASTM F539-78 (1986) standard concentrates predominantly on two areas when fitting footwear: the toes and the metatarsal region (ball joint). The Brannock device, a common foot-measuring jig, has also concentrated on these two areas by measuring the length along the foot and the maximum width at around the metatarsophalangeal joint (MPJ) area. Are these measures sufficient for foot–shoe fit? A 1986 – 1987 study (Collazzo 1988) on the incidence of fitting problems in footwear found that, for both men and women, tight fit was a problem in 22% of the items reported, width in 20%, narrow toes in 19%, arches in 14%, and sloppy fit in 9%. Length was not a problem except for those people with very short or very long feet. Even though a more recent survey has not been performed, the numbers and the categories of problems seem to be quite universal. Ergonomists have been striving hard to achieve the right fit between people and the tools or equipment they use, but this so-called ‘right fit’ or compatibility is generally unknown in many circumstances (Karwowski and Jamaldin 1996). As Kolarik (1995) stated, customers demand shoes that fit after trying them on. The foot–shoe fit depends on many factors. Some of these are time of day, activity performed, a
2D Foot outlines
1303
person’s health status, and so forth. As a result, footwear purchased at some time on one day may not fit as well on a different day or throughout the complete day. The size variations of feet are always an excuse to avoid quantifying the fit between shoes and feet. Thus, subjective ratings of fit are often downplayed. Once a shoe is designed and developed, it is common practice to perform fit trials using lead users with standard sized feet (e.g., size 9 for US men or size 7 for US women). Depending on the overall response of these lead users, the shoe last may be modified to generate a differing feeling of fit. The modification process is quite often trial and error, and is greatly dependent on the designer and the lastmaker (Cavanagh 1980). The fit issues can be alarming when selecting children’s shoes. Generally, an adult determines the free toe space (‘grow room’) in a child’s shoe by pressing and locating the big toe (Rossi 2002). It is not possible to test the fit of the other areas of a child’s shoe and hence one may question whether length is the only critical measure for footwear fit. Most fit problems are generally around the ‘width’ dimension and it is not surprising, as most shoe sizing systems are predominantly based on only the length dimension. Determining appropriate fit metrics for the width dimension will help ease some of the footwear fit problems. The primary areas of a shoe are hind-foot (or rear-foot), mid-foot, and fore-foot (Cavanagh, 1980). The hind-foot comprises the calcaneus and the talus. The midfoot has five short bones and the main arch, while the forefoot is made of the toes (phalanges) and the ball of the foot (metatarsals). Even though different width shoes are available, the variation of heel width within a given size of shoe is very small as the variation of heel width among people is relatively small. Thus, finding a shoe that fits in the heel area may not be that difficult. However, the variation of fore-foot width among people can be relatively large and thus the right fit in the fore-foot region is not that easy to achieve (Tremaine and Awad 1998). The growing B2C (Business to Customer) industry has been using foot outlines in order to determine the real foot ‘size’. How do the outlines help select the right shoe? This study aimed to determine the importance of the foot outline in determining the quality of fit in the fore-foot and mid-foot regions. 2. Methodology 2.1. Participants Twenty Hong Kong Chinese males who were students at the Hong Kong University of Science and Technology, whose foot length was in the range 235 and 270 mm, participated in the experiment. None of the participants had any foot illnesses or abnormalities. Each of the participants was paid HK$150 (*US$20) for their time. 2.2. Shoes Three dress shoes (UK size 7, 7.5 and 8) and one Yonex athletic shoe (UK size 7.5) were tested (figure 1a). The manufacturers of the shoes supplied the shoe lasts. The length and width of each last are given in table 1. An example last is shown in figure 1(b) and the last–shoe combination is shown in figure 1(c). 2.3. Equipment The YETI foot scanner (Vorum Research Corporation 2000) was used to obtain the 3D shape of feet (when standing with equal load on both feet) and the eight (i.e., left and right of all four pairs) shoe lasts. The 3D scans were post-processed to obtain the 2D outlines as described later.
1304
Figure 1.
C. P. Witana et al.
(a) Athletic shoe and the three dress shoes used in experiment. (b) Dress shoe last. (c) Dress shoe last inside corresponding shoe.
2.4. Procedure Every participant completed a voluntary consent form. The participant first wore the experimental sports shoes (Yonex) and walked around for a few minutes until they
1305
2D Foot outlines Table 1.
Shoe type
Shoe size
Dress shoe
7 UK 7.5 UK 8 UK 26 cm 40.5 EURO 7.5 UK 8 US (as written on shoe)
Athletic shoe
Shoe last dimensions (right side last) Arch length (Brannock units)
Length (Brannock units)
Stick length (mm)
8 9 9.5 10
10 10.5 11 10
265 270 275 265
Width mm (Brannock units) 92 93 94 98
(B) (B) (AB) (C)
were able to get a good feel for the fit. Thereafter, two types of rating scales were used to evaluate the perceived fit. (1)
(2)
‘macroscopic’ or region-wise ratings on a 7-point scale. These included overall fit (q1) ( 7 3 = very bad, 0 = neutral and + 3 = very good), heel height (q2) ( 7 3 = too little, 0 = neutral and + 3 = too much), free space in front of toes (q3) ( 7 3 = too little, 0 = neutral and + 3 = too much), forefoot fit (q4) ( 7 3 = too tight, 0 = neutral and + 3 = too loose), mid-foot fit (q5) ( 7 3 = too tight, 0 = neutral and + 3 = too loose) and rear-foot fit (q6) ( 7 3 = too tight, 0 = neutral and + 3 = too loose) when standing and walking. The results in this paper focus on these macroscopic ratings. ‘microscopic’ or area-wise ratings. These included a further split of the forefoot-region into six areas, mid-foot region into six areas and the rear-foot region into five areas.
The aforementioned procedure was repeated with the other three pairs of dress shoes. The presentation order for the dress shoes was random. If a participant was unable to wear any of the dress shoes, that pair was not rated. In order to determine the positioning of the foot inside the shoe, in addition to the subjective ratings, the distance between shoe and the foot was measured at the top of the shoe opening in the Achilles tendon area when the participant was standing. 2.5. Data processing and matching 2.5.1. Extracting 2D outlines: For ease of use, a coordinate system was chosen such that the x-axis was in the width direction, the y-axis was in the lengthwise direction and the z-axis was in the height direction. The three-dimensional scans of feet and lasts were first converted to 2D outlines as follows: . .
All points in 3D space between the base of the foot (plantar surface) and up to 30 mm from the base were projected to the base plane. Points with the maximum and minimum coordinates along the x-axis for each value of y were selected and assigned to Set 1. This set allows the outline on the medial and lateral sides to be captured.
1306 . .
C. P. Witana et al. Similarly, the points with maximum and minimum coordinates along the yaxis for each value of x were assigned to Set 2. This set allows the outline in the toe area and the heel area to be captured. The foot outline was then given by Set P = {Set 1 [ Set 2}
2.5.2. Foot and last outline alignment: After the 2D outlines of all feet and lasts were obtained as described above, the foot outlines were aligned with each of the respective last outlines using the heel centreline and the measured end-distance between shoe and foot. The measured distance was used to position the foot and last outlines relative to each other using AUTOCAD software. This process allows alignment only in the lengthwise direction. However the foot may still not be in the same position as when wearing a shoe. Thus, another alignment was necessary to account for the widthwise alignment. Figure 2 shows a foot and last alignment along the heel centreline. However, as can be seen from the figure, the fifth toe is barely touching the lateral side of the shoe while the big toe shows a significant outward projection on the medial side. A reasonable alignment would have a somewhat equal projection on the medial as well as lateral sides giving rise to tightness on both sides. This was achieved through a manual rotation of one of the outlines so that the projections on both sides were the same, in an attempt to satisfy the subjective ratings related to each shoe. This manual positioning may not be the exact position of the foot inside the shoe, but was reasonable as may be seen from the way the analyses were performed.
Figure 2.
A foot aligned with shoe last of size 8, along heel centreline and with heel enddistance.
1307
2D Foot outlines
2.5.3. Dimensional difference (DD) determination: After the aforementioned alignment of the foot and the last was performed, the dimensional differences from each point on the foot to the last outline were computed using the shortest Euclidean distance, a special case of the Minkowski distance metric (Osada et al. 2001). Luximon et al. (2003) used the concept of negative and positive error to distinguish looseness and tightness. The same notation was used. Thus, tightness was a negativedifference (that is, foot outline is outside the last outline) and looseness was a positive-difference (that is, foot outline is inside the last outline). Luximon et al. (2003) also reported that the non-toe area accounted for about 83% of the points on average with a very small variation among subjects that they tested when the foot was separated into a toe area and a non-toe area. In other words, the perimeter of the foot has fair consistency among people. Since the foot length and foot width of each subject were different (table 2), the perimeter of each foot was normalized to 100 (figure 2), and the dimensional differences were plotted for each shoe as shown in Table 2. Variable Age (years) Weight (kg) Height (cm) Left foot length (cm) Right foot length (cm) Left foot width (cm) Right foot width (cm)
Descriptive statistics of participants (n = 20) Mean
Median
Std. Dev.
Minimum
Maximum
21.4 63.265 170.1 25.09 25.165 10.145 10.135
21 62.1 170.5 25 25 10.1 10.1
1.984148 6.891167 3.51553 0.852797 0.798205 0.557697 0.488041
19 52.05 163.3 23.8 24.1 9 9.2
26 84 176.3 26.8 26.7 11.5 11.1
Figure 3. Dimensional difference between a participant’s foot and the size 8 last along the normalized perimeter of the foot. Points 1, 2, 3 and 4 correspond to the local minima.
1308
C. P. Witana et al.
figure 3. The foot perimeter was calculated using the sum of the Euclidean distances between consecutive points from a sorted 2D point set of the outline. The simple statistics (minimum, maximum, mean and median) of the dimensional differences were determined by using points that were uniformly distributed along the outline. Only one point was chosen within each of the 5 6 5 mm squares of the outline. This procedure was used to eliminate any biases towards the mean and median if the distribution of points along the outline were not uniform. 3. Results The descriptive statistics of the participants are given in table 2. The simple statistics and the intercorrelations of the questionnaire ratings are given in tables 3 and 4. An analysis of variance (ANOVA) was performed on overall fit rating, fore-foot fit rating, mid-foot fit rating and rear-foot fit rating. There were no significant differences (p 4 0.5) among shoes for the dependent variable mid-foot fit rating. However, overall fit rating (F(3,132) = 12.54, p = 0.0001), fore-foot rating (F(3,132) = 4.23, p = 0.0068) and rear-foot fit rating (F(3,132) = 4.46, p = 0.0051) showed significant differences among the four pairs of shoes. The post-hoc Student– Newman–Keuls (SNK) test results are shown in table 5. The minimum, maximum, mean and median of the overall dimensional differences were sorted by the overall fit rating, and the means of each statistic for all participants were obtained (table 6). The Pearson correlation coefficient (R) between the overall fit rating and the mean dimensional difference was 0.07895 (p = 0.8664) and that between overall fit rating and median of the dimensional difference was 0.31114 (p = 0.4970). However, a linear regression analysis showed that overall fit rating is predictive using the maximum, minimum and mean DDs with R2 = 0.97 (equation 1). Table 3.
Simple statistics of questionnaire ratings on a 7-point scale (n = 136)
Item
Mean
Median
Std. Dev.
Minimum
Maximum
Overall fit Heel height Free space in front of toes Fore-foot fit Mid-foot fit Rear-foot fit
7 0.81 7 0.15 0.50
71 0 1
1.20 0.91 1.34
73 73 73
3 3 3
7 0.02 7 0.65 7 0.63
0 0 71
1.43 1.04 1.23
73 73 73
2 1 2
Table 4. Pearson correlation coefficient for questionnaire ratings. Values in parentheses are Prob 4 jrj under H0: r = 0. Numbers in bold are correlation coefficients with an absolute value greater than 0.7 Variable Overall fit Heel height Free space at toes Fore-foot fit Mid-foot fit Rear-foot fit
Overall fit
Heel height
Free space at toes
Fore-foot fit
1.00
0.07 (0.43) 1.00
0.22 (0.01) 0.11 (0.22) 1.00
0.35 (0.00) 0.13 (0.13) 0.75 (0.00) 1.00
Mid-foot fit 0.20 0.07 0.23 0.36 1.00
(0.02) (0.40) (0.00) (0.00)
Rear-foot fit 0.30 0.26 0.38 0.33 0.29 1.00
(0.00) (0.00) (0.00) (0.00) (0.00)
1309
2D Foot outlines Table 5.
The mean ratings and the post-hoc SNK grouping for the perceived fit ratings
Shoe n Overall fit
Sport 40 70.05
Size 8 40 70.75
Size 7 22 71.23
Size 7.5 34 71.50
Shoe n Fore-foot fit
Sport 40 0.5750
Size 8 40 70.0750
Size 7.5 34 70.2353
Size 7 22 70.6364
Shoe n Rear-foot fit
Sport 40 70.0750
Size 8 40 70.8000
Size 7.5 34 70.7647
Size 7 22 71.0909
Table 6. Minimum 711.72 79.24 79.51 710.71 710.53 710.10 79.57
Mean of all participants’ minimum, maximum, mean and median dimensional differences for sorted values of overall fit Maximum
Mean
Median
Overall fit
25.71 26.02 24.20 23.48 24.05 19.63 16.02
71.30 0.65 0.38 0.48 0.78 70.24 70.58
72.92 70.64 70.79 70.57 70.09 71.41 71.40
73 72 71 0 1 2 3
Overall fit rating= 7.970.75028(minimum)70.68591(maximum)+1.60197(mean)
(1)
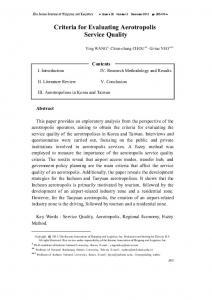
The DD-plots for each shoe are shown in figure 4. The similarity of the different plots is quite striking and hence feature recognition is an important aspect for such plots. The most prominent features of these plots are four minima (figure 3) and one maximum. Each of these five features (four minima and one maximum) was hypothesized to be contributing towards perceived fit and hence they were explored further. Given the similarity of the DD-plots along the perimeter of each participant’s foot, it is clear that the minimum points and the maximum point correspond to critical regions on the foot. For example, the maximum point corresponds to the fore-foot part of the foot (generally in front of the toes) and is at around 50% of the perimeter (range = 45 to 55.2% of perimeter). Four local minimum points are also present in the regions 10 – 30, 30 – 50, 50 – 70 and 70 – 90% of the foot perimeter (figure 3). From figure 2, it may be seen that the regions 10 – 30% and 70 – 90% correspond to the mid-foot region and that regions 30 – 70% correspond to the fore-foot region. For the dimensional difference plot shown in figure 3, the aligned foot and last outlines are shown in figure 5. The four minima (e1, e2, e3, and e4) were determined using MATLAB software. The fore-foot dimensional differences on the medial and lateral sides are e2 and e3 respectively while the midfoot differences on the medial and lateral sides are e1 and e4 respectively. The mean and the ranges of e1, e2, e3, and e4 were 20.6% and 15 – 24.6%, 41.6% and 33 – 45%, 64.4% and 62.7 – 67.5%, 76.1% and 70.1 – 79.5% respectively (table 7). The exact
1310
C. P. Witana et al.
Figure 4. Dimensional difference plot of all participants along the perimeter of (a) left foot when aligned with shoe of size 8; (b) right foot when aligned with shoe of size 8; (c) left foot when aligned with shoe of size 7.5; (d) right foot when aligned with shoe of size 7.5; (e) left foot when aligned with shoe of size 7; (f) right foot when aligned with shoe of size 7; (g) left foot when aligned with athletic shoe last; (h) right foot when aligned with athletic shoe last.
1311
2D Foot outlines
Figure 5.
Left foot of Subject 12 overlapped (positioned and aligned) with size 8 dress shoe. Points 1, 2, 3 and 4 correspond to the local minima.
locations seem to vary with the shape of the foot and the shape of the last and hence the DD plot allows these points to be determined quite easily. Similar to before, the fore-foot ratings and the mid-foot ratings were sorted and the means of the dimensional difference of each participant having the same subjective rating were calculated for all participants. These are shown in tables 8 and 9. The subjective rating for fore-foot fit showed a high correlation with e2 and (e2 + e3). Thus, a linear regression analysis was performed (figure 6). The fore-foot relationship with the corresponding errors for all shoes were as follows: Fore-foot fit rating (q4) = 0.434 (e2+e3)+3.7 Fore-foot fit rating (q4) = 0.758 e2+3.9
R2 = 0.8247 R2 = 0.9145
(2) (3)
Similarly, the subjective rating for mid-foot fit showed a high correlation with e4 and (e1 + e4). The mid-foot relationships with the corresponding errors (figure 7) for all shoes were as follows: Mid-foot fit rating (q5) = 0.63 e4+3.86 Mid-foot fit rating (q5) = 0.495(e1+e4)+7.2
R2 = 0.9082 R2 = 0.9907
(4) (5)
4. Discussion Considering the presence of three distinctly different regions (fore-foot, mid-foot, and rear-foot) in a foot and shoe (Cavanagh 1980), the low correlations between
1312 Table 7.
C. P. Witana et al. Simple statistics of the locations of the four minima and maximum with respect to the percentage perimeter of each foot e1 (%)
e2 (%)
e3 (%)
e4 (%)
Maximum point (%)
15.0 20.6 20.9 24.6 2.0
33.1 41.6 41.6 45.0 1.5
62.7 64.4 64.4 67.5 0.9
70.1 76.1 76.4 79.5 1.9
45.0 50.4 50.5 55.2 2.0
Minimum Mean Median Maximum SD Table 8.
Mean of all participants’ e2, e3, and (e2 + e3) for sorted values of fore-foot fit rating (q4)
Fore-foot fit (q5) 73 72 71 0 1 2 Table 9.
Figure 6.
e3
(e2 + e3)
78.94 76.56 77.42 75.55 73.74 72.56
74.67 74.52 76.01 74.26 72.03 71.67
713.61 711.08 713.44 79.80 75.77 74.23
Mean of all participants’ e1, e4, and (e1 + e4) for sorted values of mid-foot fit rating (q5)
Mid-foot fit (q5) 73 72 71 0 1
e2
e1
e4
(e1 + e4)
79.68 79.21 79.88 78.18 77.39
710.66 79.88 76.54 76.23 75.28
720.34 719.09 716.43 714.41 712.66
Relationship of fore-foot fit rating with dimensional difference between foot outline and last outline for all shoes.
2D Foot outlines
Figure 7.
1313
Relationship of mid-foot fit rating with dimensional difference between foot outline and last outline for all shoes.
overall fit rating and mean or median DD are not very surprising. Even the correlations (table 4) show that overall fit is somewhat related (significant with p 5 0.05) to the fit in all three regions (fore-foot, mid-foot and rear-foot). However, the strong linear relationships between overall fit and the mean, maximum and minimum values of DDs present an interesting notion (equation 1). The negative regression coefficients for both maximum difference and minimum difference indicate that higher values for both of these differences lower the overall fit rating. Thus, it may be hypothesized that overall fit is determined by the degree of poor fit (discomfort) in one or more regions depending on the individual sensitivity as follows: N X Discomfort JD ¼ ai F i for all i ¼ 1 . . . N ð6Þ i¼1
where, Fi is dimensional fit in each sub-region, i. ai are weightings corresponding to each sub-region, i depending on the person’s sensitivity. If JD exceeds the discomfort threshold, then the participant will consider the shoe as having a poor fit. The positive coefficient for the mean difference (equation 1) shows that averaging the (mean) differences (that is, the resulting ‘dc’ component) improves the overall fit rating. Thus it may be hypothesized that if JD is below the pain or discomfort threshold, the wearer may choose a shoe that will attempt to maximize sensation (representative of contact area) as follows: N X bi Fi for all i ¼ 1 . . . N ð7Þ Maximize sensation JS ¼ i¼1
Correlation coefficients among the perceived ratings are relatively low except that between the fore-foot rating and the free space available for toes. This relationship is
1314
C. P. Witana et al.
understandable, as all shoes require some clearance in front of the toes. Hence too much space can result in a loose fore-foot and too little space may be perceived as a tight fore-foot. Traditionally, for good fitting footwear such as ski boots, foot width or foot girths are matched with the shoe width or shoe girths to determine the right fit. However, this procedure is not very accurate, as the positioning of the foot within a shoe has to be correct in order for this match to function. These width or girth measures have to be taken at the correct positions. The DD-plots allow the right place to be determined for matching feet to footwear. In addition, matching two objects can only be performed when all DDs are considered around the foot perimeter. As may be seen from figure 4, the exact location can vary depending on the foot shape and last shape. In this evaluation, we have overcome the location problem by accurately positioning the foot within a shoe in the lengthwise direction using the measured distance. This allowed an accurate quantification of the dimensional differences. The DD-plots among the four pairs of shoes are rather similar. Most importantly, when the perimeter is normalized, the local minima and the maximum fall into a fairly welldefined range. The high correlations between the subjective ratings for mid-foot and fore-foot with the corresponding relative minima are quite striking with R2 values ranging from 0.8247 to 0.9907. The mid-foot rating is very strongly correlated with (e1 + e4). The perception of fore-foot fit is strongly related with e2 and (e2 + e3). Even though the location of the foot relative to the shoe in a lengthwise direction was known from the measurement, the widthwise positioning or the rotation of the foot was not known and was only based on the subjective ratings. This study was not meant to determine the optimal positioning or the exact positioning of the foot inside a shoe. The fact that the fore-foot rating is related to (e2 + e3) provides strong support that the distance between points 2 and 3 forms a good basis for the subjective rating related to fore-foot fit. Similarly, the mid-foot rating is strongly correlated with (e1 + e4). The reason for choosing (e2 + e3) and (e1 + e4) for the subjective rating relationship rather than the dimensional difference at any one point is to make the quantifiable difference independent of the foot rotation. If only one point is chosen such as e4 for the mid-foot rating, the dimensional difference can be biased by the foot rotation or foot positioning in a widthwise direction. Using (e1 + e4) eliminates the bias, and what becomes important is the sum of the dimensional differences between points 1 and 4. In other words, the mid-foot rating appears to be related to the distances between points 1 and 4 on foot and last. These findings do not imply participants’ preference for a tight or loose fit, but, if the person’s fit preference is known, the last maker can design the last considering the dimension required to achieve that grade of fit similar to fitting a hub and a shaft (ISO 286-2:1988). Luximon et al. (2003) alluded to the necessity of supporting the foot at the correct points, similar to any other structure. They also proposed the use of eight landmarks to generate the foot outline within a certain level of accuracy. It is interesting to note that two of those landmarks seem to correspond well with two of the local minimum points, 1 and 4 (figure 3). Having known the importance of the four characteristics points, it is clear as to why the width dimension of a foot sometimes helps in footwear sizing. The distance between points 2 and 3 (d23) on the foot and distance between points 1 and 4 (d14) on the foot may be correlated with the foot width that is usually measured around the metatarsophalangeal region. Thus, if the manufacturer does account for this correlation in the design of the shoe, the shoe can be ‘designed’ to fit well on a
2D Foot outlines
1315
person’s foot. For feet that do not show such a strong correlation or for shoes that have not been designed with such a relation, the shoe–foot fit may not be perceived well. Thus, it may be better that d23 and d14 be considered in the design of footwear. Alternatively, the use of flexible materials in the vicinity of points 1, 2, 3 and 4 may allow the perception of fit to be improved. The DD-plots can also accommodate control limits (upper control limit and lower control limit) for the local maximum and local minima so that manufacturers can set their own standards for these limits depending on the shape of the last and the designed population. The variations in stretch properties of different materials (for example, nylon, leather or other material) can also be accounted for when determining these control limits. Such a process will allow the establishment of fitting standards as is done in mechanical applications (e.g., AGMA 9003-A91). There were no apparent feature points for the heel region. This may be due to many different reasons. However, the shape of the heel region is quite well determined by footwear manufacturers so that very little change is made to this area of a last unlike the fore-foot or the mid-foot regions (Cheng and Perng 1999). One may argue that the time taken for a fit assessment is too small. It should be noted that the matching is really based on the shapes of foot and shoe at a particular time. Longer time may give rise to shape differences (Goonetilleke 1999) and there again, the shape at that time is what is critical if the objective as well as subjective matching is to be performed. Hence short-term evaluations should be done in addition to long-term evaluations. The study does however have some weaknesses. Prior to calculating the dimensional differences, the alignment of each foot within the shoe was made manually. This alignment may not be perfect, as there were no means to assess it without images such as those from magnetic-resonance, ultrasound or even X-ray scans. An automated means to obtain the actual location of the foot within the shoe can help reduce the time of processing and the accuracy. The results of the study have not allowed a complete understanding of footwear fit, but have given useful insights about aspects that contribute to good fit in the forefoot and mid-foot regions using the aforementioned DD plots. Of course, there may be limitations as the shoes used in the study may not be representative of all the shoes that exist in the market today and further investigation may be necessary to better understand the implications of the critical points on the foot of different populations. The shape of the DD-plots will differ depending on shoe style and shape. For example, a pointed shoe may show a different pattern in the DD-plot. A good understanding of the pressure tolerances on the foot could also help to enhance the findings of this study and will help in the establishment of the control limits for the DD-plots. The study shows that a perfect fit (one that is neither tight nor loose) is achieved when the dimensional difference is around 5 mm on the medial side or around 8 mm on the width dimension in the fore-foot region. Similarly, the allowance for a neutral fit in the mid-foot region requires a DD of around 7 mm on the lateral side or 15 mm on the total width. 5. Conclusions A technique has been presented to evaluate the quality of footwear fit. The DD-plots seem to be very promising not only to determine the dimensional mismatches but also to present the shape matches and mismatches in a way that allows the distinct locations of misfit to be identified. Even though the mechanisms causing discomfort
1316
C. P. Witana et al.
are known (Goonetilleke 1998), the variations in the level of discomfort with varying pressure are still not quantified completely. The availability of this information and the establishment of the control limits for a quality of fit measure proposed in this paper can lead to significant improvements in the perceived footwear fit as a shoe performs no better than its fit (Bunch 1988).
Acknowledgments The authors would like to thank the Research Grants Council of Hong Kong for funding this study under grant HKUST 6162/02E. The efforts of Jean Paul Comptese and Johan Steenwyk to provide the experimental shoes and lasts are also much appreciated.
References AGMA 9003-A91. Flexible Couplings—Keyless Fits (American Gear Manufacturers Association). ANSI/ASTM F539-78. 1986, Standard Practice for Fitting Athletic Footwear, 229 – 235. BABA, K. 1975, Foot measurement for shoe construction with reference to the relationship between foot length, foot breadth and ball girth. Journal of Human Ergology, 3, 149 – 156. BUNCH, R. P. 1988, Foot measurement strategies for fitting athletes. Journal of Testing and Evaluation, 16(4), 407 – 411. CAVANAGH, P. R. 1980, The Running Shoe Book (Mountain View, CA: Anderson World). CHENG, F. T. and PERNG, D. B. 1999, A systematic approach for developing a foot size information system for shoe last design. International Journal of Industrial Ergonomics, 25, 171 – 185. CHESKIN, M. P. 1987, The Complete Handbook of Athletic Footwear (New York: Fairchild Publications). CLARKS 1989, Training Dept, 1989, Manual of Shoe Making. Training Department Clarks. COLLAZZO, C. 1988, A 1986 – 1987 study of consumer problems in shopping for footwear, with emphasis on size and fit. Journal of Testing and Evaluation, 16(4), 421 – 424. FALCAO, D. and D’ANGELO, M. D. 1992, Anthropometric measurement of Brazilian feet. Contemporary Ergonomics: Proceedings of the Ergonomics Society’s Annual Conference (London: Taylor & Francis). FREEDMAN, A., HUNTINGTON, E. C., DAVIS, G. C., MAGEE, R. B., MILSTEAD, V. M. and KIRKPATRICK, C. M. 1946, Foot dimensions of soldiers (Third Partial Report Project No. T-13). Armored Medical Research Laboratory, Fort Knox, Kentucky. GOONETILLEKE, R. S. 1998, Designing to minimize discomfort. Ergonomics in Design, 6(3), 12 – 19. GOONETILLEKE, R. S. 1999, Footwear cushioning: relating objective and subjective measurements. Human Factors, 41(2), 241 – 256. HAMILL, J., BATES, B. T., KNUTZEN, K. M. and KIRKPATRICK, G. M. 1989, Relationship between selected static and lower extremity measurers. Clinical Biomechanics, 4, 217 – 225. HILAGA, M., SHINAGAWA, Y., KOHMURA, T. and KUNII. T. L. 2001, Topology matching for fully automatic similarity estimation of 3D shapes. SIGGRAPH 2001, Computer Graphics Proceedings, Annual Conference Series, 203 – 212 (August 2001). HOLSCHER E. C. and HU K. K. 1976, Detrimental results with the common inflared shoe. Orthopedic Clinics of North America, 7, 1011 – 1018. http://www.findarticles.com/cf_dls/ m0LMB/8_21/93210460/p1/article.jhtml?term = . ISO 286-2. 1988, ISO system of limits and fits – Part 2: Tables of standard tolerance grades and limit deviations for holes and shafts. http://www.iso.org. December 31, 2003. KARWOWSKI, W. and JAMALDIN, B. 1996, Methodological framework for quantifying compatibility of complex ergonomic systems, in Proceedings of the 4th Pan-Pacific Conference on Occupational Ergonomics (Taipei, Taiwan: Ergonomics Society of Taiwan), 676 – 679.
2D Foot outlines
1317
KOLARIK, W. J. 1995, Creating Quality (New York: McGraw-Hill). KOS, L. and DUHOVNIK, J. 2002, A system for footwear fitting analysis. International Design Conference—Design Dubrovnik, Croatia (University of Zagreb, Zagreb, Croatia, Faculty of Mechanical Engineering and Naval Architecture) May 14 – 17, 1187 – 1192. LUXIMON, A., GOONETILLEKE, R. S. and TSUI, K. L. 2001, A fit metric for footwear customization. Proceedings of the 2001 World Congress on Mass Customization and Personalization, October 1 – 2, 2001. Hong Kong (CD-ROM). LUXIMON, A., GOONETILLEKE, R. S. and TSUI, K. L. 2003, Foot landmarking for footwear customization. Ergonomics, 46(4), 364 – 383. MARR, S. J. and QUINE, S. 1993, Shoe concerns and foot problems of wearers of safety footwear. Occupational Medicine, 43, 73 – 77. MESSIER, S. P., DAVIES, S. E., CURL, W. W., LOWERY, R. B. and PACK, R. J. 1991, Etiology factors associated with patellofeoral pain in runners. Medicine and Science in Sports and Exercise, 23, 1008 – 1015. NORTON, R. L. 2000. Machine Design (Upper Saddle River, New Jersey: Prentice Hall). NOVOTNI, M. and KLEIN, R. 2001, Geometric 3D Comparison—an Application. ECDL WS Generalized Documents. ECDL 2001 September 8, 2001. Darmstadt, Germany. OSADA, R., FUNKHOUSER, T., CHAZELLE, B. and DOBKIN, D. 2001, Matching 3D models with shape distributions, in International Conference on Shape Modeling and Applications, SMI 2001. May 7 – 11 (Genoa, Italy. Los Alamitos, California: IEEE Computer Society), 154 – 166. PHEASANT, S. 1994, Bodyspace (London: Taylor & Francis). ROSSI, W. A. 1983, The high incidence of mismated feet in the population. Foot and Ankle, 4(2), 105 – 112. ROSSI, W. A. 1988, The futile search for the perfect shoe fit. Journal of Testing and Evaluation, 16, 393 – 403. ROSSI, W. A. 2001, Footwear: The primary cause of foot disorders (Part 2). Podiatry Management. February, 129 – 138. ROSSI, W. A. 2002, Children’s footwear: launching site for adult foot ills; it’s time to advocate shoelessness for kids. Podiatry Management. October, 83 – 100. RYS, M. and KONZ, S. 1989, Adult foot dimensions, in A. Mital (ed.), Advances in Industrial Ergonomics and Safety I (London: Taylor & Francis), 189 – 193. TREMAINE, M. D. and AWAD, E. M. 1998, The Foot and Ankle Sourcebook (Los Angeles: Lowell House). VORUM RESEARCH CORPORATION 2000, User Manual for Cantif-PlusTM YetiTM Foot Scanner, Canada.