Direct Out-of-Memory Distributed Parallel Frequent Pattern Mining Zheyi Rong
Jeroen De Knijf
Department of Math. and Computer Science TU Eindhoven, the Netherlands
Department of Math. and Computer Science TU Eindhoven, the Netherlands
[email protected]
ABSTRACT Frequent itemset mining is a well studied and important problem in the datamining community. An abundance of different mining algorithms exists, all with different flavor and characteristics, but almost all suffer from two major shortcomings. First, in general frequent itemset mining algorithms perform exhaustive search over a huge pattern space. Second, most algorithms assume that the input data fits into main memory. The first problem was recently tackled in the work of [2], by direct sampling the required number of patterns over the pattern space. This paper extends the direct sampling approach by casting the algorithm into the MapReduce framework, effectively ceasing the memory requirements that the data should fit into main memory. The results show that the algorithm scales well for large data sets, while the memory requirements are solely dependent on the required number of patterns in the output.
1.
INTRODUCTION
Pattern mining is one of the central topics in datamining, and frequent pattern discovery has been a fruitful and active research area the past two decades. The most basic setting, i.e. the frequent itemset mining case, has shown its applicability for a wide range of traditional datamining tasks: clustering, classification, data exploration and association rules [10]. However, due to the enormous growth of available data to analyze, one of the traditional assumptions that data fits into main memory does no longer always apply. For example, web accesses log data for a popular internet portal in the Netherlands alone, consists of 200GB for two months only. Let alone the multitude of datasets of interest for popular social media services such as Facebook, Twitter or Youtube. This ”big data” setting causes severe problems for traditional frequent itemset mining algorithms to be applied in this setting. The main reasons for this are: 1. Most frequent itemset mining algorithms assume that the transactional database fits into main memory, which is obviously invalid in the big data setting. Permission to make digital or hard copies of all or part of this work for personal or classroom use is granted without fee provided that copies are not made or distributed for profit or commercial advantage and that copies bear this notice and the full citation on the first page. Copyrights for components of this work owned by others than the author(s) must be honored. Abstracting with credit is permitted. To copy otherwise, or republish, to post on servers or to redistribute to lists, requires prior specific permission and/or a fee. Request permissions from
[email protected]. BigMine’13, August 11, 2013 Chicago, Illinois, USA. Copyright 2013 ACM 978-1-4503-2324-6/13/08 ...$15.00.
[email protected]
2. In general, frequent itemset mining algorithms perform an exhaustive search over a huge pattern space. Although this is in principle possible for big data, it will most likely lead to severe computational cost. One popular approach to handle the high computational costs is to use parallelized frequent itemset mining algorithms. Related to expensive enumeration of all frequent patterns, is that for most applications only a few patterns can effectively be utilized. Hence, the computational burden devoted on enumerating all frequent patterns is wasted on patterns that will be ignored. Moreover, deriving and storing all frequent patterns can in case of big data leads to severe problems in order to manage these. This is caused by the fact that the output size of all frequent patterns, provided and interesting and hence low minimum support parameter is used, is often multiple times the size of the input data. The work by Boley et al. [2] recently proposed a sampling algorithm that directly samples k desired patterns from the pattern space. The advantage of this approach is that the sampling algorithms achieve near optimal time complexity per pattern as well as the ability to control the distribution of the produced patterns. However, as in case of most frequent itemset mining algorithms the direct sampling approach assumes that the input data fits into main memory, which makes it inapplicable for large datasets. A popular paradigm two efficiently extract and compute information from large datasets is the MapReduce framework. Emerged from Google’s needs to efficiently compute over extreme large sets of raw Internet data, MapReduce is designed to efficiently distribute the task at hand over large distributed computing facilities. In particular, MapReduce provides the user with an abstraction layer over the physical cluster and handles inter-machine communication, partitioning the data and job scheduling [5]. In a typical setting a MapReduce task runs on a cluster of commodity machines, which can be extended by adding resources on demand. In this work we extend the direct sampling method by Boley et al. [2], such that it is able to coop with large datasets. Specifically, we transform the method into the Hadoop MapReduce framework, resulting in a distributed parallel frequent itemset mining algorithm with low memory demands. We performed extensive empirical evaluation on real-world and synthetic datasets to investigate the scalability and speedup of the MapReduce implementation. In this paper we will show that: • The Hadoop map-reduce implementation of the frequency and area based sampling algorithms obtain a
good speedup, which make these approaches suitable for big data. • The memory requirements are only dependent on the size of the output data. The rest of this paper is organized as follows: In the next section we describe the related work in more detail. In section 3 basic concepts and notation are introduced, and a brief description of the direct sampling algorithm is given. In the following section we present our adaption of the sequential direct sampling algorithm into the MapReduce framework and discuss the memory usage of the method. Moreover, we also discuss implementation details and point out how these affects the performance of the system. Section 5 is concerned with the extensive experimental evaluation of the method. In particular we perform our method on synthetic and real datasets on a large (up to 500 mappers) Hadoop MapReduce cluster. In the final section we draw conclusions and give directions for further research.
2.
RELATED WORK
Because the enumeration of all frequent patterns in a database is inherently a computational exhaustive task, parallelization of frequent itemset mining algorithms has been an active research topic for a while, see for example [15]. The most effort has been put into so called shared memory parallelization, however this type of parallelization is not scalable for huge datasets, due too the extensive memory requirements. Parallel frequent itemset mining in distributed environments, has been examined in a few papers, see for example [8], which results in algorithms that are typical scalable up to a hundred different computers. Recently, the focus of the research has been shifted towards mining algorithms in the MapReduce framework. The main motivation is to drastically increase the number of resources and to have fault tolerance mechanisms automatically incorporated into the system. Most related to our work is the MapReduce implementation of the popular FPGrowth [11] algorithm: parallel FP-growth (PFP). This algorithm is described in the work by Li et al. [12]. The main idea of PFP is to first group the transactions, and then build a local FP-Tree for each group. The outcome of these trees is aggregated, and the k most frequent patterns are reported. The major difference with our approach is that PFP perform an exhaustive search, although only the top k frequent items are reported. Another important difference is the amount of communication that is needed between mappers and reducers. In particular, the pre-processing step of PFP, i.e. the grouping, requires multiple communication steps. In Section 5 we experimentally compare PFP with our frequency based sampling approach.
3.
PRELIMINARIES
In this section we introduce the concepts and notations used in the rest of this paper. Moreover, we will briefly describe the sequential two steps direct sampling method by [2]. Let P(X) denote the powerset of a finite set X and let µ(X) denote the uniform probability distribution on X. Moreover, for positive weights w : X → R+ let w (X) denote the distribution on X obtained by normalizing w.
Let I be a set of items, i.e. a set of binary elements. Moreover let D = D1 , . . . , Dm be the transaction database, i.e. a bag of sets. Each record in D is a subset of I, i.e. Di ∈ D : Di ⊆ I. For a dataset D over I, the pattern space L(D) equals P(I). For a pattern F , the support set of F in D denoted as D[F ] is defined as the multiset of all records in D in which all elements of F are contained, i.e. D[F ] = {D ∈ D : F ⊆ D}. In order to derive the patterns of interest, we still need an interesting measure over the pattern space. Following Boley et al. [2] this work we will consider three different types of interesting measures: support, area and discriminativity. Support is the most well known and used measure, and is equivalent to the length of the support set of a pattern, i.e. the number of records in which a pattern occurs. More formally supp(D, F ) = |D[F ]|. Another interesting measure considered is the so called area [9]: area(D, F ) = |F ||D[F ]|. Intuitively this measure correspond to those patterns that optimize for both the length of a pattern (i.e. contains many items from I) and its support. The last measure considered is applicable in a supervised setting: assumed that for every record D ∈ D a binary class label is assigned, then let D⊕ denote the records that belong to the positive class and D the records with a negative class label. The discriminativity measure favors patterns that have high support in one class and low support in the other class. This type of patterns is well studied, for example in the setting of emerging patterns [6] and contrast set mining [1].The discriminativity is then formally defined as: disc(D, F ) = |D⊕ [F ]| |D \D [F ]|.
3.1
Sequential Sampling Algorithms
With the notation and concepts previously introduced, we are now able to describe the sequential two step direct sampling method [2]. The general outline of the algorithm is as follows: first one select a data record (in case of discriminativity tuple of data records ) proportional to the probability distribution of interest, followed by a sampled subset of the previously selected data record again proportional to the probability distribution of interest. A important observation for this approach is that one first have to compute the weights of all records, or tuples in case of discriminativity, and then sample the k records (tuples) from which the subsamples are reported as patterns of interest. Hence, in case of the interesting measure for support or area is used a preprocessing that is linear w.r.t transaction database is needed, while in case of discriminativity this preprocessing step is quadratic. Obviously, when the data fits into main memory this preprocessing can be easily solved. Algorithm 1 Support and Area based direct sampling Input: dataset D, number of required patterns k, interesting measure q Output: k random sets R, with each R ∼ q(P(I)) 1: calculate weights for each record D ∈ D according to q 2: for i ← 1 to k do 3: draw a record D ∼ w (D) 4: draw a subset R ⊆ D according to q 5: Out ← Out ∪ {R} 6: end for 7: return Out
The pseudocode of the direct sampling algorithm for the support and the area measure is shown in Algorithm 1. For the support measure, the weight of data record D ∈ D is defined as 2|D| , while the subset of the data record is drawn with uniform probability over all the subset, i.e. R ∼ µ(P(D)). In case that the area measure is used, the weights are defined as: |D|2|D|−1 , and the subsets from the records are sampled by first determining the size of the subset with weights 1, . . . , |D| and then sample with uniform probability over all subsets of the previously determined size. Algorithm 2 Discriminativity based sampling Input: datasets D⊕ , D , number of required patterns k Output: k random sets R, with each R ∼ disc(P(I)) 1: for all (D⊕ , D ) ∈ D⊕ × D do 2: w(D⊕ , D ) = (2|D⊕ \D | − 1)2|D⊕ ∩D | 3: end for 4: for i ← 1 to k do 5: draw (D⊕ , D ) ∼ w (D⊕ × D ) 6: draw F ∼ µ(P((D⊕ \ D ) \ ∅)) and F 0 ∼ µ(P(D⊕ ∩ D )) 7: R ← F ∪ F0 8: Out ← Out ∪ {R} 9: end for 10: return Out
A detailed description of the direct sampling algorithm with the discriminativity measure is given in Algorithm 2. Lines 1–3 of the algorithm describe the computation of the weights, while the actual sampling of the patterns is described at lines 5–6. A more detailed description of the direct sampling method, justification and correctness of the method is provided in [2].
4.
ALGORITHM
In this section we describe the adaptation of sequential sampling algorithms into the MapReduce framework. First, we discuss a method to efficiently draw k sample in one pass over the data, then we combine the different algorithms in the MapReduce framework. The major obstruction for applying Algorithm 1 and 2 to large datasets are the memory requirements of the pre-processing step, i.e. the computation of the weights for every record in the dataset. In particular, under the realistic assumption that k t then 6: replace t and its corresponding item in R with respectively li and vi 7: end if 8: end for 9: return the items in R
The A-RES [7] algorithm to sample k weighted items in one pass over the data, is a so called ”reservoir” based approach. The pseudocode is given in Algorithm 3. The first k data elements and their corresponding keys are inserted into the reservoir. Then for every following data element its corresponding key is computed (line 4). A data element in the reservoir is replaced with a new one, whenever its corresponding key is lower then the key of the new data element (line 5–6). As such, after the first k data elements are processed, the reservoir contains at each moment the k data elements that have the largest key. Note 1/w 1/w that, for two keys vi = ri i and vj = rj j it holds that: P [vj ≤ vi ] = wj /(wi + wj ). In its basic setting the A-RES algorithm requires the generation of n random numbers, were n is the number of weighted items to sample from. In our case this is equal to number of data elements, i.e. depending on the interesting measure either |D| or |D⊕ × D |. This can be optimized by making use of so called sampling with jumps. The main idea behind sampling with jumps is that a random variable determines what will be the next data element to enter the reservoir. A detailed description is provided in Algorithm 4. The crucial step consists of skipping items until the sum of their weights is larger than the smallest key in the reservoir (line 6 – 12). With this adjustment, and under the assumption that the weights are independent random variables, the number of random numbers generated is reduced from n to
k log(n/k) [7]. Algorithm 4 AJ-RES Input: A population V = {v1 , . . . , vn } with corresponding weights {w1 , . . . , wn } Output: a weighted random sample of V without replacement of size k 1: insert the first k items in R and calculate their keys 2: t ← the smallest key in R 3: r ← µ(0, 1) 4: s ← 0 5: for i ← k + 1 to n do 6: if s > log(r)/log(t) then 7: ri ← µ(twi , 1) 1/w 8: li ← r i i 9: replace t and its corresponding item in R with respectively li and vi 10: t ← the smallest key in R 11: s←0 12: end if 13: s ← s + wi 14: end for 15: return the items in R To use Algorithms 3 and 4 in the adjusted direct sampling approach, we need to make a slight modification to the weighted sampling over a stream methods. That is, in the current setting, these algorithms sample k items without replacement while the direct sampling requires sampling with replacement. This obstacle can be trivially overcome by running k instances of the A-RES/AJ-RES with reservoir size 1. Note that, this adjustment requires that for each data element a decision has to be made for each of the k reservoirs. As a result, the number of random numbers to generate in the A-RES/AJ-RES algorithm increases respectively from n to kn, and from k log(n/k) to k log(n).
4.1
MapReduce Implementation
In order to use the MapReduce framework, the algorithm must be decomposed into map and reduce steps. Map functions are run in parallel on different parts of the input. The output of these map function consists of key value pairs and is passed on to one or more reducers. The reduce step process unique keys, and applies a user defined function to produce the final output of the MapReduce algorithm. The frequency and area based sampling algorithms, i.e. the algorithms with linear pre-processing time (Algorithm 1), the adaptation into the MapReduce framework is given the precious algorithms now pretty straightforward. The pseudocode of these Linear pre-processing time algorithms is given in Algortihm 5. In particular, each mapper draws according to the interesting measure k records from its part of the transaction database (line 3), this is done by using Algorithm 4. Given that there are m mappers, the total number of sampled records equals mk. The reduce step selects from the overall output the k records with the largest key, this step is accomplished by one reducer. Finally, the reducer continues with sampling the k patterns from the selected records, as is done in Algorithm 1 (line 4). Once that the data is divided over the mappers, the required communication cost are low: only the output of the m mappers must be send over the network. MR-DPSL requires that
each mapper and the reducer can store k data records in main memory. Hence the memory requirements of the frequency and area based direct sampling algorithm are only dependent on the number of patterns of interest and the size of the largest transaction number, that is | maxD∈D |. Algorithm 5 frequency and area based mapReduce direct pattern sampling Input: dataset D, number of required patterns k, interesting measure q Output: k random sets R, with each R ∼ q(P(I)) 1: MapFunction 2: for i ← 1 to k do 3: run Algorithm 4, with sample size =1 and weights according to q 4: end for Output: k (key,record) pairs 5: ReduceFunction 6: select the k pairs with the largest key 7: for i ← 1, to k do 8: Out ← Out ∪{subsample from recordi according to q} 9: end for Output: Out Direct sampling with the discriminativity measure of interest is however more problematic to integrate into the MapReduce framework. A major obstacle in this setting is to generate all tuples of records. That is, for every record from D⊕ all records of D must be scanned. Preliminary experiments indicated that this adaptation was timewise not doable for moderate datasets on the cluster we used. However, the amount of tuples to be generated can be drastically reduced. In particular, for a tuple (D⊕ , D ) ∈ D⊕ × D a weight w(D⊕ , D ) = (2|D⊕ \D | − 1)2|D⊕ ∩D | is computed that determines with which probability that this tuples is sampled. However, a trivial upper bound—that is only dependent on D⊕ —is 2|D⊕ | . Hence, in the reservoir based approach (Algorithm 3) this upper bound can be used to apriori determine that the tuple will not be inserted into the reservoir. And as a result, the algorithm can skip the data record D . If however, the upper bound is larger than the minimum key in the reservoir, then the record should be scanned and the exact key should be determined. However, a downside of this approach is that the AJ-RES algorithm cannot be used to sample the k records. This is because the algorithm with jumps requires that every weight is computed. Therefore, the A-RES algorithm (Algorithm 3) to sample k elements from the input is used. A high level description of the MapReduce direct pattern sampling approach with discriminativity as interesting measure is provided in Algorithm 6. Notice that, also in this case the memory requirements are only dependent on the number of patterns and the maximal transaction length. A further important (implementation) issue is which datatype to use for real numbers. In particular, the required arrhythmic precision is dependent on the number of items in a record. That is, both Algorithm 5 and Algorithm 6 require the computation of 2|D| . In order to be applicable to datasets that contain large transaction (e.g. |D| > 64), specialized arbitrary precision arrhythmic libraries are needed. In our implementation we used as default the native java
Algorithm 6 discriminativity based mapReduce direct pattern sampling Input: datasets D⊕ and D , number of required patterns k Output: k random sets R, with each R ∼ disc(P(I)) 1: MapFunction 2: for i ← 1, to |D | do |D⊕ |
if r1/2 > lowest key in reservoir, with rµ(0, 1) then 4: D ← read next record from D 5: run Algorithm 3, sample size =1, weights according to disc 6: else 7: skip record in D 8: end if 9: end for Output: k (key,record) pairs 10: ReduceFunction 11: select the k pairs with the largest key 12: for i ← 1, to k do 13: Out ← Out ∪{subsample from recordi } 14: end for Output: Out 3:
results. The experiments were conducted on the Sara Hadoop cluster1 . The cluster is deployed with Hadoop-0.20.2; the block size is 128M; the replication factor is 3; and the speculative task execution feature is disabled. This cluster consists of 82 nodes, and in each node there are respectively 8 slots of mappers and reduces, leading to totally 656 mappers and 656 reducers. However, since the cluster is shared with many users, and is being heavily used, the execution time of a job can vary quite a bit. In particular, if different I/O intensive jobs are scheduled in the same nodes, the different tasks can drastically reduce each other performance. In order to obtain a proper estimate on the scalability of the algorithms, we conducted all experiments three times, and report the average value.
5.1
• Weblog dataset A web accesses log dataset from a popular Dutch portal website. Each visit to this website was recorded and enriched with derived features when available. The logs are taken over a period of two months and consists of more than 461M records (i.e. page views). The average record length is 22, while the maximum record length equals 30. In total, there are over 20M distinct items, while the overall size of the dataset is over 200GB
double representation.
5.
EXPERIMENTAL EVALUATION
In this section we experimentally evaluate the MapReduce implementations of the direct sampling approach. In particular, we conduct experiments with Algorithm 5 and the frequency interesting measures and with Algorithm 6 to derive discriminating patterns. We did not performed separated tests for Algorithm 5 with the area measure. This is because there is no fundamental computational difference between the two flavors of the same algorithm, and hence the computational results of one variant is also representative for the other variant. The overall goal of the experimental evaluation is to exam whether the proposed algorithms are suited to mine large datasets. In particular, the main question to investigate is: given enough computational resources, are the algorithms able to extract a limited number of patterns on arbitrary large datasets ? Although, it is not feasible to run the algorithm on ’arbitrary’ large datasets, we test the scalability by measuring the speedup. That is, how much faster is the algorithm when more computing units are added ? The underlying idea is, if the speedup is good, arbitrary large datasets can be processed by adding a sufficient amount of nodes to the cluster. Another important characteristic of our algorithm to evaluate is its dependency on the input parameter k, that is the number of patterns to mine. In particular, as stated in section 4, the number of random numbers to generate is linearly dependent on the k parameter, and moreover is independent of the number of mappers that is being used. Hence, in the worst case is the computation time negatively effected by a factor k. Finally, we compare our direct sampling implementation with the popular and publicly available MapReduce implementation of parallel FP-growth [12]. In particular, we will report the run time for different support thresholds and discuss the
Test Collection
Because of the high computational burden of the discriminativitybased sampling approach and the limited resources, we used smaller datasets for the discriminativity measure. For the frequency-based sampling, the following two datasets were used:
• Synthetic dataset An artificially dataset generated using the generator from the IBM Almaden Quest research group. This dataset contains 100M records (9.15GB) with an average length of 20, and a maximum of length of 55. The number of distinct items is equal to 1000. For the discriminativity-based sampling two much smaller datasets were used for evaluating the performance: • Weblog one day dataset A one day snapshot of the Weblog dataset. It contains 9.5M records, and its total size is 4.4GB. To split this dataset into two classes for the discriminativity-based sampling, we assumed that in 1% of the records the user clicked on one of the displayed links. The goal is to derive patterns that describes the different groups, i.e. users that click on a link and those that didn’t. • Census income [13] It is a dataset storing the income information with census data. We treat records with a salary larger than 50K as the positive ones, and the remaining as the negative ones. This leads to 18, 568 records in the positive set, and 280, 717 records in the negative set. All records are of equal length: 41.
5.2
Speedup Evaluation
In order to evaluate the speedup of our distributed sampling algorithms, we fixed the sample size and varied the number of mappers. Speedup refers to how many times a parallel algorithm is faster than the corresponding sequential 1
https://www.surfsara.nl/project/hadoop
500
100
Ideal Frequency-weblog
90
400
Ideal Frequency-synthetic
80
Speedup
Speedup
70 300
200
60 50 40 30
100
20 0 0
100
200
# Mappers
300
400
500
10 10
20
30
40
50 60 # Mappers
70
80
90
100
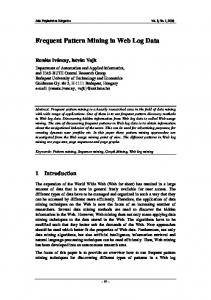
Figure 1: Speedup for the frequency based sampling for the Weblog dataset (left) and the synthetic dataset(right). The blue line indicates the ideal speedup, the red line shows the obtained speedup. algorithm, hence the optimal speedup that can be obtained is equivalent to the number of mappers used. In our experiments, however, we did not measure the running time of our sampling algorithms when using only one mapper due to the large sizes of the datasets. Instead, we took 10 mappers for the frequency-based sampling and 100 mappers for the discriminativity-based sampling as the baselines, and computed the speedup with respect to this baseline. In all experiments we fixed the number of patterns to sample to 100.
5.2.1
Frequency based sampling
Figure 1 shows the speedup results of the frequency-based sampling on the weblog dataset (left plot) and the synthetic datasets (right plot). The speedup for the frequency based sampling on the weblog data is close to the optimal speedup when the number of mappers is below 200. After this point, the overhead of involving more mappers and the limited computation time (489 seconds with 100 mappers), results in a less optimal speedup. This is also reflected when investigating the efficiency, defined as the speedup divided by the number of mappers, which drops from 0.97 with 100 mappers to 0.68 with 500 mappers. The overall computation time to sample 100 patterns from the weblog datasets varies from 4, 748 seconds when 10 mappers are used till 138 seconds with 500 mappers. The same observations can be made for synthetic dataset, although for this dataset the ideal number of mappers is around 40. Obviously, this is because the synthetic dataset is relatively small, and the computation time is low. When more mappers are involved the efficiency drops from 0.9 with 40 mappers to 0.51 when 100 mappers are used. The computation time varies between 741 and 121 seconds. The speedup and efficiency obtained indicates that Algorithm 5 scales up pretty well for large datasets.
5.2.2
Discriminativity based sampling
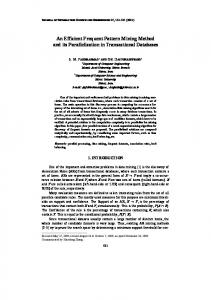
Figure 2 shows the speedup results of the discriminativity based sampling on the one day snapshot of the weblog dataset (left) and the census dataset (right). The speedup obtained on the weblog snapshot is nearly ideal before the number of mappers reaches 300, but diminishes afterwards.
The average running time of the baseline with 100 mappers is 2 hours and 25 minutes and drops to 46 minutes with 500 mappers. When 300 mappers are used the efficiency is 0.96, while for 500 mappers the efficiency is merely 0.63. The results are remarkably different for the census dataset. Although this dataset is considerably smaller, both the speedup and the efficiency are close to optimal when more mappers are involved. In particular, the running time drops from 77 minutes with 100 mappers to 16 minutes with 500 mappers, at the same time obtaining an efficiency of 0.93. A plausible explanation for this difference is that the transaction length of the census data is twice the average transaction length of the weblog dataset, hence the computation of the weights require more computation time in case of the census dataset. Another remarkable observation is that for the census data with 300 mappers, so called super linear speedup is achieved. That is, the computation time with 300 mappers is less than three times the computation time with 100 mappers. However, this phenomenon is often observed when performing experimental evaluation of parallel algorithms and is likely caused by caching behavior of the nodes. Although the computation time is large for relative small samples, the speedup and efficiency scores acquired suggests that discriminativity based sampling is able to derive interesting patterns from large datasets when enough computing resources are available. However, the number of mappers needed for large dataset is huge, and is likely to grow fast as the data size increases.
5.3
Scalability in the number of patterns
Since the sampling algorithms need to maintain as many reservoirs as the user defined sample size, the question arises how heavily dependent the computation time is on this user specified parameter. In order to evaluate this, we fixed the number of mappers and varied the sample size. In particular, for both frequency as well as discriminativity based sampling we set the the number of mappers to 100, and varied the sample size between 100 and 800. The run time for the different sample sizes is compared with the time needed to sample 100 patterns, this ratio was taken and plotted versus the number of samples. Moreover, since the expected run time should roughly be linear to the size of samples,
500
400
400
350
350
300
300
250
250
200
200
150
150
100100
150
200
250
300 350 # Mappers
Ideal Discriminativity-census
450
Speedup
Speedup
450
500
Ideal Discriminativity-oneday
400
450
500
100100
150
200
250
300 350 # Mappers
400
450
500
Figure 2: Speedup for discriminativity based sampling, the left plot contains the results obtained on the one day snapshot of the Weblog data, while the right one displays the results obtained on the census dataset. The blue line indicates the ideal speedup, the red line shows the obtained speedup. we drew a line indicating the expected ratio of the computation time needed. The results are displayed in Figure 3, left for the Weblog dataset with the frequency based sampling algorithm, right for census dataset with the discriminativity based sampling. The time needed for the frequency based sampling increases along approximately half as fast as the the sample size, while for the discriminativity based sampling the computation increases approximately at the same pace as the sample size. Note that for the later case, the experiments with k = 300 and k = 400 indicate that the computation time increases faster than the sample size. However, this is most likely caused because of the heavy workload on the cluster, resulting in a wide variety of time measurements for these experiments. For example, in the run with 300 samples the maximal difference between two runs was more than three hours on a total computation time of seven hours on average.
5.4
Comparison with parallel FP-growth
A publicly available MapReduce implementation of parallel FP-growth (PFP) [12] is available in the popular Apache Mahout2 machine learning library. Although the setting in which PFP operates differs from the direct sampling approach, i.e. given a minimum support threshold PFP mines all patterns that satisfy this threshold and then reports the k requested patterns, we think that the comparison is interesting from an end user point of view. We run PFP, with various minimum support thresholds, on the Hadoop cluster with the number of mappers fixed to 100. The results are summarized in Table 1. Besides the run time, we also show the number of frequent items, that is singleton itemsets, and the number of frequent patterns. Note that the number of frequent itemsets is limited by the user specified parameter k (in our case k = 50), that defines the maximum number of frequent itemsets to show per item. The first noteworthy observation is that PFP needs far more computation time in its pre-processing step, i.e. counting the single items, than the frequency based sampling approach need to derive 100 patterns. In particular, 406 versus 2
http://mahout.apache.org/
Synthetic Weblog
Minsup 99% 5.6% 99% 1% 0.1%
Time 406 1, 518 4, 118 5, 625 6, 325
Singletons 0 63 3 128 304
Patterns 0 63 3 4, 543 10, 825
Table 1: Run time, number of frequent items, and number of frequent itemsets obtained by PFP for the synthetic and the weblog datasets. The results are shown for various minimum support thresholds. 144 seconds for the synthetic dataset and 4, 118 vs. 489 for the Weblog dataset. Another issue is that for the synthetic dataset we were not able to mine 100 frequent patterns, we were only able to derive 63 frequent singletons. Lowering the frequency threshold resulted for this dataset in out of memory errors. For the weblog dataset, we were able to obtain the desired number of patterns by lowering the frequency threshold, but the resulting computation time for PFP is multiple times the time needed for the frequency based sampling algorithm. Although, the results presented in Table 1 suggests that frequency based sampling approach is superior in terms of run time than PFP, there are many different parameter that influences the computation time. As we have previously shown, the computation time for frequency based sampling is both dependent on the number of samples and on the average transaction length. On the other hand, for PFP the computation time is dependent on the minimum support threshold and the density of the data. Provided that PFP does not run out of memory, it is likely that it in some settings PFP outperforms the frequency based sampling when a large number of patterns is demanded.
6.
CONCLUSION
In this work, we successfully casted the recently proposed algorithms to directly sample local patterns [2] into the mapReduce framework. The theoretical analysis show that the
8
Linear Discriminativity-census
5
6
Scaleup of sample sizes
Scaleup of sample sizes
7
6
Linear Frequency-weblog
5 4 3
4
3
2 2 1 100
200
300
400 500 Sample size
600
700
1 100
800
200
300 400 Sample size
500
600
Figure 3: The ratio of the computation needed for different sample size and the baseline, plotted in red. Results for the Weblog dataset (left) with frequency based sampling and the census data with discriminativity based sampling (right). Additionally, the blue line displays the ratio expected. memory requirements of both proposed algorithms are limited to the number of patterns in the output. Extensive experimental evaluation showed the scalability of the frequency based sampling approach, and hence its applicability for ”big” data. Although, discriminativity based sampling scales reasonably well for small samples, it is doubtful wether this algorithm will scale for large dataset, mainly because its intensive usage of computational resources. For both approaches we showed that the computation time is roughly linear dependent on the number of patterns to sample, which makes the algorithm suitable in most practical settings. Furthermore, we compared the frequency based sampling with a state-of-the-art mapReduce implementation of parallel FPgrowth, and showed that our approach outperforms PFP in term of computation time. Further research is involved with speeding up the quadratic pre-processing step needed for discriminativity based sampling. In particular, a recent followup paper by Boley et al. [3], addressed this problem and used coupling from the past to avoid the computational bottleneck, it is however still open how to integrate the coupling from the past technique into an mapReduce framework. The source code is publicly available at: http://www.win.tue.nl/~mpechen/projects/capa/.
[4]
[5]
[6]
[7]
[8]
[9] [10]
Acknowledgement This work was carried out on the National e-infrastructure with the support of SURF Foundation.
[11]
7.
[12]
REFERENCES
[1] S. D Bay and M. Pazzani. Detecting group differences: Mining contrast sets. Data Mining and Knowledge Discovery, 5(3):213–246, 2001. [2] M. Boley, C. Lucchese, D. Paurat, and T. G¨ artner. Direct local pattern sampling by efficient two-step random procedures. In ACM SIGKDD International Conference on Knowledge Discovery and Data Mining, pages 582–590. ACM, 2011. [3] M. Boley, S. Moens, and T. G¨ artner. Linear space direct pattern sampling using coupling from the past.
[13] [14]
[15]
In ACM SIGKDD International Conference on Knowledge Discovery and Data Mining, 2012. J. Cheng, Y. Ke, and W. Ng. A survey on algorithms for mining frequent itemsets over data streams. Knowledge and Information Systems, 16(1):1–27, 2008. J. Dean and S. Ghemawat. Mapreduce: simplified data processing on large clusters. Communications of the ACM, 51(1):107–113, 2008. G. Dong and J. Li. Efficient mining of emerging patterns: Discovering trends and differences. In ACM SIGKDD International Conference on Knowledge Discovery and Data Mining, pages 43–52, 1999. P. Efraimidis and P. Spirakis. Weighted random sampling with a reservoir. Information Processing Letters, 97(5):181 – 185, 2006. M. El-Hajj and O. Zaiane. Parallel leap: large-scale maximal pattern mining in a distributed environment. In IEE International Conference on Parallel and Distributed Systems, 2006. F. Geerts, B. Goethals, and T. Mielik¨ ainen. Tiling databases. In Discovery Science, 2004. J. Han, H. Cheng, D. Xin, and X. Yan. Frequent pattern mining: current status and future directions. Data Mining and Knowledge Discovery, 15(1):55–86, 2007. J. Han, J. Pei, and Y. Yin. Mining frequent patterns without candidate generation. In Proceedings ACM SIGMOD, pages 1–12. ACM, 2000. H. Li, Y. Wang, D. Zhang, M. Zhang, and E. Chang. Pfp: parallel fp-growth for query recommendation. In ACM RecSys, 2008. D. Newman, S. Hettich, C. Blake, and C. Merz. UCI repository of machine learning databases, 1998. S. Parthasarathy, M. Zaki, M. Ogihara, and W. Li. Parallel data mining for association rules on shared-memory systems. Knowledge and Information Systems, 3(1):1–29, 2001. M. Zaki. Parallel and distributed association mining: A survey. Concurrency, IEEE, 7(4), 1999.