International Journal of Information and Electronics Engineering, Vol. 3, No. 3, May 2013
Discarding Unwanted Features from GPR Images Using 2DPCA and ICA Techniques Branislav Vuksanovic, Nurul Bostanudin, Hizrin Hidzir, and Hassan Parchizadeh
Abstract—Measurements obtained using ground penetrating radar (GPR) can suffer from large amount of noise and clutter. Current methods, such as time gating and background averaging can be applied to remove reflections from air-ground interface but do not perform well when removal of unwanted clutter signals originating from the objects other than the target is needed. This work describes and evaluates performance of two signal processing techniques – two-dimensional Principal Component Analysis (2DPCA) and Independent Component Analysis (ICA) in this kind of tasks. Experimental data using simple geometric shapes under laboratory conditions, containing strong clutter components are used to demonstrate the effectiveness of the proposed techniques.
Controller
Transmitter
Antenna
Ground
Computer
Data Logger
Display, Analysis, Decision
Receiver
Antenna
Object/ Characteristics to be detected
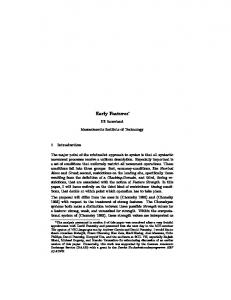
Fig. 1. Outline of basic GPR system
The interference in measured GPR signals is usually made up of three main components [8]: 1) The cross-talk between the transmitting and receiving antennas. 2) The reflection from the air-ground interface. 3) The scattered signals from other objects within the soil. However, due to the constant distance between both antennas, the cross-talk signal (i) will arrive to antenna receiver earlier than any other signal which makes it easier to distinguish and reject this “interference” component [9]. The signal (ii) is usually very strong and a number of successful clutter reduction approaches have been suggested in the literature, including simple mean scan subtraction [10], two-dimensional digital filtering [11], wavelet packet decomposition [10], likelihood ratio test [9], [10], [12], parametric system identification [10], [13], and Kalman filtering [12], [14]. Most of these methods depend on background signal estimation [9] where the background signal can be estimated by taking the mean value of the unprocessed ensemble of the collected GPR data, followed by employing the simple mean scan subtraction. A trace of returned radar signal (A-scan) far away from the target location might be used instead of mean scan subtraction. These methods have been used widely in GPR applications, but the work on this problem is ongoing as they cannot completely remove the direct wave from the received data due to the air-earth interface and time-shift (jitter) of the radar system. Removing signals (iii) scattered from other objects within the soil is a more difficult problem and can not be effectively tackled with previously discussed methods. Those features are usually unevenly distributed across the image and can in many cases be much stronger than the weak target signals. To extract the target signals from such a complex data set, this work proposes the use of two data decomposition techniques – Principal and Independent Component Analysis (PCA and ICA). Those techniques rely on reducing the higher-order statistical dependencies in GPR returned signals.
Index Terms—Eigenimages, ground penetrating radar, independent component analysis, principal component analysis, and target signal.
I. INTRODUCTION The term Ground Penetrating Radar (GPR) refers to a range of electromagnetic (EM) techniques designed primarily for the location of objects or interfaces beneath the earth’s surface or within a visually opaque structure [1]. GPR is a non-destructive and non-invasive geophysical technique with a wide variety of applications in site and ground investigations. It is mostly used in reflection mode where a signal is emitted via a transmitter antenna into the structure and soil under investigation as shown in Fig. 1. Energy reflected by changes in material properties is received and recorded by the receiver antenna. The collected raw data are then processed and interpreted [2]. GPR has recently been used in diverse applications such are archaeology [3], road construction [3], [4], road surveying of crack depth [5], building investigations [6], and non-destructive testing of structures including a reinforced concrete airfield [7]. It can be difficult for a GPR system or even a human GPR operator to identify the target in the situations where target is buried close to the surface of the ground, has a very small geometrical dimensions or permittivity difference to the ground [4]. In all these situations the reflected signal of the target is very weak and usually overlapped with clutter, defined as group of signals that are uncorrelated to the target scattering characteristics but occupy the same frequency band as the target [1], [4], making it difficult to distinguish between both (signals and clutter) without applying proper signal processing techniques. Manuscript received September 17, 2012; revised November 11, 2012. The authors are with the School of Engineering, University of Portsmouth, Portsmouth, PO1 3DJ UK (e-mail:
[email protected]).
DOI: 10.7763/IJIEE.2013.V3.326
GPR System
317
International Journal of Information and Electronics Engineering, Vol. 3, No. 3, May 2013
Using PCA and ICA based algorithms two-dimensional GPR data set can be analyzed and principal components (PCs) or independent components (ICs) extracted from it. In the large number of situations, extracted components can be related to clutter and useful parts of the GPR signal resulting in subspace for reconstruction of a GPR data set containing significantly reduced clutter components. Various researchers have shown interest in subspace techniques including Singular Value Decomposition (SVD) [10], [15], Linear Discriminant Analysis [16], PCA [17], [18], and ICA [1], [17], [19], [20]. The PCA uses a second-order statistics to decompose measured data set into two orthogonal matrices that convey useful information about the main components contained in the data set. PCA also provides a third, diagonal matrix where diagonal elements of this matrix indicate the amount of information (variance) contained in each principal component. This makes it relatively easy to decide which components to discard in the reconstruction process of the GPR image, based on the values of the diagonal elements in this matrix. Components extracted via PCA technique are always orthogonal and therefore nor easily physically interpreted, which can represent a problem in processing results of physical measurements such are GPR data sets. The ICA technique minimizes the statistical dependence between the data and uses higher-order statistics to provide more meaningful information about data. However, components returned by ICA are scaled in amplitude and usually randomly permutated so the task of identifying the “most important” components in the extracted set is not a trivial one. Approach put forward in this work is to use two-dimensional PCA technique (2DPCA) recently proposed as a good substitute for conventional one-dimensional PCA algorithm when a large number of 2D sets are encountered, as it usually is the case in GPR measurements. 2DPCA can improve the accuracy of the estimated principal components of the data set whilst simultaneously reducing the computational requirements. The performance of clutter reduction methods for GPR images are traditionally difficult to evaluate. Many researchers use Peak Signal-to-Noise Ratio (PSNR) to evaluate performance of various image denoising techniques although in GPR, there is no clutter free data set to be used as a reference. To give a better sense of validity and potential advantages of the proposed clutter reduction techniques, in addition to PSNR the Mean Structural Similarity Index M-SSIM Index) has been proposed [21]. PSNR measure is used in this work to evaluate and validate clutter reduction techniques described in this work.
II. PROPOSED 2DPCA AND ICA TECHNIQUES A. One-Dimensional Principal Component Analysis (PCA) Principal component analysis (PCA) [22] is a technique to reduce dimensionality of a multivariate dataset by finding the principal components (PCs) with which the given data can be most compactly represented. PCA seeks to find the vectors 318
that best describe the data in a minimum-squared-error sense by transforming the set of correlated variables into a smaller set of uncorrelated variables called principal components (PCs). The first PC from the obtained set accounts for as much variability in the original set as possible, the next component accounts for most of the remaining variability in the set and so on. Assuming that most of the clutter information is contained in the small number of extracted PCs, discarding those components can result in a significant reduction of clutter in the GPR image. In practice, the principal components of matrix X can be obtained via SVD which decomposes X into three new matrices:
X = UΣV T
(1)
Here:
U is an m × n orthonormal matrix (i.e. U T U = I ), V is an n × n orthonormal matrix (i.e. U T U = I ), and Σ is an n × n diagonal matrix (i.e. Σ = diag {σ1 , σ 2 ,..., σ n } ). Elements of matrix Σ are non-negative values, known as the singular values of X , whereas the columns of matrices U and rows of matrix V represent the eigenvectors of T
T
matrices XX and X X respectively. Eigenvalues for the eigenvectors in U and V are the elements of diagonal , i.e. Σ2 2 2 2 2 Σ = diag {λ1 , λ2 ,..., λn } = diag {σ 1 , σ 2 ,..., σ n } . matrix
The amount of variance contained in each eigenvector from U and V is directly related to the corresponding 2
eigenvalue fromΣ . Singular values in Σ can be sorted in descending order and the corresponding eigenvectors in U and V reordered in the same way. Denoting the reordered matrices with Σˆ , Uˆ and Vˆ reconstruction of data from matrix X can be accomplished via the modified SVD equation:
ˆ ˆ Vˆ T X rec = UΣ k
(2)
Here Σˆ k represents reordered diagonal matrix with
n − k diagonal elements set to zero, thus multiplication given by (2) effectively rejects last n − k eigenvectors from Uˆ (columns) and Vˆ (rows). Reconstructed data set X rec now contains most of the features from the original matrix having lost the details contained in the last n − k eigenvectors. Decluttering of GPR images requires somewhat reverse reasoning. For GPR images where clutter or other non-target related signals usually dominate the GPR image, most of this information is contained in the first few eigenvectors from U . It is therefore possible to reduce the amount of clutter for the SVD-reconstructed image by setting a couple of largest singular values from diagonal matrix, Σ to zero.
International Journal of Information and Electronics Engineering, Vol. 3, No. 3, May 2013
2DPCA technique, decluttering procedure is performed in the same way as in the case of one-dimensional PCA. In this work, 2DPCA has been performed using a set of GPR images obtained during the same measurement session thus most of the images have been affected with approximately similar type of interference unevenly spread across the images.
This approach can also be recast in terms of superposition of individual eigenimages of the original GPR image X . Each eigenimage [23] Ei is obtained by multiplying a single row from matrix U , ui with the corresponding but transposed row from matrix V , viT :
Ei = ui viT
C. Independent Component Analysis (ICA) Both PCA approaches discussed in the previous sections result in the mutually orthogonal set of eigenvectors which makes it difficult to interpret or assign any physical meaning to the individual components. Although PCs are decorrelated, they still represent a linear combination of independent variables from the original data set. This inability to make extracted components independent of each other provides the motivation to try and use an alternative methodology known as independent component analysis (ICA) for further improvement of PCA decluttering of GPR images. The goal of ICA is to minimize the statistical dependence between the new vectors, called independent components (ICs). ICA has been introduced in many applications such as brain imaging, econometrics, feature extraction [27], acoustical signal processing, edge detection, and face recognition [28]. It is a computational method for revealing hidden factors that underlie the sets of measurements or signals. The most significant computational difference between ICA and PCA is that PCA uses only second-order statistics whereas ICA uses higher-order statistics. Restricting the analysis to use only second-order statistics gives satisfactory results for signals with a Gaussian distribution where statistical moments above second-order are zero. However, the majority of signals measured in nature (natural signals), do not have a Gaussian distribution and do have higher-order moments. This property is exploited by ICA as it assumes the statistical independence and non-Gaussian nature of original signal components [17]. The subspace formed by ICA is therefore not orthogonal as is the case with components extracted by PCA. In addition to that, extracted ICs are truly statistical independent [18]. The mathematical model for ICA, assuming the same structure of data matrix X as in the PCA case can be written succinctly as:
(3)
The contribution of each eigenimage to the original dataset is described by the corresponding singular value from Σ . The original GPR image is then easily obtained by scaling and adding all eigenimages, where the scaling factor for each eigenimage is the corresponding singular value from Σ . Thus, by discarding the strongest k eigenimages from the measured GPR image, a significant amount of dominant interference in GPR image can be removed: n
X rec = ∑ σ i Ei
(4)
i=k
B. Two-Dimensional Principal Component Analysis (2DPCA) One-dimensional PCA can also be performed on the group of images or other two-dimensional data sets. The traditional approach is to turn each of the 2D data sets into a 1D sequence by placing each column of the individual image below the previous one and then generating a new 2D data set by placing each “column image” into a new data matrix. One-dimensional PCA via SVD is then performed on this new data set. Recently, an extension of PCA, called two-dimensional PCA (2DPCA) [24] has been developed in order to address some shortcomings of this traditional way that one-dimensional PCA is performed on two-dimensional data sets. 2DPCA starts by computing a new, 2D data matrix:
H=
1 m ∑( Xi - μ) m i=1
(5)
Here X i represents the i-th image or some other two-dimensional data set from the group of m such images and μ refers to the average of all images in the set, calculated as:
μ=
1 m
m
∑X
i
X = SA
(6)
i=1
The principal components are then computed in the usual way using SVD of data matrix H . This approach has been used in some image recognition tasks and has been reported to provide a higher recognition rate with a smaller computational complexity compared to one-dimensional PCA [25]. Detailed analysis of this approach has also been performed [26]. In this paper, the 2DPCA approach has been used to remove clutter and other types of strong interference from the set of GPR images obtained in the same measurement session, under the assumption that the first k PCs for each collected image contain most of the unwanted information contained in all images from the group. Once the PCs are obtained using 319
(7)
where m × n matrix S now represents the matrix containing n original source signals as its columns and A is the n × n mixing matrix. Matrix X is therefore represents a set of n mixtures of original signals contained in S and element aij from the mixing matrix A specifies the contribution of the j-th source signal (column) from S to j-th mixture (column) of X . The ICA algorithm estimates the mixing matrix A , so the ICs, i.e. columns of matrix S can be obtained by multiplying the mixture matrix X with the inverse of estimated mixing matrix A
S = XA-1
(8)
The ICA technique can in analogy to PCA be reconsidered in terms of “independent” images, where i-th independent
International Journal of Information and Electronics Engineering, Vol. 3, No. 3, May 2013
image of the original GPR image X , can be obtained by multiplying the i-th column from S , si with the i-th row, from the mixing matrix
IV. RESULTS Obtained results and effects of applied processing techniques are illustrated using the GPR image corresponding to “left to right” scan directly across the centers of all three pipe samples in the box (line 7 of the measurement grid). GPR images made with empty box and box containing all three pipes are shown in Fig. 3. Mean trace was calculated and removed from both images before applying to any other processing to reduce the amount of clutter corresponding to air-wooden panel interface present in both images.
A , aiT : I i = si aiT
(9)
Original image can now be reconstructed through the addition of all independent images. GPR image with much stronger target information compared to original image can be obtained by rejecting non-target related independent images before reconstruction. One of the problems related to ICA used in this context is that, unlike PCA, there is no direct method to estimate the importance of each extracted independent variable, as can be 2
done in PCA by sorting the eigenvalues in Σ . Although some approaches to automatically order components extracted by ICA procedure have been reported [27], [29], [30], this question remains open in research literature. Thus the visual inspection of obtained independent images has been used in this work to decide which of the independent images represents clutter and other non-target related information in order to reject those images. Some results of this approach are illustrated in the next sections.
(a)
III. EXPERIMENTAL SETUP Aim of conducted experiment was to evaluate the capabilities of 4 GHz ground penetrating radar for detecting and characterizing samples of three PVC pipes of different diameters (10.8 cm, 4.3 cm, and 2.8 cm). The experiment was performed with 127 cm × 127 cm × 26.5 cm open-top wooden box to carry out 2 different sets of measurements, with empty box and box containing three pipes. The content of the constructed wooden box was scanned by placing 2 cm thick wooden panel on the top of the box and scans along the 10 cm grid drawn on the top panel performed. Fig. 2 shows the setup and GPR used in the experiment.
(b) Fig. 3. GPR images with removed mean trace (a) empty box and (b) box containing three plastic pipes.
Whilst the emergence of two hyperbolas corresponding to big (10.8 cm) and medium (4.3 cm) diameter pipes can be observed in Fig. 3(b), the main feature present in both images is the strong signal on the left side indicated with black arrows that caused by the reflection of the EM waves from the left side of the wooden box. Similar feature corresponding to the reflection from the right side of the box (white arrows) can be observed on the right side of the image, although it is slightly weaker due to larger distance between the end of the scanned line and right side of the wooden box. Both side reflections are the strongest features in the image and as such they heavily obscure the hyperbolas corresponding to plastic pipes to be detected and characterized. The aim of further processing, using techniques developed in this work and described in Section II is to try and reduce those features in the image without significantly affecting the content of the remaining image, thus making the hyperbolas related to the three pipes in the box more prominent in the final, processed image. The two techniques, 2DPCA and ICA described in the
(a)
(b) Fig. 2. (a) Experimental setup and GPR equipment used in the experiment and (b) top panel with 10 cm grid lines
320
International Journal of Information and Electronics Engineering, Vol. 3, No. 3, May 2013
and improvement of features corresponding to pipes placed in the box. Results of side reflections removal using both approaches are shown in Fig. 6. Both techniques can be seen helped in removing significant amount of unwanted features from the original image. Hyperbolas caused by the reflections from the largest and middle size pipes can now be seen much more clearly in both images in Fig. 6. In addition to that a weak hyperbola feature indicating the presence of the smallest pipe in the box can also be observed.
previous section have been employed to remove the unwanted side reflections from the image in Fig. 3(b). Images obtained by scanning along the lines 2-7 (in left-right direction) of the measurement grid have been used as input images to both algorithms. Spectrum of eigenvalues obtained after 2DPCA is shown in Fig. 4 indicating that the most of the image energy is concentrated in first 5-10 eigenimages. The side reflections were removed by adding the first 6 eigenimages to be subtracted from the original image shown in Fig. 3(b). Cumulative image containing first 6 eigenimages obtained using 2DPCA decomposition is shown in Fig. 5(a).
(a) Fig. 4. Eigenvalues spectrum of principal components obtained using 2DPCA procedure
(b) (a)
(c) Fig. 6. Side reflection removal results (a) 2DPCA, (b) ICA with first independent component, and (c) ICA with forth independent component algorithms
(b) Fig. 5. Reconstructed side reflection using (a) 2DPCA eigenimages 1-6 and (b) first independent component obtained using ICA
Performance of both algorithms for images measured in described experiment is summarized in Table I. Here, both images from Fig. 6, i.e. GPR images side reflections removed using 2DPCA and ICA algorithms are compared to original, raw image, in terms of Peak Signal-to-Noise Ratio (PSNR). Adding to that, due to the lack of well established method of selecting and ranking obtained independent components, one more independent image corresponding to forth independent
Fig. 5(b) shows the first independent image, result of ICA unmixing procedure. This image has been identified to contain most of unwanted features by visual inspection of 6 independent images obtained using ICA as described in Section II. Again, as in 2DPCA procedure, this image is subtracted from the original image to achieve the same aim – removal of the side reflections present in the original image 321
International Journal of Information and Electronics Engineering, Vol. 3, No. 3, May 2013 [6]
component was also selected and analyzed using PSNR. The bottom field labeled “Difference” in Table I indicates the PSNR between the raw image and image obtained using direct subtraction (i.e. subtraction of the image containing three pipes to the image of empty box).
[7]
[8]
TABLE I: COMPARISON BETWEEN ALGORITHMS USING PSNR MEASURE Technique 2DPCA
Three pipes 68.4099
Medium pipe 72.3316
Small pipe 72.0578
68.9848
Big pipe 76.5616 69.4238
ICA (IC#1)
68.1856
68.5401
ICA (IC#4)
65.1146
71.8035
64.0912
64.1066
Difference
67.2506
73.0187
70.1352
66.6435
[9]
[10]
The idea of using the “Difference” approach is that the “empty” image containing only interference features can be subtracted from the measured image resulting in significantly improved GPR image. Although this “technique” can not be applied in practical situations as the interference-only image is never available, “Difference” approach was used in this work to compare and evaluate the other two techniques. Similar set of experiments has also been performed by placing each of the pipes used in this experiment in the box on its own and repeating the whole procedure. Those results are summarized in the last three columns of Table I. In the situations where degraded image can be compared to original, undistorted image, high PSNR value indicates high similarity between the original and distorted image, i.e. low level of noise in the distorted image. In this work however, undistorted image is not available so processed images can only be compared to original, distorted image. Low PSNR value should therefore indicate “better” algorithm performance as this would imply increase in RMS difference between the raw and processed images. However, the large RMS difference between the original and processed image might also imply that some of the important, target related features in the raw image are not very well preserved. Lowest PSNR figures for ICA algorithm from Table I somewhat contradict the visual inspection of the processed images which indicates that the other two algorithms – 2DPCA and “Difference” perform just as well, if not better than the ICA algorithm. This highlights the need for further research into methods and techniques for the evaluation of image denoising algorithms where no ideal, undistorted image is available to assess the performance of each image processing technique.
[11]
[12]
[13]
[14]
[15]
[16]
[17]
[18]
[19]
[20] [21]
REFERENCES [1] [2] [3] [4] [5]
A. Zhao, Y. Jiang, and W. Wang, "Exploring Independent Component Analysis for GPR Signal Processing," in Progress in Electromagnetics Research Symposium, Hangzhou, China, 2005, pp. 1-4. A. Alani and V. Utsi, "Preliminary Investigation of Detection of Leakage from Joints and Cracks in Water Reservoirs Using Ground Penetrating Radar," University of Portsmouth, Portsmouth2007. D. J. Daniels, Ground penetrating radar, 2nd ed. London: Institution of Electrical Engineers, 2004. D. J. Daniels, "Surface-penetrating radar," Electronics & Communication Engineering Journal, vol. 8, pp. 165-182, Aug 1996. R. Forest and V. Utsi, "Non destructive crack depth measurements with ground penetrating radar," in Proceedings of the Tenth International Conference on Ground Penetrating Radar, Delft, Netherlands, 2004, pp. 799-802.
[22] [23] [24] [25]
[26]
322
L. Orlando, "Using GPR to Monitor Cracks in a Historical Building," in Proc. of 4th International Workshop on Advanced Ground Penetrating Radar, 2007, pp. 45-48. S. Yehia, O. Abudayyeh, S. Nabulsi, and I. Abdelqader, "Detection of Common Defects in Concrete Bridge Decks Using Nondestructive Evaluation Techniques," Journal of Bridge Engineering, vol. 12, pp. 215-225, 2007. J. W. Brooks, "The Detection of Buried Non-Metallic Anti-Personnel Land Mines," Doctor of Philosophy Ph. D. Dissertation, Department of Electrical and Computer Engineering, University of Alabama, Huntsville, 2000. G. Nadim, "Clutter reduction and detection of landmine objects in ground penetrating radar data using likelihood method," in Proc. of 2008 3rd International Symposium on Communications, Control and Signal Processing, Vols 1-3, pp. 98-106, 2008. F. Abujarad, A. Jostingmeier, and A. S. Omar, "Clutter removal for landmine using different signal processing techniques," in Proceedings of the Tenth International Conference on Ground Penetrating Radar, Vols 1 and 2, pp. 697-700, 2004. D. Potin, E. Duflos, and P. Vanheeghe, "Landmines ground-penetrating radar signal enhancement by digital filtering," in Proc. of IEEE Transactions on Geoscience and Remote Sensing, vol. 44, pp. 2393-2406, Sep 2006. L. V. Kempen and H. Sahli, "Signal Processing Techniques for Clutter Parameters Estimation and Clutter Removal in GPR Data for Landmine Detection," in Proc. of 2001 IEEE Workshop on Statistical Signal Processing Proceedings, pp. 158-161, 2001. A. V. D. Merwe and I. J. Gupta, "A novel signal processing technique for clutter reduction in CPR measurements of small, shallow land mines," in Proc. of IEEE Transactions on Geoscience and Remote Sensing, vol. 38, pp. 2627-2637, Nov 2000. A. M. Zoubir, I. J. Chant, C. L. Brown, B. Barkat, and C. Abeynayake, "Signal processing techniques for landmine detection using impulse ground penetrating radar," IEEE on Sensors Journal, vol. 2, pp. 41-51, 2002. F. Abujarad, G. Nadim, and A. Omar, "Clutter reduction and detection of landmine objects in ground penetrating radar data using Singular Value Decomposition (SVD)," in Proceedings of the 3rd International Workshop on Advanced Ground Penetrating Radar, pp. 37-41, 2005. P. N. Belhumeur, J. P. Hespanha, and D. J. Kriegman, "Eigenfaces vs. Fisherfaces:Recognition using class specific linear projection," Pattern Analysis and Machine Intelligence, IEEE Transactions on, vol. 19, pp. 711-720, 1997. F. Abujarad and A. Omar, "GPR data processing using the component-separation methods PCA and ICA," in Proceedings of the 2006 IEEE International Workshop on Imaging Systems and Techniques, pp. 59-63, 2006. B. Karlsen, J. Larsen, H. B. D. Sorensen, and K. B. Jakobsen, "Comparison of PCA and ICA based clutter reduction in GPR systems for anti-personal landmine detection," in Proc. of 2001 IEEE Workshop on Statistical Signal Processing Proceedings, pp. 146-149, 2001. B. Karlsen, H. B. D. Sorensen, J. Larsen, and K. B. Jakobsen, "Independent component analysis for clutter reduction in Ground Penetrating Radar data," in Proc. of Detection and Remediation Technologies for Mines and Minelike Targets Vii, Pts 1 and 2, vol. 4742, pp. 378-389, 2002. Q. Gao, T. Li, and R. B. Wu, "A novel KICA method for ground bounce removal with GPR," in Proceedings of 2006 CIE International Conference on Radar, Vols 1 and 2, pp. 1058-1061, 2006. Z. Wang, A. C. Bovik, H. R. Sheikh, and E. P. Simoncelli, "Image quality assessment: from error visibility to structural similarity," in Proc. of IEEE Transactions on Image Processing, vol. 13, pp. 600-612, 2004. R. O. Duda, P. E. Hart, and D. G. Stork, Pattern classification, 2nd ed. New York ; Chichester: Wiley, 2001. T. J. Ulrych and M. D. Sacchi, Information-based inversion and processing with applications, Amsterdam; London: Elsevier, 2005. H. Kong et al., "Generalized 2D principal component analysis," in Proc. of IEEE International Joint Conference on Neural Networks, 2005, pp. 108-113. J. Yang, D. Zhang, A. F. Frangi, and J. Y. Yang, "Two-dimensional PCA: a new approach to appearance-based face representation and recognition," in Proc. of IEEE Transactions on Pattern Analysis and Machine Intelligence, vol. 26, pp. 131-137, 2004. L. W. Wang, X. Wang, M. Chang, and J. F. Feng, "Is Two-dimensional PCA a New Technique," Acta Automatica Sinica, vol. 31, pp. 2-7, September 2005 2005.
International Journal of Information and Electronics Engineering, Vol. 3, No. 3, May 2013 [27] A. Hyvärinen, J. Karhunen, and E. Oja, "Independent component analysis," Adaptive and Learning Systems for Signal Processing, Communications, and Control, vol. 1, 2001. [28] A. Hyvärinen and E. Oja, "Independent component analysis: algorithms and applications," Neural Networks, vol. 13, pp. 411-430, 2000. [29] A. D. Back and T. P. Trappenberg, "Input variable selection using independent component analysis," in Proc. of International Joint Conference on Neural Networks, vol. 2, pp. 989-992, 1999. [30] Y. Cheung and L. Xu, "Independent component ordering in ICA time series analysis," Neurocomputing, vol. 41, pp. 145-152, 2001.
Nurul Bostanudin was born in Malaysia in 1985. She received her Bachelor degree in Electronic and Electrical Engineering and her MSc degree in Electronic Engineering from the University of Portsmouth, UK in 2007 and 2008 respectively. She is currently studying towards her PhD at the University of Portsmouth, School of Engineering. Her research interests are in image processing and pattern recognition for ground penetrating radar signals. Hizrin Hidzir was born in Malaysia in December 1983. She received diploma in electronic engineering (communication) from the University Technology of Malaysia, Kuala Lumpur, Malaysia, in 2004 and the Bachelor degree in Electronic and Electrical Engineering and the MSc degree in Electronic Engineering, both from the University of Portsmouth, United Kingdom, in 2006 and 2007, respectively. She is currently a research student at the University of Portsmouth. Previously, she worked as a Tutor in the Faculty of Engineering at the Universiti Pertahanan Nasional Malaysia, Sungai Besi, Malaysia. Her current research interests are in signal processing techniques for ground penetrating radar data
Branislav Vuksanovic was born in Osijek, Croatia in 1962. He graduated from the University of Belgrade, Serbia with degree in Electrical and Power Engineering. He holds MSc degree in Measurement and Instrumentation from South Bank University, London and a PhD in Active Noise Control from the University of Huddersfield, UK. Previously, he worked as a Project Engineer for Croatian Electricity Board in Osijek, Croatia. During his academic career he worked as a Research Fellow at Sheffield and Birmingham Universities on Optical Brain Imaging and Medical Video Compression projects. He also worked as a Lecturer at the University of Derby where he was a member of Sensors and Controls Research Group. Currently he works as a Senior Lecturer at the University of Portsmouth, School of Engineering. He has published papers in the field of active noise control, biomedical signal processing and pattern recognition for intrusion detection and knowledge based authentication. He published one book in Digital Electronics and Microcontrollers field. Dr Branislav Vuksanovic is a member of IET, ILT and IACSIT. His current research interests are in the application of pattern recognition techniques for power systems and analysis of ground penetrating radar and ECG data.
Hassan Parchizadeh was born in 1957 in Abadan, Iran. He gained his first degree in Electronics in 1983 and MSc degree in Electronic Systems both from Cardiff University, UK. Currently, he works as a Principal Lecturer at the University of Portsmouth, UK. His interests are in digital and analog electronics and signal processing. He is author of 3 books in digital electronics and microprocessors, one solution manual and another book chapter. He is a member of IET and CENG.
323