10:15. 0. Following [9], we use pattern tableaux to encode subsets of a relation. .... there appears to have been a problem on Saturday night that af- fected all ...
Discovering Pattern Tableaux for Data Quality Analysis: a Case Study Lukasz Golab, Flip Korn and Divesh Srivastava AT&T Labs - Research 180 Park Avenue, Florham Park, NJ, 07932, USA {lgolab,
flip, divesh}@research.att.com
ABSTRACT In this paper, we present a case study that illustrates the utility of pattern tableau discovery for data quality analysis. Given a usersupplied integrity constraint, such as a boolean predicate expected to be satisfied by every tuple, a functional dependency, or an inclusion dependency, a pattern tableau is a concise summary of subsets of the data that satisfy or fail the constraint. We describe Data Auditor—our system for automatic tableau discovery from data—and we give real-life examples of characterizing data quality in a network monitoring database used by a large Internet Service Provider.
1.
INTRODUCTION
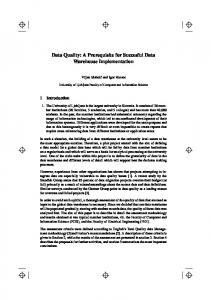
This paper presents a case study of pattern-tableau-driven data quality analysis. Given a user-supplied constraint over one or more relations, the goal of this type of analysis is to automatically generate a concise and easy-to-understand summary of tuples that satisfy or fail the constraint (rather than simply listing all the satisfying and violating tuples, which may not be easy to interpret by the user and may not reveal any interesting patterns in the data). The produced summaries, referred to as pattern tableaux, specify attribute values that most (but not necessarily all) satisfying or violating tuples have in common. We will motivate and describe various types of useful constraints, give a brief overview of the Data Auditor tool for automatic tableau generation from data [14], and show the utility of our approach on a network monitoring database used by a large Internet Service Provider (ISP). While our approach is applicable to any type of data, this case study focuses on monitoring databases, which maintain information about computer systems such as IP networks, Web servers, sensor networks, or cloud computing clusters. We illustrate a network monitoring example in Figure 1. For the purposes of this paper, a network consists of routers, each having at least one interface, and links that connect pairs of interfaces. A network monitoring database contains configuration tables that describe the devices in the network and their properties (IP address, location, date of deployment in the network, router type, model and operating system version, link capacity, etc.). Configuration tables may change ev-
Permission to make digital or hard copies of all or part of this work for personal or classroom use is granted without fee provided that copies are not made or distributed for profit or commercial advantage and that copies bear this notice and the full citation on the first page. To copy otherwise, to republish, to post on servers or to redistribute to lists, requires prior specific permission and/or a fee. This article was presented at: the 9th International Workshop on Quality in Databases (QDB) 2011. Copyright 2011.
Link
Network Poll request
Router Poll response
Poller
Monitoring Database
CPU usage, memory usage, bandwidth usage, etc.
Poller
Poller
Data Auditor
Figure 1: A network monitoring database.
ery day, as new equipment is added, existing equipment moved or upgraded, and obsolete equipment turned off. Additionally, measurement tables are associated with the equipment being monitored, among them system logs, user trouble tickets, router CPU and memory usage statistics, and bandwidth usage reports. Measurement tables are updated (appended to) by a polling mechanism that collects data from the network. In a large network, the polling may be done by a set of distributed pollers. Monitoring databases are prone to traditional data quality issues such as data entry errors (e.g., incorrect specifications entered for a new piece of equipment) and duplicates (e.g., different configuration entries for the same router). Additionally, malfunctioning devices may generate incorrect measurements or fail to respond to polls. In fact, even healthy devices may have incorrectly configured firewalls that block incoming poll requests. The polling mechanism and the network itself may also cause data quality problems: some devices may not be polled or may be polled too often by multiple pollers, poll requests and/or responses may be lost, etc. As a result, measurement tables may suffer from incorrect, missing, duplicate and delayed data. Monitoring databases serve important business functions: troubleshooting customer problems, analyzing equipment failures, de-
tecting malicious users, planning system upgrades, etc. In this paper, we show that generating pattern tableaux for user-specified integrity constraints is a useful technique for understanding monitoring data and characterizing its quality. We also show that tableaudriven data quality analysis can help diagnose “process quality” problems with the polling mechanism and problems with the network itself. The remainder of this paper is organized as follows. Section 2 describes the types of constraints supported by our Data Auditor tool and the tableau generation algorithm. In Section 3, we demonstrate the utility of tableau-driven data quality analysis on a network monitoring database used by a large ISP. Section 4 discusses related work and Section 5 concludes the paper.
2. 2.1
OVERVIEW OF DATA AUDITOR Supported Constraints
Data Auditor supports constraints of the form ∀t ∈ R, c → p. In this paper, we will use the following SQL-like syntax to express such constraints: FOREACH t in R [WHERE c] ASSERT p Here, t is a tuple, R is a relation, and c and p are predicates of any form allowed in the SQL WHERE clause. In a data warehouse setting, R may be a “base” table or a complex materialized view defined over one more more tables (or other views). The “WHERE c” part is optional. For example, it is reasonable to assume that every CPU utilization poll in the ROUTER_CPU measurement table must have a value between zero and 100; violations may be caused by bugs in the router operating system function that records CPU usage: FOREACH t IN ROUTER_CPU ASSERT t.cpu_util >= 0 AND t.cpu_util = t.timestamp AND u.timestamp - t.timestamp 0 In our example from Table 1, the confidence of this constraint is 10 , which indicates that, on average, 62 percent of the expected 16 CPU polls (in terms of the five-minute time intervals with at least one poll) are there and 38 percent are missing.
2.3
Pattern Tableaux
Real data, especially monitoring data collected from a diverse system, are heterogeneous. In our network monitoring example, routers from different locations may be missing different fractions of polls, and any given router may behave differently over time. Therefore, in addition to reporting the confidence on the entire relation, it is useful to identify parts of the relation that satisfy the constraint (i.e., have high confidence) and parts that violate it (i.e., have low confidence). The idea behind tableau-driven data quality analysis (and Data Auditor) is to compactly summarize this valuable information.
Table 1: Example ROUTER CPU COUNTS table name router1 router2 router3 router4 router1 router2 router3 router4 router1 router2 router3 router4 router1 router2 router3 router4
location New York New York Chicago Chicago New York New York Chicago Chicago New York New York Chicago Chicago New York New York Chicago Chicago
time 10:00 10:00 10:00 10:00 10:05 10:05 10:05 10:05 10:10 10:10 10:10 10:10 10:15 10:15 10:15 10:15
num polls 0 0 1 1 1 0 1 1 1 1 1 1 0 1 0 0
Following [9], we use pattern tableaux to encode subsets of a relation. Consider a set A = a1 , a2 , . . . , a` of conditioning attributes, chosen from amongst the attributes in the relation. A pattern tableau consists of a set of patterns over A, each containing ` symbols, one for each conditioning attribute. Each symbol is either a value in the corresponding attribute’s domain or a special “wildcard” symbol ’-’. Let pi [aj ] denote the symbol corresponding to the jth conditioning attribute of the ith pattern, and let t[aj ] be the value of the jth attribute of a tuple t. A tuple t is said to match a pattern pi if, for each aj in A, either pi [aj ] = ’-’ or t[aj ] = pi [aj ]. The confidence of a pattern pi is defined as the confidence of a sub-relation containing only those tuples that match pi . Note that the pattern consisting of only the ’-’ symbols matches the entire relation. The input to Data Auditor is a relation R (again, R could be a complex materialized view), a constraint (of the supported type), a set of conditioning attributes A (where A ⊆ R), a positive integer k, and a fraction cˆ, which is either a lower or an upper bound on the confidence of each tableau pattern on R. The output is a tableau over A with at most k patterns, each of which has a confidence of at least or at most cˆ, depending on the intended meaning of cˆ. As in [15], we refer to the former as a hold tableau since it summarizes subsets on which the constraint holds, and the latter as a fail tableau, which detects subsets on which the constraint fails. The tableau construction step uses a generalized version of the on-demand algorithm from [15], which was originally proposed to generate tableaux only for FDs. Data Auditor first pre-computes the confidence and the number of matching tuples for each pattern that contains no wildcards (which can then be used to compute the confidence of patterns with wildcards). Each iteration of the algorithm then inserts into the tableau a pattern that (meets the required confidence threshold and) matches the most tuples that have not already been matched. This greedy heuristic attempts to produce the smallest possible tableau (having the fewest patterns) that matches the largest possible fraction of the relation. Thus, general patterns with wildcards are more likely to be included (provided that they have the appropriate confidence) than specific patterns that match a small fraction of the data. Recall the ROUTER_CPU_COUNTS relation from Table 1. Suppose that A = {name, location, time}, cˆ is an upper
Table 2: Tableau for ROUTER CPU COUNTS name router2
location New York -
time 10:15 10:00 10:05
conf. 0.25 0 0
matches 4 2 1
bound of 0.25, and k = 5. Table 2 shows a fail tableau for the following constraint, along with the confidence of each pattern and the number of tuples that match it (note the syntax for specifying the conditioning attributes, confidence, and maximum tableau size): FOREACH t IN ROUTER_CPU_COUNTS ASSERT t.num_polls > 0 TABLEAU t.name, t.location, t.time CONF 0. As a result, this fail tableau is a useful tool for summarizing the “worst offenders” of a constraint, and is easier to interpret than a (possibly very long) list of all violations. In fact, one can generate several fail tableaux with different CONF parameters to discover subsets with varying degrees of violations. For instance, the last two patterns in Table 2 represent subsets that are missing every poll (the confidence is zero). Additionally, by changing the CONF specification of the above constraint to, say, >= 0.9, the resulting hold tableau identifies “well behaved” subsets that satisfy the constraint with high confidence. For example, the pattern (- - 10:10) may be identified in such a tableau, which has a confidence of one since no polls were missing at time 10:10. Also note that tableau patterns may overlap. The choice of conditioning attributes is crucial to obtaining concise and informative tableaux—some attributes may be irrelevant to the constraint at hand. Fortunately, monitoring databases typically contain timestamp fields, which often produce interesting patterns, as well as attributes that naturally partition the devices being monitored into groups, such as router type or location. In future work, we plan to study automatic selection of conditioning attributes in more detail, e.g., by exploiting attribute correlations. So far, we have discussed tableaux containing patterns with constants drawn from the attribute domains or the wildcard symbol ’-’. Data Auditor also supports range tableaux [15], which, in addition to constants and wildcards, contain patterns with ranges of values of ordered attributes. Here, the definition of matching extends in the obvious way—a tuple matches the pattern if the value of the ordered attribute of the tuple falls within the range. Patterns with ranges often lead to smaller tableaux since a single range pattern may be used instead of separate patterns for different values in the range. In Table 3, we show a tableau for the same constraint as that in Table 2, whose second pattern includes a range on the time attribute. Note that this tableau is smaller than Table 2; the last two 1
Note that the tableau generation algorithm always terminates, either after reaching the maximum tableau size bound, or when it runs out of patterns that meet the confidence threshold.
Table 3: Tableau for ROUTER CPU COUNTS with a range pattern name -
location New York
time 10:15 10:00 till 10:05
conf. 0.25 0.25
matches 4 4
patterns from Table 2 are now captured by a single pattern in Table 3. By default, Data Auditor considers patterns with ranges for each ordered attribute in the conditioning attribute set.
3.
CASE STUDIES
We now present examples of pattern-tableau-driven data quality analysis of a network monitoring database used by a large ISP. This database is maintained using the DataDepot warehouse system [12] and consists of a number of configuration tables, including ROUTERS and INTERFACES. Each router has a name, IP address, class (backbone router, customer router, etc.), location, etc. Each interface resides on a particular router, and has a name, IP address, function, capacity, etc. Measurement tables include ROUTER_CPU (poll responses with average CPU utilization per router per fiveminute time period), ROUTER_MEMORY (likewise for average memory utilization), and many more. We also maintain a number of materialized views, among them ROUTER_CPU_COUNTS and ROUTER_MEMORY_COUNTS, which, similar to Table 1, count the number of polls returned by each router in each possible 5-minute time interval. Again, these views are computed via complex aggregation over the corresponding CPU and MEMORY base tables (in DataDepot, we expressed these views using EMF-SQL [17], which is an extension of SQL that supports complex grouping conditions). In total, this network monitoring database contains over 300 tables and materialized views, and ingests over 300 million new records per day. Due to the proprietary nature of the data, we have anonymized the attribute values shown in the pattern tableaux in this section, and we do not display the number of matching tuples per pattern. Also, for brevity, we do not report any detailed performance results. The running time of the first step (pre-computing the confidence of patterns without wildcards) involves executing group-by aggregation queries on the tables involved in the constraint, and depends on the sizes of these tables. The second step (execution of the tableau generation algorithm) took on the order of one or two minutes at most for each of the examples in this section, when executed on our database application server.
3.1
Table 4: Tableau for missing CPU polls
Missing Polls
We begin by analyzing missing CPU data over a period of one week using the following constraint (from now on, we omit the MAX SIZE clause and display the first few rows of each tableau): FOREACH t IN ROUTER_CPU_COUNTS ASSERT t.num_polls > 0 TABLEAU t.name, t.class, t.hour_of_day, t.time CONF = 0.8 Since the confidence threshold is at least 0.8, the resulting hold tableau denotes patterns where, on average, at least 80 percent of the missing CPU polls are associated with a missing memory poll. In this example, we no longer use hour_of_day as a conditioning attribute as it did not generate any interesting patterns. The tableau is shown in Table 5. It includes the pattern
class backbone -
time Sun 00:00 till Sun 03:00
conf. 0.84 0.82
Table 7: Tableau for duplicate memory polls name newyork-r25 newyork-r31 chicago-r07
class -
time Fri 17:00 till Fri 23:00 Fri 17:00 till Fri 23:00 Fri 17:00 till Fri 23:00
conf. 0.96 0.96 0.98
to memory polls). Also, it appears that the polling mechanism lost CPU polls, but not memory polls, early Sunday morning. For brevity, we omit the results of a similar set of experiments that tests correlations between missing CPU and memory polls in “the other direction”, i.e., checking the existence or absence of a CPU poll given that the corresponding memory poll is missing. Finally, note that Tables 4, 5 and 6 suggest possible causes of missed polls, which can then be verified and corrected by network engineers.
3.3
Duplicate Polls
Missing measurement data is clearly an important data quality problem. Duplicate or extraneous data are also of interest since reporting too many polls puts unnecessary overhead on the devices being monitored and on the monitoring infrastructure. We now investigate extraneous memory polls, defined as occurrences of multiple polls from the same router in the same 5-minute time interval, using the following constraint:
(- - Sat 18:00 till Sat 20:00) as does the tableau in Table 4, suggesting that almost no polls of any kind were collected in this time period. The other patterns reveal that for several router classes, a dropped CPU poll usually co-occurs with a dropped memory poll. Note that the constraint used in this example is not a typical data integrity constraint whose violations can be thought of as “dirty” data. Instead, this is a data exploration constraint that specifies some property of interest (i.e., correlated loss of CPU and memory polls), whose tableau indicates which parts of the relation satisfy the claimed property. Both data integrity and data exploration are important components of data quality analysis. Next, we test the “opposite” constraint, on the same portion of data as before, which asserts that a missed CPU poll is not correlated with a missed memory poll in the same 5-minute time window, i.e., FOREACH t IN ROUTER_CPU_COUNTS WHERE t.num_polls = 0 ASSERT EXISTS ( SELECT * FROM ROUTER_MEMORY_COUNTS u WHERE t.name = u.name AND t.time = u.time AND u.num_polls > 0 ) TABLEAU t.name, t.class, t.time CONF >= 0.8 The hold tableau is illustrated in Table 6. The first pattern suggests that backbone routers do not respond to CPU polls, e.g., due to a firmware bug that blocks CPU poll requests (but they do respond
FOREACH t IN ROUTER_MEMORY_COUNTS ASSERT t.num_polls