Discovering significant rules Geoffrey I. Webb Faculty of Information Technology Monash University Clayton, Vic, Australia
[email protected]
ABSTRACT In many applications, association rules will only be interesting if they represent non-trivial correlations between all constituent items. Numerous techniques have been developed that seek to avoid false discoveries. However, while all provide useful solutions to aspects of this problem, none provides a generic solution that is both flexible enough to accommodate varying definitions of true and false discoveries and powerful enough to provide strict control over the risk of false discoveries. This paper presents generic techniques that allow definitions of true and false discoveries to be specified in terms of arbitrary statistical hypothesis tests and which provide strict control over the experimentwise risk of false discoveries. Categories and Subject Descriptors: H.2.8 [Database Management] Database Applications: data mining General Terms: Algorithms, Performance, Reliability, Experimentation Keywords: Association rules, Rule discovery, Statistics
1.
INTRODUCTION
Association rule discovery [1] finds collections of items that co-occur frequently in data. In many applications, such rules will only be interesting if they represent non-trivial correlations between all constituent items. For the purposes of this paper we will call such associations significant rules and all remaining associations false discoveries. Many techniques have been developed that seek to avoid false discoveries [1, 3, 4, 5, 10, 12, 16, 18, 20, 22, 25, 23, 28, 29]. This paper builds upon this body of previous work, presenting two generic techniques that both allow definitions of true and false discoveries to be specified in terms of arbitrary statistical hypothesis tests, while providing strict control over the risk of false discoveries. We show that each has relative strengths and weaknesses and provide analyses of these. We substantiate the need for strict control over the risk of false discoveries, showing that on some real-world tasks there is
Permission to make digital or hard copies of all or part of this work for personal or classroom use is granted without fee provided that copies are not made or distributed for profit or commercial advantage and that copies bear this notice and the full citation on the first page. To copy otherwise, to republish, to post on servers or to redistribute to lists, requires prior specific permission and/or a fee. KDD’06, August 20–23, 2006, Philadelphia, Pennsylvania, USA. Copyright 2006 ACM 1-59593-339-5/06/0008 ...$5.00.
potential for all ‘discoveries’ to be false unless appropriate safeguards are employed.
2. PROBLEM STATEMENT We consider the problem of finding rules from data D = ht1 , t2 , . . . , tn i, where each transaction or record ti ⊆ I and I = {item1 , item2 , . . . itemm } is the set of items of which transactions are composed. For market-basket data items are atomic forms and for attribute-value data items have the form ai =vi,j where ai represents an attribute and vi,j a value of ai . For attribute value data, no transaction ti , 1 ≤ i ≤ n may contain two items ai =vi,j and ai =vi,k , j 6= k. That is, each transaction may contain at most one value for each attribute. Rules take the form x → y where x ⊂ I and y ∈ I. Note that we limit the consequent y to a single value. While many association rule techniques allow multiple values in the consequent y, the techniques we present generalize directly to multiple-value consequents and a single rule with multiple elements in the consequent can be represented by multiple rules with single elements in the consequent. We are potentially interested in a number of properties of a rule x → y relative to D, and these properties vary from application to application. In this paper we utilize support [1], confidence [1], lift [16] and leverage [22], defined as follows: sup(x → y, D) conf (x → y, D) lif t(x → y, D) lev(x → y, D)
= = = =
|{i : x ⊆ ti ∧ y ∈ ti }| (1) sup(x → y, D) / |{i : x ⊆ ti }| (2) conf (x → y, D) / (|{i : y ∈ ti }| / n)(3) sup(x → y, D) − |{i : x ⊆ ti }| × |{i : y ∈ ti }| / n (4)
Note that the parameters x → y and D will be omitted from these functions where they can be determined from the context. The original association rule task [1] was to find all rules x → y such that sup ≥ minsup and conf ≥ minconf , where minsup and minconf are user-specified constraints. Typically, rules will only be interesting if they represent non-trivial correlations between items. Relatively high values of minsup and minconf usually deliver rules for which x and y are correlated when applied to the sparse data typical of market-basket analysis [20]. However, as will be demonstrated in the experiments below, this is not the case for dense data such as typical attribute-value data. Also, there is a serious problem that x may contain items that are independent of y, and hence potentially misleading. To illustrate this problem consider a rule {pregnant} →
oedema that represents a relationship between pregnancy and oedema. Now consider {pregnant, female} → oedema. Assuming that all cases of pregnancy will be female, this will represent an equally strong correlation to the first rule, but in most contexts redundant rules such as this will not be useful so long as the first rule together with the further rule {pregnant} → female are known. For a different kind of example consider another term dataminer that we will assume is in no way related to oedema. In this case {pregnant, dataminer } → oedema should represent as strong a correlation between the antecedent and consequent as the first rule, the only difference being a reduction in support and random differences in confidence resulting from sampling effects. However, in most contexts unproductive rules such as this will be of no interest so long as the first rule is known. Such redundant and unproductive rules represent rules x → y for which there exists z ∈ x such that P (y | x) = P (y | x\{z}), or, in other words, for which z and y are conditionally independent given x\{z}. Apriori, one might expect there to be very large numbers of unproductive rules, as from every single productive rule x → y many unproductive rules can be generated by inserting into x any arbitrary collections of unrelated items. Note that for the rest of this paper we will assume that the analytic task of interest is to identify positive rules and hence we will regard as false discoveries any negative rules such as {male} → pregnant [confidence=0 .0 ]. This seems a reasonable assumption in the context of rule discovery using a minimum support constraint, as strong, and hence presumably interesting, negative associations will have low support and hence are excluded from consideration by the imposition of a minimum-support constraint. However, the techniques that we advance generalize directly to different definitions of false discoveries, requiring only the use of different constraints and statistical tests.
rules. The only unproductive rules that such a minimumimprovement constraint will fail to reject are those for which random sampling effects happen to result in raised confidence for a rule by chance. However, almost 50% of rules may fall into this category, because confidence is as likely to be raised as lowered through sampling effects and is unlikely to exactly represent the true probability of the consequent given the antecedent unless that probability is 1.0. If the minimum improvement constraint is set high enough to exclude the majority of these cases, it is also likely to exclude many productive rules. An even stronger filter is represented by the use of statistical hypothesis tests, either to test for independence between x and y [10, 17, 18, 29] or to test for unproductive rules [25]. We will focus here on the test for unproductive rules, as it most directly addresses the issue at hand, but the key points also apply to the other approaches. For the sake of computational efficiency this test compares x → y only against the global frequency of y and against each of its immediate generalizations x\{z} → y, where z ∈ x. We do not test against all generalizations as there are 2|x| − 1 of these, and hence for large antecedents the computation would be infeasible. This test rejects a rule x → y if p ≤ α for a Fisher exact test [2] for improvement with respect to any of the rule’s immediate generalizations x\{z} → y and with respect to {} → y. The p value for the test for improvement with respect to an immediate generalization x\{z} → y can be calculated as follows. Let a = |{i : x ⊆ ti ∧ y ∈ ti }| (the support for the rule), b = |{i : x ⊆ ti ∧ y 6∈ ti }| (the number of transactions that contain x but not y), c = |{i : (x\{z}) ⊆ ti ∧ z 6∈ ti ∧ y ∈ ti }| (the number of transactions that contain y and all the x values other than z but not z) and d = |{i : (x\{z}) ⊆ ti ∧ z 6∈ ti ∧ y 6∈ ti }| (the number of transactions that contain all the x values other than z but neither y nor z).
X
min(b,c)
3.
TECHNIQUES FOR FALSE DISCOVERIES
PREVENTING
Clearly it is desirable to avoid false discoveries and numerous techniques have successfully tackled aspects of this problem. Non-redundant rule techniques [3, 28] identify and discard rules such as {pregnant, female} → oedema. Specifically, they discard rules x → y for which ∃z∈x : sup(x → y) = sup(x\{z} → y). A more powerful filter is provided by a minimum improvement constraint [5]. The improvement of rule x → y is defined as imp(x → y) = conf (x → y) − max (conf (z → y)) z⊂x
(5)
It represents the difference between the confidence of a rule and the highest confidence of any of its generalizations. A minimum improvement constraint is justified in contexts where only positive associations are of interest. In that case an association is unlikely to be of interest unless it represents a stronger correlation than any of its generalizations. A redundant rule will have improvement no greater than 0.0, as for it to be redundant it must have a generalization with identical confidence. Thus, a minimum improvement constraint is stronger than a non-redundant rule constraint as it rejects all redundant rules as well as many unproductive
p=
i=0
(a+b)!(c+d)!(a+c)!(b+d)! . (a+b+c+d)!(a+i)!(b−i)!(c−i)!(d+i)!
(6)
Here, q! denotes the factorial of q. By convention α = 0.05 is used. Equation (6) is also used to calculate the p value for the test for improvement with respect to {} → y, using the same a and b, but with c = |{i : x 6⊆ ti ∧ y ∈ ti }| (the number of transactions that contain y but not x) and d = |{i : x 6⊆ ti ∧ y 6∈ ti }| (the number of transactions that contain neither x nor y). The use of this statistical test avoids the problem of setting an appropriate minimum improvement constraint, as it rejects all rules for which there is insufficient evidence that improvement is greater than zero. However, it still suffers from a very serious problem known as the multiple comparisons or multiple tests problem. For each rule considered, the risk of it being accepted if it is not productive is no more than α. Now consider a typical market basket task for which more than 1022 potential rules might be considered. If α = 0.05 and none of these rules is productive it is still possible that as many as 5 × 10²⁰ rules might be accepted. Clearly this is an undesirable state of affairs. An alternative approach is to use shrinkage estimates, or Bayesian smoothing, to provide conservative estimates of the true probability of a set of items [12, 23, 26]. These approaches can be very effective at reducing the overestimates of measures such as support or confidence that can occur for
rules with low support. Their use can reduce type-1 error with respect to minimum support or confidence (or similar) constraints. However, they do not allow for the number of alternative rules under consideration, and hence do not address the multiple tests problem. Nor do they provide a general mechanism for assessing arbitrary criteria for defining false discoveries. One solution that has been proposed is randomization tests [20]. Under this approach the data are randomized to establish the null hypothesis to be tested (for example, that x and y are independent). The rule discovery software is run under multiple such randomizations and settings are identified such that rules would be discovered for no more than α proportion of the runs. If the software is subsequently run on the non-randomized data with these settings the probability that any rule discovered satisfies the null hypothesis is no more than α. Unfortunately, however, this approach does not solve the problem at hand, as it requires that a single randomization of the data establish all null hypotheses that are required. Consider the example of {pregnant, dataminer } → oedema. To be able to reject this rule we would need to randomize the data so as to make dataminer independent of pregnant and oedema while retaining the existing correlations between the latter two values. However, we also need to test whether pregnant is conditionally independent of oedema given dataminer, and for this purpose we need to randomize the data to make pregnant independent of dataminer and oedema while not altering any correlations between this second pair. Clearly it is not possible to perform a single randomization that satisfies both these requirements.
4.
THE WITHIN-SEARCH APPROACH
The classical statistical solution to the multiple tests problem is to employ a procedure such as the well-known Bonferroni adjustment that makes explicit allowance for the number of hypotheses tested and either seeks to control the experimentwise risk of false discoveries (the risk that any false discovery will occur) [14] or the false discovery rate (the expected proportion of discoveries that are false discoveries) [6]. In the current paper we address only control of the experimentwise risk of false discoveries, but it would be straightforward to extend the techniques to control of the false discovery rate by simply substituting an adjustment for the latter in place of the former. The Bonferroni adjustment replaces α in the hypothesis tests with α′ = α/r, where r is the number of tests performed. This ensures that the experimentwise risk of false discoveries is no more than α. This adjustment provides strict control over the experimentwise risk of false discoveries, even if the hypothesis tests are correlated with one another. This feature is important in the association rule discovery context, as many rules considered are likely to be closely related to one another and hence the hypothesis tests applied are likely to be strongly correlated. More powerful alternatives exist to the Bonferroni adjustment [24], such as the Holm procedure [15]. The Holm procedure requires that all hypothesis tests be evaluated and their p values ordered from lowest p1 to highest pr . The adjusted α is then α′ = max(pi : ∀1≤j≤i, pj ≤ α / (r − j + 1)). All such alternatives to the Bonferroni adjustment require that all tests be evaluated before the adjusted significance level is determined. Clearly this is infeasible during associa-
tion rule discovery, as exploration of the large search spaces involved is only feasible if efficient pruning is able to avoid explicit consideration of the majority of rules. Before we can apply a Bonferroni adjustment we need an upper bound on the number of hypothesis tests in the search space. For market-basket data it is straightforward to determine the size of the search space. Recall that m is the total number of items and assume that x must contain at least one item and that there is an upper bound maxx on the number of items it may contain. There are m possible values for y, and for each y value there are m − 1 items from which up to maxx x values are selected.
X
maxx
s=m×
Cim−1
(7)
i=1
where Cim−1 is the number of combinations containing i out of m − 1 items. So, for example, with the Retail dataset, used below, the number of items is 16,470 and hence with x limited to no more than 5 items the size of the rule space is 1.66 × 10²³ . For attribute-value data the situation is a little more complex, as no rule containing more than one item for a single attribute can be productive. Examples of such rules include {sex =male, sex =female} → occupation=dataminer and {sex =male, occupation=dataminer } → sex =female. A tighter bound can be calculated if all such rules are excluded from the calculation. To calculate the total s we must first be able to calculate the number of combinations of values of a given subset of i attributes, atts. To do so we first order the attributes in arbitrary order from 1 to i and refer to the individual attributes using this order as att1 . . . atti . We use intermediate values catt,j,k that each represent the total number of combinations of up to j items, where items contain only values for attributes att1 . . . attk .
8 > k, < #att 0, catt,j,k = + #attk , > : ccatt,1,k−1 att,j,k−1 + #attk × catt,j−1,k−1 ,
j = 1, k = 1 j > 1, k = 1 j = 1, k > 1 otherwise (8) where #attj is the number of values for attribute attj . An upper bound on the number of hypothesis tests in the search space can then be calculated as follows, where each z represents the use of an attribute in the role of consequent. s=
X z∈a
X
!
maxx
#z ×
ca\{z},m,j
(9)
j=1
It is possible that the Bonferroni adjustment has been overlooked by the association rule discovery community because it has been assumed that the required adjustments are so large that the resulting adjusted significance levels (for example α′ = 0.05 / 1.66 × 1023 = 3.01 × 10⁻²⁵ ) will be so low that no rules will be discovered. However, as this paper will show, this turns out not to be the case. This approach is called a within-search approach, as statistical tests, with an appropriate Bonferroni adjustment, are applied to rules as they are encountered during the search process.
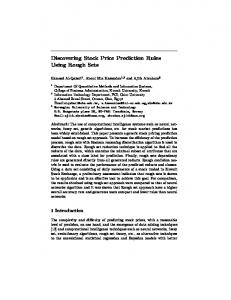
5. HOLDOUT EVALUATION Before investigating the application of a within-search Bonferroni adjustment to find significant rules, we should
Exploratory Data .. .. Data ....... ....................................................
Exploratory Rule Discovery
................... . ...................................
Holdout ........ Data ....... ...........................................
Statistical Evaluation
Candidate Rules Significant Rules
Figure 1: Holdout evaluation process also consider another alternative. Rather than applying statistical tests during the rule discovery process, we could partition our data into exploratory and holdout sets, discover candidate rules using the exploratory data and then test those rules using the holdout data, accepting only those rules that pass relevant statistical tests for significance. This process is illustrated in Figure 1. It will be necessary to correct for multiple tests, but only with respect to the number of rules found in the exploratory stage, not the full size of the search space considered. As the former is likely to be much smaller than the latter, the adjustment will be much smaller. Further, because only a constrained number of rules will be tested, it becomes feasible to employ a more powerful alternative to the Bonferroni adjustment, such as the Holm procedure. Note that, unlike most similar procedures, the Holm procedure is also safe in the face of correlated hypothesis tests. If it were desired to control the false discovery rate rather than the experimentwise risk of error, the BenjaminiYekutieli procedure [7], which is likewise safe, could also be used. The use of holdout evaluation in this way is similar to established holdout evaluation methodology in machine learning, except that whereas it is used there to obtain unbiased estimates of properties of a single model, such as its error, here it is being used to perform unbiased hypothesis tests on multiple models. There are a number of reasons to believe apriori that holdout evaluation might be more powerful than applying a Bonferroni adjustment during rule discovery. First, more powerful adjustments such as the Holm procedure can be applied. Second, the scale of the adjustments should be far smaller, as there should be far fewer rules discovered than there are rules in the search space. For example, if 10,000 rules are found then the adjusted significance level for a Bonferroni adjustment would be 5.00 × 10⁻⁶ , irrespective of the size of the search space from which the 10,000 rules were discovered. On the other hand, however, the power of the tests must be reduced by the use of less data both for the initial rule discovery and also for the statistical tests.
6.
EXPERIMENTS These experiments seek to answer the following questions: 1. Is there a need for significance tests during association rule discovery? 2. Do the within-search and holdout-evaluation processes successfully limit false discoveries in practice? 3. How powerful are the within-search and holdoutevaluation processes? That is, what is the risk that they will fail to find true rules?
4. How do the techniques perform on real-world data? A pre-release of version 3.1 of the well-known Magnum Opus rule discovery software was employed [26]. This software implements k-optimal rule discovery [27], whereby the user specifies a maximum number of rules to be discovered k together with a measure to optimize such as support, confidence, lift or leverage and any other constraints to impose, such as that the rules must be non-redundant or productive. It also supports the application of a Fisher exact test as described in Section 4 and holdout-evaluation. Using this software the within-search technique can be evaluated simply by calculating and imposing the appropriate adjusted significance level.
6.1 Experiment 1 The first experiment sought to investigate questions 1 and 2. Random data were generated containing 10,000 transactions, each containing values for 100 binary variables, with each value being equiprobable. As each value was generated randomly without reference to any other variable, all variables are independent of one another and all rules are false discoveries. 100 such data sets were generated. Magnum Opus was applied to each data set using each of the following set of parameters. Non-redundant: find the 1000 non-redundant rules with the highest leverage. Productive: find the 1000 productive rules with the highest leverage. Significance=0.05: find the 1000 rules with the highest leverage that pass a significance test at the 0.05 significance level. Bonferroni: find the 1000 rules that pass a significance test at the 1.77 × 10−08 significance level that results from applying a Bonferroni correction to a raw significance level of 0.05 with a search space of 2.82 × 1006 rules. Non-redundant+holdout: find the 1000 non-redundant rules with the highest leverage from half the data and then validate the rules using the remaining holdout data. Productive+holdout: find the 1000 productive rules with the highest leverage from half the data and then validate the rules using the remaining holdout data. For all settings the maximum antecedent (x) size was set to the default value of 4. The non-redundant, productive and significance=0.05 treatments all resulted in discovery of 1000 rules for every dataset. Table 1 shows the minimum, mean and maximum support, confidence and leverage for each of these treatments. As can be seen, some rules had substantial support, confidence and leverage. For this task there were almost no differences in the rules discovered by the non-redundant
Table 1: Support, confidence and leverage of rules found from random data — support — — confidence — — leverage — Treatment min mean max min mean max min mean max Non-redundant 320 950 2,688 0.490 0.537 0.618 0.0044 0.0050 0.0116 Productive 320 950 2,688 0.490 0.537 0.618 0.0044 0.0050 0.0116 Significance=0.05 320 860 2,688 0.489 0.537 0.618 0.0042 0.0050 0.0116 and productive approaches because almost all rules with the highest leverage were productive. These results appear to support an affirmative answer to question 1. It seems clear that there is a strong risk of false discoveries unless appropriate allowance is made for the multiple-tests problem. No rules were found for any dataset under the Bonferroni or either holdout treatment. It might come as a surprise that no rules were found under any of these treatments, whereas the adjustments are supposed to restrict the number of analyses for which any false discoveries are made to no more than 5% and hence one might have expected rules to have been found for up to 5 of the datasets under each of these treatments. With the Bonferroni adjustment this is possibly not so surprising as it is much more strict than the Holm procedure which also guarantees strict control over the experimentwise risk of false discoveries, and hence must be less likely to make false discoveries. The reason the Holm procedure makes no false discoveries may relate to the inter-dependencies between the rules. Both the Holm and Bonferroni procedures control against the most disadvantageous form of relationship between the hypothesis tests which occurs when the null hypotheses are mutually exclusive. In practice, however, many of the hypothesis tests for this rule discovery task will be closely related to one another, and may even be equivalent, as for example for the rules pregnant → oedema and oedema → pregnant. In this circumstance the probability of any false discovery occurring is greatly reduced, although if one occurs it is likely several will occur. These results provide support for an affirmative answer for question 2. Both the within-search and holdout approaches can control the risks of false discoveries.
6.2 Experiment 2 The second experiment sought to investigate question 3. Random data were generated comprising 10,000 transactions each containing values for 20 binary variables X55, Y55, X60, Y60, X65, Y65, X70, Y70, X75, Y75, X80, Y80, X85, Y85, X90, Y90, X95, Y95, X100, Y100. Each of the X values was randomly generated with each value being equiprobable. The probability of Yv=1 was v% if Xv=1, otherwise 100-v% and the probability of Yv=0 was v% if Xv=0, otherwise 100-v%. For example, the probability of Y55=1 was 55% if X55=1, otherwise 45%. These data give rise to 40 true discoveries, X55 = 0 → Y 55 = 0, X55 = 1 → Y 55 = 1, Y 55 = 0 → X55 = 0, Y 55 = 1 → X55 = 1 and so on. Any other rules found represent false discoveries. The varying confidence levels of the rules (from 0.55 through to 1.00) represent different levels of challenge to a discovery system. 100 such random datasets were generated and all six treatments used in the previous experiment were applied to each. All treatments found all true rules relating to X and Y65 and higher for all data sets. Only significance=0.05
and Bonferroni found the remaining 8 rules for any dataset and they consistently did so for all datasets. All of nonredundant, productive and significance=0.05 found as many false discoveries as required to fill a quota of 1000 rules. The reason that non-redundant and productive failed to find the 55 and 60 level rules was that they found so many higher leverage rules that these true rules did not fit within the quota of 1000. Neither the Bonferroni nor either of the holdout treatments made any false discoveries. The reason the holdout treatments did not find the 55 or 60 level rules was that those rules were not found during the exploratory rule discovery stage. The highest p-value for any of the rules found under the Bonferroni treatment was 6.19 × 10⁻²⁶ . This would have been rejected if the search space had contained more than 8.095 × 10²³ rules, which would occur, for example, if there were 100 pairs of variables and x were allowed to contain up to 15 values (rule space size = 5.79 × 1027 , adjusted p = 1.73 × 10⁻³⁰ . These results show that the relative power of the withinsearch and holdout approaches will vary depending upon the size of the search space and on the capacity under holdout evaluation of the search technique applied during the exploratory stage to find the true discoveries.
6.3 Experiment 3 The final experiment investigates question 4, how do the techniques perform on real-world data. The same six treatments were used as for the previous experiments. Experiments were conducted using eight of the largest attributevalue datasets from the UCI machine learning [21] and KDD [13] repositories together with the BMS-WebView-1 [30] and Retail [9] datasets. These datasets are described in Table 2. We first found for each dataset the minimum even value for minimum-support that results in fewer than 10,000 nonredundant rules given a minimum-confidence of 0.75. This is listed in the minsup column of Table 2. Each treatment was then applied to each dataset five times, once with each maximum limit maxx on the size of x from 1 to 5. All runs used minimum-confidence=0.75 and the appropriate minimumsupport, except for the holdout treatments which only use half the data for rule discovery and for which the minimumsupport was therefore halved. Table 3 presents the number of rules found by each technique for each data set and setting of maxx. The meanings of the columns are as follows: Dataset: The dataset. maxx: The maximum number of items allowed in x. NR: The number of non-redundant rules ‘discovered.’ Prod: The number of productive rules ‘discovered.’ 0.05: The number of rules ‘discovered’ that passed an unadjusted significance test at the 0.05 level. Within-Search Rule Space: The number of rules in the search space. The within-search technique used a significance level of 0.05 divided by this value.
Dataset BMS-WebView-1 Covtype IPUMS LA 99 KDDCup98 Letter Recognition Mush Retail Shuttle Splice Junction TICDATA 2000
Table 2: Data sets Transactions/Records Items Minsup 59,602 497 50 581,012 125 577,684 88,443 1,883 54,660 52,256 4,244 47,748 20,000 74 1,186 8,124 127 1,730 88,162 16,470 28 58,000 34 1,418 3,177 243 152 5,822 709 5,730
Description E-commerce clickstream data Geographic forest vegetation data Census data Mailing list profitability data Image recognition data Biological data Retail market-basket data Space shuttle mission data Gene sequence data Insurance policy holder data proc
Table 3: Number of rules found under each treatment Dataset |x| BMS-WebView-1 1 BMS-WebView-1 2 BMS-WebView-1 3 BMS-WebView-1 4 BMS-WebView-1 5 Covtype 1 Covtype 2 Covtype 3 Covtype 4 Covtype 5 IPUMS LA 99 1 IPUMS LA 99 2 IPUMS LA 99 3 IPUMS LA 99 4 IPUMS LA 99 5 KDDCup98 1 KDDCup98 2 KDDCup98 3 KDDCup98 4 KDDCup98 5 Letter Recognition 1 Letter Recognition 2 Letter Recognition 3 Letter Recognition 4 Letter Recognition 5 Mush 1 Mush 2 Mush 3 Mush 4 Mush 5 Retail 1 Retail 2 Retail 3 Retail 4 Retail 5 Shuttle 1 Shuttle 2 Shuttle 3 Shuttle 4 Shuttle 5 Splice Junction 1 Splice Junction 2 Splice Junction 3 Splice Junction 4 Splice Junction 5 TICDATA 2000 1 TICDATA 2000 2 TICDATA 2000 3 TICDATA 2000 4 TICDATA 2000 5
NR 3 1075 4530 6600 7173 234 1380 4096 7576 9988 329 1992 5312 8447 9990 265 1580 4646 8157 9984 20 693 3696 7826 9950 223 1674 4885 7751 9070 263 4722 8808 9723 9887 49 745 3910 8260 9999 17 1545 7354 9261 9463 368 2200 5736 8584 9384
Prod 3 1075 4496 6210 6414 0 0 0 0 0 156 401 542 581 582 138 399 715 906 958 20 554 2265 3861 4455 142 630 1292 1665 1750 263 4538 7688 8149 8199 44 529 1823 2529 2630 17 1045 4524 5399 5465 160 328 392 392 392
0.05 3 1068 4084 4885 4915 0 0 0 0 0 143 323 377 383 383 50 80 105 120 124 20 509 1810 2739 2981 135 601 1224 1581 1662 263 2613 3280 3315 3315 44 479 1322 1713 1771 17 394 1894 2241 2251 136 248 280 280 280
Within-Search Rule Space Disc 2.47×10⁵ 3 6.13×10⁷ 941 1.01×10¹⁰ 841 1.25×10¹² 721 1.23×10¹⁴ 594 1.78×10⁴ 0 1.17×10⁶ 0 4.98×10⁷ 0 1.55×10⁹ 0 3.80×10¹⁰ 0 3.08×10⁶ 133 2.23×10⁹ 263 9.60×10¹¹ 288 2.77×10¹⁴ 286 5.73×10¹⁶ 282 1.50×10⁸ 32 4.39×10¹¹ 33 7.49×10¹⁴ 30 8.76×10¹⁷ 30 7.66×10²⁰ 30 3 4.66×10 20 1.34×10⁵ 416 2.30×10⁶ 939 2.68×10⁷ 1029 2.27×10⁸ 975 1.52×10⁴ 126 8.74×10⁵ 516 3.12×10⁷ 1041 7.85×10⁸ 1302 1.48×10¹⁰ 1317 2.71×10⁸ 65 2.23×10¹² 62 1.23×10¹⁶ 55 5.05×10¹⁹ 52 1.66×10²³ 51 1.03×10³ 43 1.46×10⁴ 407 1.19×10⁵ 878 6.29×10⁵ 985 2.28×10⁶ 964 5.81×10⁴ 17 6.88×10⁶ 62 5.33×10⁸ 120 3.04×10¹⁰ 92 1.36×10¹² 75 4.67×10⁵ 32 1.56×10⁸ 24 3.42×10¹⁰ 22 5.53×10¹² 22 7.02×10¹⁴ 22
Holdout-NR Cand Disc 3 3 2398 2076 12873 1839 20877 1755 22135 1747 236 0 1379 0 4103 0 7588 0 10018 0 329 136 1962 261 5209 290 8315 290 9857 288 269 34 1582 38 4608 40 8037 40 9863 40 17 17 595 359 3285 828 6607 958 7978 952 223 126 1674 494 4832 963 7657 1221 8957 1266 447 85 6052 107 10641 98 11556 98 11656 97 48 43 750 396 3895 795 8138 877 9760 876 16 16 1535 62 7067 134 8758 133 8937 132 366 30 2246 30 6150 30 9478 30 10438 30
Holdout-Prod Cand Disc 3 3 2397 2076 12550 1846 17840 1781 18179 1780 0 0 0 0 0 0 0 0 0 0 157 136 412 266 586 297 655 297 668 297 128 34 363 41 641 42 795 40 854 40 17 17 473 366 2055 852 3454 998 3842 1005 137 127 630 519 1261 1027 1611 1303 1682 1351 447 85 5853 107 9220 102 9653 101 9675 101 44 43 530 403 1809 819 2457 923 2555 929 16 16 763 70 4220 145 5135 148 5208 148 110 46 166 46 166 46 166 46 166 46
WSHP 0 146 170 116 77 0 0 0 0 0 1 3 3 3 3 0 0 0 0 0 4 126 390 452 422 1 25 73 95 100 8 5 4 4 4 1 14 82 94 77 1 6 20 10 4 2 2 2 2 2
WSHP 0 1281 1175 1176 1263 0 0 0 0 0 4 6 12 14 18 2 8 12 10 10 1 76 303 421 452 2 28 59 96 134 28 50 51 53 54 1 10 23 32 42 0 14 45 66 77 16 24 26 26 26
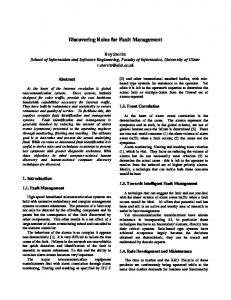
Within-Search Disc: The number of rules ‘discovered’ that passed the adjusted significance test. This is abbreviated as WS, below. Holdout-NR Cand: The number of non-redundant candidate rules generated from the exploratory data under the holdout approach. Holdout-NR Disc: The number of those candidate rules that passed the subsequent holdout evaluation. This is abbreviated as HN, below. Holdout-Prod Cand: The number of productive candidate rules generated from the exploratory data under the holdout approach. Holdout-Prod Disc: The number of those candidate rules that passed the subsequent holdout evaluation. This is abbreviated as HP, below. WSHP: The number of rules ‘discovered’ by the withinsearch technique but not passed by holdout evaluation on productive rules. WSHP: The number of rules passed by holdout evaluation on productive rules but not ‘discovered’ by the within-search technique. The relative numbers of rules discovered for each dataset and maxx by within-search adjusted significance tests and by each of the holdout evaluation techniques are plotted in Figure 2.
6.3.1 Observations A number of points are worth highlighting. First, the number of non-redundant rules that are not productive and the number of productive rules that do not pass an unadjusted significance test is in many cases extremely high. In the most extreme case, Covtype, none of the non-redundant rules is productive. This is due to a peculiarity of this particular dataset which uses 40 mutually exclusive binary variables ST01 to ST40 to represent which one of 40 soil types predominates in an area. Thus, the most frequent attributevalues are values of 0 for individual ST?? variables and the most frequent itemsets are sets of these values. Because they are mutually exclusive, for any two of these variables w and z, P (w=0 | z=1) = 1.0. It follows that, so long as P (z=1) > 0.0, P (w=0 | z=0) < P (w=0). Hence, all associations between these variables must be unproductive. The fact that all the top 9,988 non-redundant associations for this dataset represent negative associations highlights the dangers of data mining without both a clear definition of what constitutes a false discovery and sound mechanisms for detecting and rejecting such false discoveries. (Indeed, it turns out that all of the 197,183,686 highest support associations for this data are associations between these variables and hence negative associations.) Holdout evaluation with productive rules usually finds slightly more rules than Holdout evaluation with nonredundant rules. This is because the size of the correction for multiple tests that is performed during holdout evaluation is smaller, as there are fewer productive than nonredundant rules. The only circumstance in which the use of non-redundant rules could result in more discoveries is if some rules that were unproductive on the exploratory data turned out to be significantly productive on the holdout data. This rarely occurred in the experiments, a total of four rules being discovered by holdout with non-redundant but not holdout with productive. Only one of these rules is productive with respect to the full data, having by chance
proved unproductive with respect to the exploratory sample. The remaining three rules were unproductive with respect to both the full data and the exploratory data, but by chance turned out to be productive on the holdout data. This illustrates a potential flaw in the holdout method. Consider random data such as that used in Experiment 1, above, where a dataset is divided into exploratory and holdout sets. If one were to take the rules that represented the strongest negative correlations with respect to the exploratory data, the probability of those rules representing positive correlations on the holdout data would be increased, as one would be actively selecting for rules for which, by chance, more of the transactions containing both the antecedent and consequent were selected into the holdout data than the training data. It is clearly necessary to avoid any such confounding selection process under the holdout evaluation strategy. Overall, holdout evaluation with productive rules found more rules than within-search significance testing, with the relative performance being more favorable to within-search when the size of the rule space was smaller (small maxx or fewer items) and more favorable to holdout evaluation as the size of the search space increased. This is because of the extremely small significance levels that are employed with large search spaces. The total number of rules discovered by WS often decreased as the search space increased. Such decreases occurred less for holdout evaluation and when they did, the decreases were smaller. Note, however, that these relative results are in part an artifact of the experimental design. If minimum support had been set lower, then WS would have found more rules, as the rules found under the current setting would not have been affected and further rules with lower support could have potentially passed the adjusted significance test. However, increasing minimum support could have reduced the number of rules found by holdout evaluation as it would have increased the number of candidate rules and hence lowered the adjusted significance level that rules had to pass. It is interesting to consider the causes of holdout evaluation failing to find a rule that a within-search correction finds. WS made 16,238 discoveries, where this is the sum of the WS column of Table 3, and multiply counts some rules because a single rule may be discovered repeatedly at different settings of maxx. Of these, 2,554 were not discovered by HP, as shown in column WSHP of Table 3. In 533 cases the rule was found during the exploratory stage but failed holdout evaluation. In the remaining 2,021 cases the rule was not found during the exploratory stage. This latter case occurred primarily because rules failed to attain the required minimum support with respect to the smaller sample of data available for the initial rule discovery stage when holdout evaluation is performed. It is also interesting to observe that in some cases huge numbers of additional rules were found during the exploratory stage relative to those found from the full data set, the most extreme case being BMS-Webview-1, for which approximately three times the number of candidate rules were found relative to discovery from the full dataset. This illustrates the disadvantage of working with the smaller samples inherent in the holdout approach.
7. FUTURE RESEARCH The effectiveness of holdout evaluation with productive rules relative to that of holdout evaluation with non-
500
b
WS
c b
0
1 2 3 4 BMS-WebView-1 maxx
300
bb c
250
b bc
bbc
bb bc
HP HN WS
100 50 0 1 2 3 4 IPUMS LA 99 maxx
5
b b c b
b bb c
b bb c
800
HP WS HN
b bc
200 c b
0 0
1 2 3 4 Letter Recognition maxx bc
100
bb c
bb c
b
60
b
b
b
bb c
b
HP HN
WS
20 0 1
2 3 Retail maxx
150
b c b b
125 100
4
5
b c b
b c b
b
b bc
50 25
b c
0 0
1 2 3 4 Splice Junction maxx
5
t u
0
HP HN
WS
1
t u
t u
t u
2 3 4 Covtype maxx
t HP u
HN WS
5
50 40
b bc
bc
bc
HN HP
b
b
b
WS
1 2 3 4 KDDCup98 maxx
5
b bc
bb bc
4
5
b b bc
bb bc
2 3 4 Shuttle maxx
5
b bc b
bc b
30 20 10 0
1400 1200 1000 800 600 400 200 0
b bc
HP WS HN
bbc bc
1
2 3 Mush maxx
1000
b bbc
800
WS HP HN
600 bc
400 200 bc
0 0
b
75
2000
0
40
0
4000
5
c b
80
6000
0
600 400
8000
0
c b
1000
10000
5
200 150
No. of rules ‘discovered’
b
No. of rules ‘discovered’
No. of rules ‘discovered’ No. of rules ‘discovered’
b
HP HN
No. of rules ‘discovered’
b
1000
0
No. of rules ‘discovered’
bb c
1500
0
No. of rules ‘discovered’
bc
No. of rules ‘discovered’
bc
No. of rules ‘discovered’
No. of rules ‘discovered’
bc
2000
50
1 b
b
b
b
b
HP
bc
bc
bc
bc
HN
b
b
b
WS
40 b bc
30
b
20 10 0 0
1 2 3 4 TICDATA 2000 maxx
Figure 2: Numbers of rules ‘discovered’
5
redundant rules demonstrates the value of excluding from holdout evaluation rules that are unlikely to pass. On the other hand, however, the small number of rules that were found using non-redundant rather than productive rules demonstrates the danger of performing too strong a filter on the rules to be subjected to holdout evaluation. The development of effective techniques for performing such filtering provides a promising direction for future investigation. In the current within-search approach, the adjustment to the significance level takes account of the size of the entire rule space under consideration. It takes no account of the fact that the number of candidates must vary as user specified constraints such as minimum-support are varied. It seems credible that the adjustment should get smaller as minimum-support gets higher, as fewer significance tests will be applied. However, it would be incorrect to simply adjust for the number of rules that pass a minimum support constraint. To understand why this is so, consider the example of random data in Experiment 1, above, which consists of 10,000 transactions each containing values for 100 binary variables with each value being equiprobable. For one such random dataset, 12 non-redundant rules were found with support greater than 2600. If a significance level of 0.05 were adjusted to allow for 12 tests, the resulting adjusted significance level would be 0.00417. Two of the twelve rules would pass a Fisher exact test at this significance level, both obtaining p-values of 0.00112. The reason that it is not appropriate to adjust the significance test only for the rules that pass a minimum-support constraint is that sampling effects will exaggerate the support of some rules and the number of such exaggerated support counts experienced relates to the total number of rules in the global rule space, not just to the number that pass the minimum support constraint. It would be valuable if sound techniques could be developed for modifying adjustments in line with relaxation or strengthening of constraints. It is possible to vary the size of the rule space for the within search strategy by varying constraints such as maxx, or by deleting items from consideration. It is clear that doing so will alter the number of discoveries that are made, and that in some circumstances increasing the size of the rule space will decrease the number of discoveries. It would be valuable to develop techniques for selecting constraints that will maximize the expected number of discoveries. One approach might be to explore a variety of constraints and then select the one that delivers the most discoveries, but care would need to be taken that the selection criteria were in no way selecting the settings that were most likely to have resulted in false discoveries, because doing so could defeat the current strict control over the risk of false discoveries. It is possible that selecting the settings that deliver the most rules might favor settings that produce false discoveries, as any false discoveries produced will increase the number of discoveries. The current research has adopted the association rules support-confidence framework. The ability to assess significance during search holds open the prospect of a new form of rule discovery, in which all statistically significant rules are discovered without the need to specify any arbitrary parameter other than the risk of false discoveries (the global significance level). As search through the massive search spaces involved in rule discovery relies upon efficient pruning from consideration of the majority of the search space, the
development of such techniques will depend critically upon whether effective techniques can be developed for identifying sections of the search space that cannot contain rules that could pass a significance test. This is a further intriguing direction for future research. A somewhat related line of research to that pursued herein involves the discovery of condensed representations [19, 8, 11] for datamining. Like the current research, this is concerned with reducing the number of discoveries. However, while we seek here to limit discoveries to those that represent non-trivial interactions between variables, condensed representations seek to limit discoveries to a limited set from which all other discoveries can be inferred. It would be useful to develop condensed representations for significant rules, thereby coupling the representational power of condensed representations with the ability to avoid false discoveries.
8. CONCLUSIONS This research has demonstrated the effectiveness of two alternative techniques for controlling the risk of false discoveries during association rule discovery. Within-search significance tests adjust the significance level to allow for the size of the search space from which rules have been drawn. Despite the resulting use of extremely low significance levels (in our experiments as low as 3 × 10⁻²⁵ ), in some cases large numbers of rules can be discovered while providing strict control over the risk of false discoveries. Holdout evaluation can also provide strict control over the risk of false discoveries by first discovering candidate rules from an exploratory dataset and then testing those rules on different holdout data. Our experimental evaluation has demonstrated that neither of these approaches clearly dominates the other. While in our experiments the holdout approach made substantially more discoveries overall, it is clear that the within-search approach holds an advantage when the the size of the searchspace is small or when the number of candidate rules is large. Both techniques provide considerable flexibility. Most importantly, while we have examined in this paper only techniques for discarding unproductive rules, the techniques are directly applicable to any statistical hypothesis test, allowing users to identify and discard false discoveries using whatever definition of false discovery is applicable to their specific application. The problem of false discoveries appears to be a serious one, as evidenced by the large numbers of non-redundant rules that are not even productive on the sample data, let alone in the domain from which the data have been sampled. The Covtype dataset is real-world data for which all of the 197,183,686 highest support rules are unproductive. Experiment 1 demonstrated that it is possible to ‘discover’ large numbers of association rules from totally random data. These examples starkly illustrate that there is a serious risk of discovering large numbers of spurious rules if we do not perform appropriate statistical evaluation during association rule discovery that takes account of the size of the search space that is explored. We, the members of the data mining community, are doing a serious disservice to ourselves, as well as to the communities we seek to serve, if we present sets of ‘discoveries’ to our clients of which the majority are spurious.
9.
ACKNOWLEDGMENTS
This research has been supported by Australian Research Council Grant DP0450219. We are grateful to Janice Boughton for assistance in the collation of experimental results.
10. REFERENCES [1] R. Agrawal, T. Imielinski, and A. Swami. Mining associations between sets of items in massive databases. In Proc. 1993 ACM-SIGMOD Int. Conf. Management of Data, pages 207–216, Washington, DC, May 1993. [2] A. Agresti. A survey of exact inference for contingency tables. Statistical Science, 7(1):131–153, February 1992. [3] Y. Bastide, N. Pasquier, R. Taouil, G. Stumme, and L. Lakhal. Mining minimal non-redundant association rules using frequent closed itemsets. In First Int. Conf. Computational Logic - CL 2000, pages 972–986, Berlin, 2000. Springer-Verlag. [4] S. D. Bay and M. J. Pazzani. Detecting group differences: Mining contrast sets. Data Mining and Knowledge Discovery, 5(3):213–246, 2001. [5] R. J. Bayardo, Jr., R. Agrawal, and D. Gunopulos. Constraint-based rule mining in large, dense databases. Data Mining and Knowledge Discovery, 4(2/3):217–240, 2000. [6] Y. Benjamini and Y. Hochberg. Controlling the false discovery rate: A new and powerful approach to multiple testing. Journal of the Royal Statistical Society Series B, 57:289–300, 1995. [7] Y. Benjamini and D. Yekutieli. The control of the false discovery rate in multiple testing under dependency. The Annals of Statistics, 29(4):1165–1188, 2001. [8] J.-F. Boulicaut and A. Bykowski. Frequent closures as a concise representation for binary data mining. In Proc. Pacific-Asia Conf. Knowledge Discovery and Datamining (PAKDD-2000), pages 62–73, Kyoto, Japan, 2000. [9] T. Brijs, G. Swinnen, K. Vanhoof, and G. Wets. Using association rules for product assortment decisions: A case study. In Knowledge Discovery and Data Mining, pages 254–260, 1999. [10] S. Brin, R. Motwani, and C. Silverstein. Beyond market baskets: Generalizing association rules to correlations. In J. Peckham, editor, SIGMOD 1997, Proc. ACM SIGMOD Int. Conf. Management of Data, pages 265–276, New York, NY, May 1997. ACM Press. [11] T. Calders and B. Goethals. Mining all non-derivable frequent itemsets. In Proc. 6th European Conf. Principles and Practice of Knowledge Discovery in Databases, PKDD 2002, pages 74–85, Berlin, 2002. Springer. [12] W. DuMouchel and D. Pregibon. Empirical Bayes screening for multi-item associations. In KDD-2001: Proc. Seventh ACM SIGKDD Int. Conf. Knowledge Discovery and Data Mining, pages 76–76, New York, NY, August 2001. ACM Press. [13] S. Hettich and S. D. Bay. The UCI KDD archive. [http://kdd.ics.uci.edu] Irvine, CA: University of California, Department of Information and Computer Science., 2006.
[14] B. Holland and C. M. D. Improved Bonferroni-type multiple testing procedures. Psychological Bulletin, 104(1):145–149, 1988. [15] S. Holm. A simple sequentially rejective multiple test procedure. Scandinavian Journal of Statistics, 6:65–70, 1979. [16] International Business Machines. IBM intelligent miner user’s guide, version 1, release 1, 1996. [17] C. Jermaine. Finding the most interesting correlations in a database: How hard can it be? Information Systems, 30(1):21–46, 2005. [18] B. Liu, W. Hsu, and Y. Ma. Pruning and summarizing the discovered associations. In Proc. Fifth ACM SIGKDD Int. Conf. Knowledge Discovery and Data Mining (KDD-99), pages 125–134, New York, August 1999. AAAI. [19] H. Mannila and H. Toivonen. Multiple uses of frequent sets and condensed representations. In Proc. Int. Conf. Knowledge Discovery and Data Mining KDD’96, pages 189–194, Portland, USA, 1996. [20] N. Megiddo and R. Srikant. Discovering predictive association rules. In Proc. Fourth Int. Conf. Knowledge Discovery and Data Mining (KDD-98), pages 27–78, Menlo Park, US, 1998. AAAI Press. [21] D. J. Newman, S. Hettich, C. Blake, and C. J. Merz. UCI repository of machine learning databases. [Machine-readable data repository]. University of California, Department of Information and Computer Science, Irvine, CA., 2006. [22] G. Piatetsky-Shapiro. Discovery, analysis, and presentation of strong rules. In G. Piatetsky-Shapiro and J. Frawley, editors, Knowledge Discovery in Databases, pages 229–248. AAAI/MIT Press, Menlo Park, CA., 1991. [23] T. Scheffer. Finding association rules that trade support optimally against confidence. Intelligent Data Analysis, 9(4):381 – 395, 1995. [24] J. P. Shaffer. Multiple hypothesis testing. Ann. Rev. Psychology, 46:561–584, 1995. [25] G. I. Webb. Magnum Opus Version 1.3. Software, G. I. Webb & Associates, Melbourne, Aust., 2002. [26] G. I. Webb. Magnum Opus Version 3.1. Software, G. I. Webb & Associates, Melbourne, Aust., 2006. [27] G. I. Webb and S. Zhang. K-optimal rule discovery. Data Mining and Knowledge Discovery, 10(1):39–79, 2005. [28] M. J. Zaki. Mining non-redundant association rules. Data Mining and Knowledge Discovery, 9(3):223–248, 2004. [29] H. Zhang, B. Padmanabhan, and A. Tuzhilin. On the discovery of significant statistical quantitative rules. In Proc. Tenth Int. Conf. Knowledge Discovery and Data Mining (KDD-2004), pages 374–383, New York, NY, August 2004. ACM Press. [30] Z. Zheng, R. Kohavi, and L. Mason. Real world performance of association rule algorithms. In Proc. Seventh Int. Conf. Knowledge Discovery and Data Mining (KDD-2001), pages 401–406, New York, NY, August 2001. ACM.