sults on a distributed embedded system with the Itsy pocket computers connected by serial links. Our experiments con- firmed that a distributed system can ...
Distributed Embedded Systems for Low Power: A Case Study Jinfeng Liu, Pai H. Chou Center for Embedded Computer Systems University of California, Irvine, CA 92697-2625, USA {jinfengl, phchou}@uci.edu Abstract A multiple-processor system can potentially achieve higher energy savings than a single processor, because the reduced workload on each processor creates new opportunities for dynamic voltage scaling (DVS). However, as the cost of communication starts to match or surpass that of computation, many new challenges arise in making DVS effective in a distributed system under communicationintensive workload. This paper discusses implementation issues for supporting DVS on distributed embedded processors. We implemented and evaluated four distributed schemes: (1) DVS during I/O, (2) partitioning, (3) powerfailure recovery, and (4) node rotation. We validated the results on a distributed embedded system with the Itsy pocket computers connected by serial links. Our experiments confirmed that a distributed system can create new DVS opportunities and achieve further energy savings. However, a surprising result was that aggregate energy savings do not translate directly into a longer battery life. In fact, the best partitioning scheme, which distributed the workload onto two nodes and enabled the most power-efficient CPU speeds at 30–50%, resulted in only 15% improvement in battery lifetime. Of the four techniques evaluated, node rotation showed the most measurable improvement to battery lifetime at 45% by balancing the discharge rates among the nodes.
1 Introduction Dynamic voltage scaling (DVS) is one of the most studied topics in low-power embedded systems. Based on CMOS characteristics, the power consumption is proportional to V 2 ; while the supply voltage V is linearly proportional to the clock frequency. To fully exploit such quadratic power vs. voltage scaling effects, previous studies have extensively explored DVS with real-time and non-real-time
scheduling techniques. As DVS reaches its limit on a single processor, researchers turn to multiple processors to create additional opportunities for DVS. Multiple processors can potentially achieve higher energy savings than a single processor. By partitioning the workload onto multiple processors, each processor is now responsible for only a fraction of the workload and can operate at a lower voltage/frquency level with quadratic power saving. Meanwhile, the lost performance can be compensated by the increased parallelism. Another advantage with a distributed scheme is that heterogeneous hardware such as DSP and other accelerators can further improve power efficiency of various stages of the computation through specialization. Although a tightly-coupled, shared-memory multiprocessor architecture may have more power/performance advantages, they are not as scalable as distributed, messagepassing schemes. While distributed systems have many attractive properties, they pay a higher price for message-passing communications. Each node now must handle not only I/O with the external world, but also I/O on the internal network. Programming for distributed systems is also inherently more difficult than for single processors. Although higher-level abstractions have been proposed to facilitate distributed programming, these abstraction layers generate even more inter-processor communication traffic behind the scenes. While this may be appropriate for high-performance cluster computers with multi-tier, multi-gigabit switches like Myrinet or Gigabit Ethernet, such high-speed, high-power communication media are not realistic for battery-powered embedded systems. Instead, the low-power requirement have constrained the communication interfaces to much slower, often serial interfaces such as I 2 C and CAN. As a result, even if the actual data workload is not large on an absolute scale, it appears expensive relatively to the computation performance that can be delivered by today’s lowpower embedded microprocessors. The effect of I/O on embedded systems has not been well studied in existing DVS works. Many existing DVS
techniques have shown impressive power savings on a single processor. However, few results have been fully qualified in the context of an entire system. Even fewer have been validated on actual hardware. One common simplifying assumption is to ignore I/O. Embedded systems (including single-processor systems) that perform no I/O are not realistic. I/O can actually enhance computation by creating opportunities for DVS through parallelism. At the same time, I/O can also compete with computation for time and power budgets, thereby lowering the limit on power savings achievable by DVS. The effects of I/O on DVS is not yet well understood, and the problem is further complicated by the trend towards DVS in distributed systems. The contributions of this paper are two-fold. First, we demonstrate the gap between CPU-centric DVS claims and actual attainable power savings by implementing a full-featured distributed embedded system running a communication-bound, communication-intensive workload with expensive I/O. This work also contrasts with sensor networks, which may be distributed, networked, and lowpower, but they are 99% idle, perform very little computation and communication, and are soft real-time. Our case study considers much higher computation workload under tight timing constraints. Without much slack, DVS cannot be very effective, but the expensive I/O turns out to be a new source of opportunities for DVS. Our second contribution is the set of principles and pitfalls in global power optimization. Our findings confirmed that parallelism can indeed create new opportunities for DVS to achieve further energy savings; however, one must avoid many pitfalls in order to achieve these savings on a distributed architecture powered by separate batteries. A single battery failure can be disastrous to the entire system. We observed that global energy optimization can often contradict the goal to maximize the uptime of a distributed, battery-powered system. This is due to the fact that global optimization does not guarantee a locally near-optimal configuration for each distributed node. An ill-configured node operating at an energy-inefficient point can drain its battery quickly and bring down the whole system. Our experiments indicated load balancing is one of the key factors in deciding the uptime of the first faulting node. Special considerations, including partitioning, scheduling, synchronization, load balancing and power failure detection and recovery, must be carefully coordinated with DVS, or else the same DVS techniques will be counterproductive. This paper first reviews DVS techniques, the application example, and the experimental platform. We chose the Itsy pocket computer as our experimental platform: it supports a rich, well-documented set of DVS routines, and it is also available to other researchers who wish to reproduce these results. Because Itsy runs Linux, it is easy to port fullfledged, distributed programs and experimental tools to it.
We also use Itsy’s on-board power instrumentation features to collect data for the power characteristics. Our results confirmed that the distributed DVS scheme combined with efficient load balancing by rotating the nodes achieved the highest measured energy saving and extended the battery life by 45%.
2 Related Work
Real-time scheduling has been extended to DVS scheduling on variable-voltage processors. The initial scheduling model was introduced by Yao et al [10], then extended and refined by Yasuura [6], Quan [7] and many studies in variations for real-time scheduling problems. Since power is a quadratic function of the supplying voltage, lowering the voltage can result in significant savings while still enabling the processor to continue making progress such that the tasks can be completed before their deadlines. These techniques often focus on the energy reduction to the processor only; while the power consumption of other components, including memory, I/O, is ignored. The results are rarely validated on real hardware. DVS has been applied to benchmark applications such as JPEG and MPEG in embedded systems. Im et al [4] proposes to buffer the incoming tasks such that the idle period between task arrivals can be utilized by DVS. Shin et al [8] introduces an intra-task DVS scheme that maximally utilizes the slack time within one task. Choi et al [2] presents a DVS scheme in an MPEG decoder by taking advantage of the different types of frames in the MPEG stream. These techniques can be validated with measurement on real or emulated platforms. However, they are also computationoriented such that the processor performs only very little, if any I/O. The impact of I/O still remains under-studied. DVS has recently been extended to multi-processor systems. Weglarz [9] proposes partitioning the computation onto a multi-processor architecture that consumes significantly less power than a single processor. There is a fundamental difference in applying techniques for multiprocessors to distributed systems. Minimizing the global energy consumption will extend the battery life only if the whole system is assumed to be powered by a single battery unit. In a distributed environment, each node is power by a dedicated battery. Even a globally optimal solution may cause poor battery efficiency locally and result in shortened system uptime as well as loss of battery capacities. Maleki et al [5] analyzes the energy efficiency of routing protocols in an ad-hoc network and shows that the global optimal schemes often contradicts the goal to extend the lifetime of a distributed system. 2
image
Target Detection
FFT
IFFT
Compute Distance
result
Power Node1 receives frame I+1 from source
Node1 receives frame I from source
Figure 1. Block diagram of the ATR algorithm. Node1
Power
SE ND 1
RECV1
PROC1
SE ND 1
PROC1
RECV1
D
RECV from ext. source or another node
PROC
D
D
Node1 sends inermediate result of frame I to Node2
SEND to ext. destination or another node
Node1 sends inermediate result of frame I+1 to Node2
D
D
Time
Node2
Figure 2. The timing vs. power diagram of a single node.
RE CV 2
PROC2
SEND 2
Node2 sends final result of frame I-1 to destination
3 Motivating Example
SE ND 1
RE CV 2
PROC2
SEND 2
Node2 sends final result of frame I to destination
RE CV 2
Time
Figure 3. The timing vs. power diagram of two nodes.
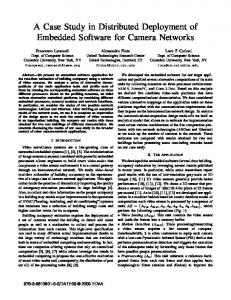
We select an image processing algorithm, automatic target recognition (ATR) as our motivating example to evaluate a realistic application under I/O pressure. Its block diagram is shown in Fig. 1. The algorithm is able to detect pre-defined targets on an input image. For each target, a region of interest is extracted and filtered by templates. Finally, the distance of each target is computed. A throughput constraint is imposed such that the image frames must be processed at a fixed rate. We evaluate a few DVS schemes on one or more embedded processors that perform the ATR algorithm. Unlike many DVS studies that ignore I/O, we assume that all nodes in our system are connected to a communication network. This network carries data from external sources (e.g., a camera, sensor, etc.) internal communications between the nodes, and to an external destination (e.g., a PC). This study assumes only one image and one target are processed at a time, although a multi-frame, multi-target version of the algorithm is also available. We refer to each embedded processor as a node. A node is a full-fledged computer system with a voltage-scalable processor, I/O devices, and memory. Each node performs a computation task PROC and two communication tasks RECV and SEND. RECV receives data from the external source or another node. The data is processed by PROC, which consists of one or more functional blocks of the ATR algorithm. The result is transmitted by task SEND to another node or the destination. Due to data dependencies, tasks RECV , PROC, and SEND must be fully serialized for each node. In addition, they must complete within a time period called the frame delay D, which is defined as the performance constraint. Fig. 2 illustrates the timing vs. power diagram of a node.
When multiple nodes are configured as a distributed system, we organize them in a pipeline for the ATR algorithm. Fig. 3 shows the timing vs. power diagram of two pipelined nodes performing the ATR algorithm. Node1 maps first two function blocks, and Node2 performs the other two blocks. Node1 receives one frame from the data source, and it processes the data and sends the intermediate result to Node2 in D seconds. After Node2 starts receiving from Node1, it finishes its share of computation and sends the final result to the destination within D seconds. Fig. 3 shows that if the data source keeps producing one frame every D seconds, and both Node1 and Node2 can send their results also in D seconds, then the distributed pipeline is able to provide one result in every D seconds to the destination. We use generic TCP/IP sockets to implement reliable communication, although it could be further optimized. We believe this is reasonable and is much lighter weight than middleware such as CORBA, which some researchers advocate even on small devices. We also assume the workload of the algorithm is fixed such that DVS opportunities are limited by I/O and timing constraints. Our purpose in this study is to explore the computation-I/O interaction and their impact on DVS, but not to specifically optimize for either I/O power or computation power. Other techniques that reduce communication or computation power under variable workload can be readily brought into the context of this study. 3
IP forwarding over PPP
Host USB USB Hub
USB/Serial converter
USB/Serial converter
USB/Serial converter
PPP0
PPP1
PPP2
serial
Itsy
serial
Itsy
serial
Itsy
Figure 5. Networking multiple Itsy units with a host computer. Figure 4. The block diagram of Itsy [1]. transparently as if they were on the same TCP/IP network. The network configuration is shown in Fig. 5. The serial link might not be the best choice for interconnect, but it is often used in real life due to power constraints. A high-speed network interface requires several Watts of power, which is too high for battery-powered embedded systems such as Itsy. In this paper, our primary goal is to investigate the new opportunities for DVS-enabled power vs. performance trade-offs in distributed embedded systems with intensive I/O. Given the limitations of serial ports, we do not intend to propose our experimental platform as a prototype of a new distributed network architecture. We chose this network platform primarily because it represents the state of the art in power management capabilities. It is also consistent with the relatively expensive communication, both in terms of time and energy, seen by such systems. We expect that our findings in this paper can be applied to many communication-intensive applications on other network architectures, where communication is a key factor for both performance and power management.
4 Experimental Platform We use the Itsy pocket computers as distributed nodes, connected by a TCP/IP network over serial links. We present the performance and power profiles of the ATR algorithm running on Itsy computers and define the metrics for our experiments.
4.1 The Itsy Pocket Computer The Itsy pocket computer is a full-fledged miniaturized computer system developed by Compaq Western Digital Lab [1, 3]. It supports DVS on the StrongARM SA-1100 processor with 11 frequency levels from 59 – 206.4 MHz over 43 different voltage levels. Itsy also has 32MB flash memory for off-line storage and 32MB DRAM as the main memory and a RAM disk. The power supply is a 4V lithium-ion battery pack. Due to the power density constraint of the battery, Itsy currently does not support highspeed I/O such as Ethernet or USB. The applicable I/O ports are a serial port and an infra-red port. Itsy runs Linux with networking support. Its block diagram is shown in Fig. 4.
4.3 Performance Profile of the ATR Algorithm 4.2 Network Configuration Each single iteration of the entire ATR algorithm takes 1.1 seconds to complete on one Itsy node running at the peak clock rate of 206.4 MHz. When the clock rate is reduced, the performance degrades linearly with the clock rate. The PPP connection on the serial port has a maximum data rate of 115.2 Kbps, though our measured data rate is roughly 80 Kbps. In addition, the startup time for establishing a single communication transaction takes 50–100 ms. The computation and communication behaviors are profiled and summarized in Fig. 6. The functional blocks can be all combined into one node or distributed onto multiple nodes
We currently use the serial port as the network interface. We set up a separate host computer as both the external source and destination. It connects the Itsy nodes through multiple serial ports established by USB/serial adaptors. We setup individual PPP (point-to-point protocol) connections between each Itsy node and the host computer. Therefore the host computer acts as the hub for multiple PPP networks, and it assigns a unique IP address to each Itsy node. Finally, we start the IP forwarding service on the host computer to allow Itsy nodes to communicate with each other 4
Host
1.1 sec 10.1 KB
Target Detection
0.16 sec 0.6 KB
0.18 sec @ 206 MHz
long delays thus consume a significant amount of energy, although the communication power level is not the highest. As a result, I/O energy becomes a primary target to optimize in addition to DVS on computation.
0.1 sec 0.1 KB
0.85 sec 7.5 KB
0.85 sec 7.5 KB
FFT
IFFT
Compute Distance
0.19 sec @ 206 MHz
0.32 sec @ 206 MHz
0.53 sec @ 206 MHz
4.5 Metrics We evaluate several DVS techniques by a series of experiments with one or more Itsy nodes. A baseline configuration is a single Itsy node running the entire ATR algorithm at the highest clock rate. It is able to produce one result in every D seconds. For all experiments, we fix this frame delay D as the performance constraint and keep the Itsy node(s) running until the battery is fully discharged. The energy metric can be measured by the battery life T (N) when N nodes with N batteries are being used. The completed workload F(N) is the number of frames completed before the battery exhaustion. The battery life in the baseline configuration is T (1). Since the frame delay D is fixed, the host computer will transmit one frame to the first Itsy node in every D seconds. The Itsy node(s) are also able to complete and send one result back to the host in every D seconds. In an N-node pipeline, there is a pipeline startup delay (N − 1) × D before the first result can be produced. Therefore, T (N) = F(N) × D + (N − 1) × D. Since F(N) is at least a few thousand frames in our experiments while N = 2, the pipeline startup overhead is ignored such that T (N) = F(N) × D. The battery life T (N) is also called the absolute battery life. We also define the normalized battery life Tnorm (N) = T (N)/N to quantify the energy savings for fair comparisons. The rationale behind this distinction is that, the total lifetime of N batteries should be at least N times that of a single battery, or else they are less energy efficient. For example, a two-node system with two batteries should last at least twice as long as a single node does. To make comparisons easier, we define the normalized battery life ratio Rnorm (N) = Tnorm (N)/T (1). In the baseline configuration, Tnorm (1) = T (1), Rnorm (1) = 100%.
One or more Itsy nodes
Figure 6. Performance profile of ATR on Itsy. 140
Current (mA)
120
100
80
60
40
20
0 Freq (MHz) 59 Volt(V) 0.919
73.7 0.978
88.5 1.067 Idle
103.2 1.067
118 1.126
132.7 1.156
Communication
147.5 1.156
162.2 1.215
176.9 1.304
191.7 1.363
206.4 1.393
Computation
Figure 7. Power profile of ATR on Itsy. in a pipeline. In the single node case there are no communications between adjacent nodes, although the node still has to communicate with the host computer.
4.4 Power Profile of the ATR Algorithm Fig. 6 shows the net current draw of one Itsy node. The horizontal axis represents the frequency and corresponding voltage levels. The data are collected by Itsy’s built-in power monitor. During all experiments the LCD screen and the speaker are turned off to reduce unnecessary power consumption. The execution of the ATR algorithm on Itsy has three modes of operations: idle, communication and computation. In idle mode, the Itsy node has neither I/O nor any computation workload. In communication mode, it is either sending or receiving data through the serial port. In computation mode, it executes the ATR algorithm. Fig. 6 shows the three curves range from 30 mA to 130 mA, indicating a power range from 0.1W to 0.5W. The computation always dominates the power consumption. However, due to the slow data rate of the serial port, communication tasks have
5 Techniques under Evaluation We first define the baseline configuration as a reference to compare experimental results. We briefly review the DVS techniques to be evaluated by our experiments.
5.1 Baseline Configuration The baseline configuration is a single Itsy node performing the entire ATR algorithm. It operates at the highest CPU clock rate of 206.4 MHz. The processing task PROC requires 1.1 seconds to complete. The node also needs 1.1 and 5
Partitioning schemes: (Node1) (Node2)
Node1 clock rate (MHz)
Node2 clock rate (MHz)
Node1 comm. payload (KB)
Node2 comm. payload (KB)
(Target Detect.) (FFT + IFFT + Comp. Distance)
59
103.2
10.7
0.7
(Target Detect. + FFT) (IFFT + Comp. Distance)
191.7
132.7
17.6
7.6
(Target Detect. + FFT + IFFT) (Comp. Distance)
> 206.4
88.5
17.6
7.6
nodes are allowed to run at much lower clock rates. The second and third schemes have excessive internal communication. Therefore computation must run faster, otherwise they cannot produce the results in D = 2.3 seconds. Especially in the third scheme, Node1 is not capable of completing its work on time unless clocked at 380 MHz, which exceeds the maximum clock rate. We choose the first scheme for all distributed DVS experiments, although the computation workload is still unbalanced. However, it is the optimal partitioning between computation and I/O in a sense that Node1 also takes more than 90% of the total communication payload in addition to its 10% share of the total computation load.
Figure 8. Three partitioning schemes. 0.1 seconds to receive and send data, respectively. Therefore the total time to process one frame is D = 2.3 seconds. Based on the metrics we defined in Section 4.5, we fix this frame delay D = 2.3 seconds in all experiments.
5.4 Distributed DVS with Power Failure Recovery
5.2 DVS during I/O
In general, it is impossible to evenly distribute the workload to each node in a distributed system. In many cases even the optimal partitioning scheme yields very unbalanced workload distribution. In our experiments, Node2 with more workload will have to run faster thus its battery will exhaust sooner. After one node fails, the distributed pipeline will simply stall although the remaining nodes still have sufficient battery capacity to keep working. This will result in unnecessary loss of battery capacity. One potential solution is to recover from the power failure on one node by detecting the faulting node dynamically and migrating its computation to neighboring nodes. Such techniques normally require additional control messages between nodes, thereby increasing I/O pressure on the already I/O-bound applications. Since these messages will also cost time, they will force an increase of computation speed such that the node will fail even sooner. As a proof of concept, we implement a fault recovery scheme as follows. Each sending transaction must be acknowledged by the receiver. A timeout mechanism is used on each node to detect the failure of the neighboring nodes. The computation share of the failed node will then migrate to one of its neighboring nodes. The message reporting a faulting node can be encapsulated into the sending data stream and the acknowledgment. Therefore, the information can be propagated to all nodes in the system. As mentioned in Section 4.3, the acknowledgment signal requires a separate transaction, which typically costs 50–100 ms in addition to the extended I/O delay. Since the frame delay D is fixed, the processor must run faster to meet the timing constraint due to the increased I/O delay to support the power failure recovery mechanism.
The first technique is to perform DVS during the I/O period. Since the application is tightly constrained on timing with expensive I/O delay, there is not much opportunity for DVS on computation without a performance penalty. On the other hand, since the Itsy node spends a long time on communication, it is possible to apply DVS during I/O. Based on the power characteristics shown in Fig. 7, I/O can operate at a significantly low-power level at the slowest frequency of 59 MHz.
5.3 Distributed DVS by Partitioning Partitioning the algorithm onto multiple nodes can create more time per slot for DVS on each distributed node. However, since the application is already I/O-bound, additional communication between nodes can further increase the I/O pressure. A few concerns must be taking into account to correctly balance computation and I/O. First, each node must be able to complete its tasks RECV , PROC, and SEND within D = 2.3 seconds. With an unbalanced partitioning, a node can be overloaded with either excessive I/O or heavy computation, such that it cannot finish its work on time and then the whole pipeline will fail to meet the performance constraint. Second, additional communication can potentially saturate the network such that none of the nodes can guarantee to finish their workload on time. Finally, the distributed system should deliver an extended battery life in the normalized term, not just a longer absolute uptime. We experiment with two Itsy nodes, although the results do generalize to more nodes. Based on the block diagram in Fig. 6, three partitioning schemes are available and illustrated in Fig. 8. The first scheme, where Node1 is only responsible for target detection and Node2 performs the remaining three functional blocks, is clearly the best among all three solutions. Due to the least amount of I/O, both
5.5 Distributed DVS with Node Rotation As an alternative to the power failure recovery scheme in Section 5.4, we balance the load on each node more ef6
ficiently with a new technique. If all nodes are evenly balanced, after the first battery fails, then the other batteries will also exhaust shortly. There is not much battery capacity to enable the remaining nodes to continue making progress, even if a recovery scheme allows them to. Therefore, power failure recovery is not necessary and its expensive overhead can be avoided, while the battery capacity can be still utilized efficiently. We designed a new load balancing technique called node rotation. The idea is that if we can shuffle the workload on all nodes, such that the lightly-loaded nodes will have more workload and the heavily-loaded nodes can “rest,” then the workload on each node will be evened out after a few shuffles. However, reconfiguring the nodes in a pipeline generally requires a pipeline stall (or flush) followed by a restart, which will incur both performance and energy penalties. Our node rotation scheme involves minimal overhead, and it works as follows. At a given moment, each node in the pipeline will perform the following procedure. After Nodei , for i = 1, 2, . . . , N − 1, finishes the processing task PROCi , it will not send the result to the next node Node i+1 . Instead Nodei reconfigures itself to Nodei+1 . That is, it continues performing the processing task PROCi+1 of Nodei+1 , with the input data already available from the result of PROCi . After each Node i finishes PROCi+1 , then it sends the result to Node i+1 (that has been reconfigured as Node i+2 ) except for node Node N−1 (that has been reconfigured as the last node Node N ) that will send the final result to the host. Afterwards, each node Node i will just act as Nodei+1 . The last node Node N will reconfigure itself as the first node Node1 , and will start receiving from the host, processing the data with PROC1 and sending the result to the next node. During such a procedure, the last node is rotated to the front of the pipeline. If rotation is performed once in every certain number of frames, after N rotations, the workload on each node is evenly balanced. Fig. 9 illustrates this procedure. After Node1 finishes PROC1 for the I th frame, it will continue on PROC2 then send the I th result to the host. Then it “becomes” Node2. Meanwhile Node2 becomes Node1 such that it will receive the (I + 1)th frame from the host, process it by PROC1 and pass the intermediate result to Node1 (that has already become Node2). During the transition period, Node1 eliminates one SEND transaction and so does Node2 a RECV transaction. This extra idle time slot is previously allocated for a long-delay communication transaction. It should be sufficient for both nodes to load the new code into memory and reconfigure themselves as each other. There is no performance loss since the host can still send one frame and receive one result in every D seconds, thus the throughput of the pipeline remains the same. Both nodes must consume some energy to refresh their code memory but they have al-
ready saved communication energy by eliminating a pair of communication transactions. Therefore the energy cost of the transition is also minimal, if not zero. For brevity the illustration is omitted for N > 2.
6 Experimental Results We evaluate the DVS techniques described in Section 5 by experiments then analyze the results in the context of a distributed, I/O-bound system.
6.1 (0A, 0B) Initial Evaluation without I/O Before experimenting DVS with I/O, we first perform two simple experiments on a single Itsy node to explore the potential of DVS without I/O. The single Itsy node reads local copies of the raw images and it only computes the results, instead of receiving images from the host and sending the results back. Therefore there is no communication delay or energy consumption involved. (0A): We use one Itsy node to keep running the entire ATR algorithm at the full speed 206.4 MHz. Its battery will exhaust in 3.4 hours with 11.5K frames completed. (0B): We setup the second Itsy node to execute at the half speed 103.2 MHz. Then it is able to continue operating for 12.9 hours by finishing 22.5K frames. At the half clock rate, the Itsy computer can complete twice workload as much as it can do at the full speed. We overload the metrics notation we defined in Section 4.5 as follows: T maps the experiment label to the total battery life, and F maps the experiment label to the number of frames processed. Here, T (0A) = 3.4 (hours), F(0A) = 11500. T (0A) = 12.9, F(0B) = 22500. Note that these results are not to be compared with other experiments, since there is no communication and no performance constraint. The results are promising for having more nodes as a distributed system. By using two Itsy nodes running at the half speed, the system should be able to deliver the same performance as one Itsy node at the full speed does, while completing four times the workload by using two batteries. However, such an upperbound can only be achieved without the presence of I/O.
6.2 (1) Baseline configuration We defined the baseline configuration in Section 5.1. The single Itsy node running at 206.4 MHz can last for 6.13 hours and finish 9.6K frames before the battery dies. That is T (1) = Tnorm (1) = 6.13, F(1) = 9600, R norm (1) = 100%. Compared with experiment (0A) without I/O, the completed workload is 17% less since the node must spend a long time during I/O. 7
Power
Node1
SE ND 1
PROC1
RECV1
PROC2
D
PROC2
RE CV 2
PROC2
Node2 sends inermediate result of frame I+1 to Node2
SEND 2
RE CV 2
Node2 sends inermediate result of frame I+2 to Node2
D
D RE CV 2
SEND 2
D
Node1 sends inermediate result of frame I-1 to Node2
Node2
Node1 sends final result of frame I+1 to destination
Node1 sends final result Idle time for of frame I reconfiguration to destination
Node1 receives frame I from source
SEND 2
Node2 sends final result of frame I-1 to destination
RECV1 Idle time for reconfiguration
PROC1
SE ND 1
RECV1
Node2 receives frame I+1 from source
PROC1
Node2 receives frame I+2 from source
SE ND 1
Time
Figure 9. Node rotation on two nodes.
6.3 (1A) DVS during I/O
6.4 (2) Distributed DVS by Partitioning
As Section 5.2 suggests, we apply DVS to I/O periods, such that during sending and receiving the Itsy node operates at 59 MHz, while in computation it still runs at 206.4 MHz. From our measurement communication delay does not increase at a lower clock rate. Thus the performance remains the same as D = 2.3 seconds. Through DVS during I/O, the battery life is extended to 7.6 hours and it is able to finish 11.9K frames. That is T (1A) = Tnorm (1A) = 7.6, F(1A) = 11900, R norm (1A) = 124%, indicating a 24% increase in battery life.
Since there is no further opportunities for DVS with the single node, from now we evaluate distributed configurations with two Itsy nodes in a pipeline. In Section 5.3 we selected the best partitioning scheme, in which two Itsy nodes operate at 59 MHz and 103.2 MHz, respectively. The distributed two-node pipeline is able to complete 22.1K frames in 14.1 hours. That is, T (2) = 14.1, F(2) = 22100. Compared to experiment (1), the battery life is more than doubled. However, after normalizing the results for two batteries, Tnorm (2) = 7.05, Rnorm (2) = 115%, meaning the battery life is only effectively extended by 15%. Distributed DVS is even less efficient than (1A), in which DVS during I/O can extend 24% of the battery capacity.
Note that F(1A) > F(0A) = 11500. Even though the Itsy node is communicating a large amount of data with the host computer, it completes more workload than it does in experiment (0A) without I/O. This is due to the recovery effect of batteries. Recovery effect indicates that if a battery continues experiencing a high discharge current, it capacity will exhaust sooner, as the results of (0A) and (1) show. On the other hand, if the discharge current can drop to a lower level, the lost capacity can be partially recovered. In this experiment (1A), the current level is reduced from 110 mA to 40 mA (Fig. 7) for 1.2 second in every 2.3 seconds. This allows the battery to “rest” after heavy discharge on computation and recover its capacity. As a result, the battery regains its capacity by 24%.
There are a few reasons behind the results. First, when Node2 fails, the pipeline simply stalls while plenty of energy still remains on the battery of Node1. Second, Node2 always fails first because the workload on the two nodes is not balanced very well. Node2 has much more computation load and it has to run at 103.2 MHz; while Node1 has very little computation such that it operates at 59 MHz. However, this partitioning scheme has already been optimal with the maximally balanced load. If we choose other partitioning schemes, the system will fail even sooner as analyzed in Section 5.3. 8
6.5 (2A) Distributed DVS during I/O
73.7 MHz, and Node2 at 118 MHz. We also perform DVS during I/O for both nodes. The result is, T (2B) = 15.72, F(2B) = 24500, Tnorm (2B) = 7.86 and R norm (2B) = 128%. With our recovery scheme, the system can last longer than (2) and (2A). However there is no significant improvement compared to the simple DVS during I/O scheme (1A). Since both nodes must run faster, Node2 will fail more quickly after completing 19.5K frames and Node1 can pick up another 5K frames until all batteries have exhausted. Power failure recovery allows the system to continue functioning with failed nodes. However it is expensive in a sense that it must be supported with additional, expensive energy consumption.
DVS during I/O (1A) can extend 24% battery life for a single node. We expect the distributed pipeline can also benefit from the same technique by applying DVS during I/O for distributed nodes. Among the two Itsy nodes, Node1 is already configured to the lowest clock rate. Therefore, we can only reduce the clock rate of Node2 to 59 MHz during its I/O period and leave it at 103.2 MHz for computation. The result is T (2A) = 14.44, F(2A) = 22600, Tnorm (2A) = 7.22 and R norm (2A) = 118%. Only 3% more battery capacity is observed comparing with experiment (2). Distributed DVS during I/O is not as effective as DVS during I/O for a single node. According to the power profile in Fig. 7, from (1) to (1A) the discharge current drops from 110 mA to 40 mA during I/O periods, which take the half of the execution time of the single node. However, from (2) to (2A), we only optimize for Node2 that has already operated at a low-power level during I/O (55 mA). By DVS during its I/O periods, the discharge current decreases to 40 mA. Thus, the 15 mA reduction is not as considerable compared with the 70 mA saving in experiment (1A). In addition, Node2 does not spend a long time during I/O. It only communicates 700 Bytes in very short periods. Therefore, the small reduction to a small portion of power use contributes trivially to the system. On the other hand, Node1 has heavy I/O load. However, since it runs at the lowest power level, there is no chance to further optimize its I/O power. From experiments (2) and (2A) we learn a few lessons. Although there are more distributed DVS opportunities whereas not available on a single processor, the energy saving is no longer decided merely by the processor speed. In a single processor, minimizing energy directly optimizes the life time of its single battery. However in a distributed system, batteries are also distributed. Minimizing global energy does not guarantee to extend the lifetime for all batteries. In our experiments, the load pattern of both communication and computation decides the shortest battery life, which often determines the uptime of the whole system.
6.7 (2C) Distributed DVS with Node Rotation Up to now the distributed DVS approaches do not seem effective enough. In experiment (2) and (2A), the failure of Node2 shuts down the whole system. Experiment (2B) allows the remaining Node1 to continue. However the power failure recovery scheme also consumes energy before it can save energy. What prevents a longer battery life is the unbalanced load between Node1 and Node2. In this new experiment we implemented our node rotation technique presented in Section 5.5, combined with DVS during I/O. Since there is no performance penalty, two nodes can still operate at at 59 MHz and 103.2 MHz. By node rotation in every 100 frames, the battery life can be extended to T (2C) = 17.82, F(2C) = 27900, Tnorm (2C) = 8.91 and R norm (2C) = 145%. This is the best result among all techniques we have evaluated. Node rotation allows the workload to be evenly distributed over the network thus maximally utilizes the distributed battery capacity. There is also an additional benefit. Since both nodes alternate their frequency between 103.2 MHz and 59 MHz, both batteries can take advantage of the recovery effect to further extend their capacity. To summarize, our experimental results are presented in Fig. 10. Both absolute and normalized battery lives are illustrated, with normalized ratios annotated. The results of experiments (0A) and (0B) without communication are not included since it is not proper to compare them with I/Obound results. It should be noted that the effectiveness of these techniques is application-dependent. Although experiment (2) and (2A) do not show much improvement in this case study, the corresponding techniques can still be effective to other applications.
6.6 (2B) Distributed DVS with Power Failure Recovery In experiments (2) and (2A), the whole distributed system fails after Node2 fails, although Node1 is still capable of carrying on the entire algorithm. We attempt to enable the system to detect the failure of Node2 and reconfigure the remaining Node1 to continue operating. Our approach is described in Section 5.4. We use the same partitioning scheme in (2) and (2A). Due to the additional communication transactions for control messages, both nodes have to run faster. As a result, Node1 must operate at
7 Conclusion This paper evaluates DVS techniques for distributed lowpower embedded systems. DVS has been suggested an effective technique for energy reduction in a single processor. As DVS opportunities diminish in communication-bound, 9
18
Battery Life (hour)
16 14 12 145% 10 124%
8
115%
118%
128%
100% 6 4 2 0 (1) Baseline
(1A) DVS during I/O
(2) Distributed (2A) (2B) (2C) DVS with Distributed Distributed Distributed partitioning DVS during I/O DVS with power DVS with node failure recovery rotation Absolute Normalized
Figure 10. Experiment results.
time-constrained applications, a distributed system can expose richer parallelism that allows further optimization for both performance and DVS opportunities. However, the designers must be aware of many tricky and often counterintuitive issues, such as additional I/O, partitioning, power failure recovery and load balancing, as indicated by our study. We presented a case study of a distributed embedded application under various DVS techniques. We performed a series of experiments and measurements on actual hardware with DVS under I/O-intensive workload, which is typically ignored by many DVS studies. We also proposed a new load balancing technique that enables more aggressive distributed DVS that maximizes the uptime of batterypowered, distributed embedded systems.
[2] K. Choi, K. Dantu, W.-C. Cheng, and M. Pedram. Framebased dynamic voltage and frequency scaling for a MPEG decoder. In Proc. International Conference on ComputerAided Design, pages 732–737, November 2002. [3] W. R. Hamburgen, D. A. Wallach, M. A. Viredaz, L. S. Brakmo, C. A. Waldspurger, J. F. Bartlett, T. Mann, and K. I. Farkas. Itsy: stretching the bounds of mobile computing. IEEE COMPUTER, 34(4):28–36, April 2001. [4] C. Im, H. Kim, and S. Ha. Dynamic voltage scaling technique for low-power multimedia applications using buffers. In Proc. International Symposium on Low Power Electronics and Design, August 2001. [5] M. Maleki, K. Dantu, and M. Pedram. Power-aware source routing protocol for mobile ad hoc networks. In Proc. International Symposium on Low Power Electronics and Design, pages 72–75, August 2002. [6] T. Okuma, T. Ishihara, and H. Yasuura. Real-time task scheduling for a variable voltage processor. In Proc. International Symposium on System Synthesis, pages 24–29, November 1999. [7] G. Quan and X. S. Hu. Energy efficient fixed-priority scheduling for real-time systems on variable voltage processors. In Proc. Design Automation Conference, pages 828– 835, June 2001. [8] D. Shin, J. Kim, and S. Lee. Low-energy intra-task voltage scheduling using static timing analysis. In Proc. Design Automation Conference, pages 438–443, June 2001. [9] E. F. Weglarz, K. K. Saluja, and M. H. Lipasti. Minimizing energy consumption for high-performance processing. In Proc. Asian and South Pacific Design Automation Conference, pages 199–204, 2002. [10] F. Yao, A. Demers, and S. Shenker. A scheduling model for reduced CPU energy. In IEEE Annual Foundations of Computer Science, pages 374–382, 1995.
Acknowledgment This research is sponsored in part by National Science Foundation under grant CCR-0205712 and DARPA PAC/C program under subcontract 4500942474 with Rockwell/Collins. Special thanks to HP Western Research Lab for providing Itsy Pocket Computers and technical assistance.
References [1] J. F. Bartlett, L. S. Brakmo, K. I. Farkas, W. R. Hamburgen, T. Mann, M. A. Viredaz, C. A. Waldspurger, and D. A. Wallach. The itsy pocket computer. Technical Report 2000/6, COMPAQ Western Research Laboratory, 2000.
10