Singer. 1966. MH Facility. 45. 2003. Undetermined. Indiana. Central State. 1848 ...... Wyoming. 6,038. 908. 15%. 17. UNITED STATES 3,514,211. 467,958. 13%.
STATE OF THE STATES IN DEVELOPMENTAL DISABILITIES 2013: THE GREAT RECESSION AND ITS AFTERMATH
David Braddock, Richard Hemp, Mary C. Rizzolo Emily Shea Tanis, Laura Haffer, Amie Lulinski, Jiang Wu Department of Psychiatry and Coleman Institute UNIVERSITY OF COLORADO and Department of Disability and Human Development UNIVERSITY OF ILLINOIS AT CHICAGO
Published in Collaboration with AMERICAN ASSOCIATION ON INTELLECTUAL and DEVELOPMENTAL DISABILITIES (AAIDD)
The State of the States in Developmental Disabilities
DISTRIBUTED IN COLLABORATION WITH
THE AMERICAN ASSOCIATION ON INTELLECTUAL AND DEVELOPMENTAL DISABILITIES Washington, DC 2013 Copyright © 2013 by David L. Braddock All rights reserved
This report was supported, in part, by a cooperative agreement from the Administration on Intellectual and Developmental Disabilities, Administration for Community Living, United States Department of Health and Human Services. Grantees undertaking projects under government sponsorship are encouraged to express freely their findings and conclusions. Points of view or opinions do not, therefore, necessarily represent official Administration on Intellectual and Developmental Disabilities policy.
www.stateofthestates.org
ii
Contents TABLES AND FIGURES.................................................................................................... vi ACKNOWLEDGMENTS .................................................................................................... ix
THE STATE OF THE STATES IN DEVELOPMENTAL DISABILITIES: 2013 I. INTRODUCTION ............................................................................................................... 1 II. APPROACH ...................................................................................................................... 2 Data Collection ............................................................................................................... 2 State Survey Instruments ........................................................................................ 4 National Data Sources ............................................................................................. 4 Data Analysis .................................................................................................................. 5 Financially-Focused Analyses ................................................................................. 5 Participant-Focused Analyses ................................................................................. 6 III. NATIONAL TRENDS IN I/DD SPENDING ....................................................................... 6 Trends in Spending by State: FY 2009-11 ...................................................................... 7 Change in Inflation-Adjusted Spending, 2009, 2010, and 2011………………………. .... 8 Comparative Analysis of Institutional and Community Services………………………... 11 Growth in Community Resources and Institutional Spending Reductions ............. 12 IV. FISCAL EFFORT IN THE STATES ................................................................................ 14 V. OUT-OF-HOME RESIDENTIAL PLACEMENTS ............................................................ 17 Cost by Setting: 2011 ................................................................................................... 20 VI. PUBLIC AND PRIVATE INSTITUTIONS........................................................................ 22 State-Operated Institutions ........................................................................................... 23 Closures of State-Operated Institutions ................................................................. 24 Public Spending Per Person in Institutions ................................................................... 28 Privately-Operated Institutions ...................................................................................... 29 Nursing Facilities........................................................................................................... 29 Data Sources ......................................................................................................... 29 Census by State .................................................................................................... 30 VII. COMMUNITY SERVICES AND SUPPORTS ................................................................. 31 Significance of Medicaid in Community Living .............................................................. 31 The Medicaid ICF/ID Program ............................................................................... 31 The Medicaid HCBS Waiver .................................................................................. 32 Nationwide Study of 88 Medicaid HCBS Waivers ................................................. 33 Most I/DD Spending is Medicaid ............................................................................ 37 Other Sources of Revenue for Community Services and Supports ....................... 38 Federal Funds ........................................................................................................ 39 Local/County Funding ............................................................................................ 40 Individual and Family Support....................................................................................... 40 Self-Advocacy and Individual and Family Support ................................................ 42 Supported Living and Personal Assistance .................................................................. 41 Summary of Trends ............................................................................................... 42
iii
Supported Employment ................................................................................................ 44 History of Employment Services ............................................................................ 45 Cost Benefit ........................................................................................................... 46 Employment on the National Scene ...................................................................... 47 Proportion of Workers in Supported Employment Declines ................................... 48 Family Support Services ............................................................................................... 51 Keeping Family Members with Disabilities at Home .............................................. 52 Family Support Spending Remains a Small Fraction of Total I/DD Spending ....... 53 The HCBS Waiver’s Role in Family Support ......................................................... 54 Unmet Need for Family Support………………………………………………............ 56 VIII. DEMAND FOR SERVICES AND SUPPORTS ............................................................ 57 Aging Caregivers .......................................................................................................... 57 Increased Longevity ...................................................................................................... 59 Waiting Lists in the States ............................................................................................ 61 Direct Support Professionals Wage Issues................................................................... 61 Recent Community Services Litigation ......................................................................... 63 Olmstead Cases .................................................................................................... 65 Waiting List Cases ................................................................................................. 68 Access to Benefits Cases ...................................................................................... 69 Assistive Technology Initiatives .................................................................................... 70 Emerging Smart Home Technology………………………………………...... ........... 71 The Coleman Institute for Cognitive Disabilities .................................................... 71 Recent Federal Initiatives ...................................................................................... 73 IX. DISCUSSION AND CONCLUSION ............................................................................. 76 I/DD Spending Growth Continues to Slow Down .......................................................... 76 Fiscal Effort Falls in 2011.............................................................................................. 76 Declining Use of Public/Private Institutions................................................................... 77 Expansion of Community Services ............................................................................... 77 Commitment to Supported Living Varies Across States ........................................ 77 Proportion of Workers in Supported Employment Continues to Decline ............... 77 Families Supported Declines ................................................................................. 78 Significance of Medicaid HCBS Waivers…………………………………. ...................... 78 Federal Efforts to Address State Budget Deficiencies .................................................. 78 Efforts to Address the Federal Budget Crisis ................................................................ 80 The Fiscal Cliff .............................................................................................................. 81 Rising Economic Insecurity in the U.S. ......................................................................... 82 International Developments: The UN Convention......................................................... 82 Conclusion .................................................................................................................... 83
REFERENCES CITED ...................................................................................................85 STATE AGENCY DATA COLLABORATION ...................................................................... 94 STATE PROFILES .................................................................................................................. 99
iv
PART II: STATE PROFILES ALABAMA ......................................................................................................................................... 100 ALASKA............................................................................................................................................. 102 ARIZONA .......................................................................................................................................... 104 ARKANSAS ....................................................................................................................................... 106 CALIFORNIA ..................................................................................................................................... 108 COLORADO ...................................................................................................................................... 110 CONNECTICUT ................................................................................................................................ 112 DELAWARE ...................................................................................................................................... 114 DISTRICT OF COLUMBIA ................................................................................................................ 116 FLORIDA ........................................................................................................................................... 118 GEORGIA .......................................................................................................................................... 120 HAWAII .............................................................................................................................................. 122 IDAHO ............................................................................................................................................... 124 ILLINOIS ............................................................................................................................................ 126 INDIANA ............................................................................................................................................ 128 IOWA ................................................................................................................................................. 130 KANSAS ............................................................................................................................................ 132 KENTUCKY ....................................................................................................................................... 134 LOUISIANA ....................................................................................................................................... 136 MAINE ............................................................................................................................................... 138 MARYLAND ...................................................................................................................................... 140 MASSACHUSETTS .......................................................................................................................... 142 MICHIGAN ........................................................................................................................................ 144 MINNESOTA ..................................................................................................................................... 146 MISSISSIPPI ..................................................................................................................................... 148 MISSOURI ......................................................................................................................................... 150 MONTANA ........................................................................................................................................ 152 NEBRASKA ....................................................................................................................................... 154 NEVADA ............................................................................................................................................ 156 NEW HAMPSHIRE............................................................................................................................ 158 NEW JERSEY ................................................................................................................................... 160 NEW MEXICO ................................................................................................................................... 162 NEW YORK ....................................................................................................................................... 164 NORTH CAROLINA .......................................................................................................................... 166 NORTH DAKOTA .............................................................................................................................. 168 OHIO ................................................................................................................................................. 170 OKLAHOMA ...................................................................................................................................... 172 OREGON .......................................................................................................................................... 174 PENNSYLVANIA ............................................................................................................................... 176 RHODE ISLAND ............................................................................................................................... 178 SOUTH CAROLINA .......................................................................................................................... 180 SOUTH DAKOTA .............................................................................................................................. 182 TENNESSEE ..................................................................................................................................... 184 TEXAS ............................................................................................................................................... 186 UTAH ................................................................................................................................................. 188 VERMONT ........................................................................................................................................ 190 VIRGINIA ........................................................................................................................................... 192 WASHINGTON .................................................................................................................................. 194 WEST VIRGINIA ............................................................................................................................... 196 WISCONSIN ...................................................................................................................................... 198 WYOMING ........................................................................................................................................ 200 UNITED STATES .............................................................................................................................. 202 APPENDIX I: State, County and Local Funds Potentially Available to Match Federal Medicaid Funding, by State: FY 2011 .............................................................................................................. 204
v
Tables and Figures in Part I TABLES Table 1. Table 2. Table 3. Table 4. Table 5. Table 6. Table 7. Table 8. Table 9. Table 10. Table 11. Table 12. Table 13. Table 14. Table 15. Table 16. Table 17. Table 18. Table 19. Table 20. Table 21. Table 22. Table 23.
Budget Categories/Variables for State Spending/Data Collection .............................. 2 Key Program/Participant Categories for Data Collection ............................................ 3 Public I/DD Spending for Community Services in the States: FY 2009-11 ................. 8 Adjusted Percentage Change in Spending by Setting .............................................. 10 Fiscal Effort for I/DD Services: Percent Change FY 2009-11 ................................... 15 State Fiscal Effort Rankings FY 2009 and FY 2011 .................................................. 16 Persons with I/DD in Out-of-Home Residential Settings By Size of Setting and State: FY 2011 ...................................................................... 18 Utilization Rate by Individuals with I/DD in Settings for Six or Fewer Persons and Seven or More Persons...................................................................................... 20 Annual Cost of Care Per Person in Six Residential Settings: FY 2011 ..................... 21 Average Daily Residents of State-Operated16+ I/DD Institutions: FY 2009-11 ........ 24 Completed and In-Progress Closures of State-Operated 16+ Institutions in the United States: 1970-2020 (n=166) ......................................... 26 Average Daily Spending Per Person in State-Operated Institutions ......................... 28 Residents with I/DD in Nursing Facilities by State: FY 2009-11 ................................ 30 The Home and Community Based Services (HCBS) Waiver: I/DD Participants and Spending in FY 2011 .............................................................. 35 Medicaid Funds Constitute 77% of Total I/DD Spending in the States ..................... 38 Local Government I/DD Spending: FY 2011 ............................................................. 40 Supported Living/Personal Assistance Programs in the States: I/DD Participants and Spending in FY 2009 .............................................................. 43 State I/DD Agency Supported Employment Programs in the States: Participants and Spending in FY 2011 ...................................................................... 50 Family Support Programs in the States: I/DD Participants and Spending in FY 2011 .............................................................. 55 Estimated Number of I/DD Caregiving Families Compared to Families Supported by State I/DD Agency Funds FY 2011 ...................................... 56 Estimated Number of Persons with I/DD Living with Aging Caregivers in 2011 ........ 60 Selected Community I/DD Services Litigation in the States: 2009-2012 ................... 64 42 States with Budget Gaps in Fiscal Year 2012 ...................................................... 79
FIGURES Figure 1. Annual Percentage Change in Inflation-Adjusted State General Fund Spending FYs 1979-2013: U.S. .................................................. 1 Figure 2. Annual Percentage Change in Total I/DD Spending in the U.S.: 1978-2011 .............. 6 Figure 3. Annual Percentage Change in I/DD Community and Institutional Spending in the U.S.: 1978-2011 ............................................................. 7 Figure 4. United States I/DD Spending by Service Category: FY 2011 ..................................... 7 Figure 5. 24 States Reduced Total Inflation-Adjusted I/DD Spending During 2009-11 .............. 9 vi
Figure 6. Trends in I/DD Spending Using Six or Fewer Persons to Define Community Services: FY 1977-2011 ............................................................. 13 Figure 7. Fiscal Effort for I/DD Services in the United States: FY 1977-2011 .......................... 14 Figure 8. Out-of-Home Residential Placements in the U.S. by Setting: FY 2009 & FY 2011 ... 17 Figure 9. Number of Persons with I/DD Residing in Settings for Six or Fewer Persons: FY 1960-2011 ....................................................................... 19 Figure 10. Persons Served in Public and Private Institutions and Nursing Facilities in the United States: FY 1990-2011 .......................................................................... 23 Figure 11. Cumulative Number of Completed and In-Progress Closures of State-Operated 16+ Institutions in the United States: 1960-2020 ............................. 25 Figure 12. Public Spending Per Person in State-Operated 16+ Institutions in the United States: FY 1977-2011 .......................................................................... 29 Figure 13. Federal-State I/DD Spending for HCBS Waiver, ICF/ID, and Related Medicaid in the U.S.: FY 1977-2011 ......................................................................... 31 Figure 14. Components of Federal-State I/DD Medicaid Spending in the U.S.: FY 1977-2011 . 33 Figure 15. Federal-State Medicaid is the Majority of Total I/DD Spending in FY 2011 .............. 36 Figure 16. Federal Medicaid I/DD Long-Term Care Spending as a Percentage of Total Federal Medicaid Spending in the U.S.: FY 1977-2011 ................................... 37 Figure 17. Community Services Revenue Sources: FY 2011 .................................................... 39 Figure 18. Individuals with I/DD in Day Programs, Workshops and Employment: 1988-2011 ... 49 Figure 19. Persons with I/DD: Percentage of Total Day/Work Recipients in Supported Employment: FY 1988-2011 ................................................................ 49 Figure 20. Federal Medicaid Funding for Day Programs and Supported Employment: ............. 51 Figure 21. Family Support Spending and Number of Individuals Supported in the Family Home: FY 1990-2011 ......................................................... 53 Figure 22. Inflation-Adjusted Spending for Family Support Services, FY 1986-2011 ................ 54 Figure 23. Estimated Number of I/DD Caregiving Families and Families Supported by I/DD Agencies....................................................................... 57 Figure 24. Growing Numbers of Americans Aged 65+ Years: 2000-2050 ................................. 58 Figure 25. U.S.: Estimated Distribution of Individuals with I/DD by Living Arrangement, 2011 .. 58 Figure 26. United States: Estimated Number of Individuals with I/DD by Age Group Living with Family Caregivers: 2011 .................................................. 58 Figure 27. Hourly Wages in 2011 ............................................................................................... 63 Figure 28. Prevalence of Cognitive Disability in the U.S., 2012 ................................................. 72 Figure 29. Average Annual Percentage Change in Inflation-Adjusted I/DD Spending by Decade: U.S.. ............................................................................... 76 Figure 30. Aggregate State Budget Gaps 2002-13: Last Recession Compared to the "Great Recession" of 2007-09.. ................................................................................. 78 Figure 31. Real Change in Gross Domestic Product: By Quarter, January 2001-September 2012 ................................................................................. 81
vii
viii
ACKNOWLEDGMENTS This edition of The State of the States in Developmental Disabilities extends our study with two additional years of data for Fiscal Years 2010 and 2011. It provides an analysis of 35 continuous years of data spanning 1977-2011. Financial and programmatic data collected in this cycle of the study were provided by 174 intellectual and developmental disabilities, Medicaid, and health and human services staff in the 50 states and the District of Columbia. These individuals are listed following the references cited section on page 95. We deeply appreciate their states' continuing collaboration with our project and the exceptional support of the states' directors of developmental disabilities services in the 50 states and the District of Columbia. The support of the National Association of State Directors of Developmental Disabilities Services, their Director Nancy Thaler and Associate Director Charles Moseley, is greatly appreciated as well. The Arc United States, led by Peter Berns, Executive Director, and Ann Cameron Williams, Chief Research and Innovations Officer, and the American Association on Intellectual and Developmental Disabilities, led by Margaret Nygren, are also acknowledged for their key roles in the widespread dissemination of this monograph. The State of the States in Developmental Disabilities Project is funded in part as a Project of National Significance by the Administration on Intellectual and Developmental Disabilities (AIDD) in the U.S. Department of Health and Human Services. In addition, significant resources are contributed by the Universities of Colorado and Illinois at Chicago. We acknowledge AIDD Commissioner Sharon Lewis' support and that of our dedicated and supportive AIDD project officer, Katherine Cargill-Willis. Financial and administrative support for the project is also provided by the University of Colorado Anschutz School of Medicine's Department of Psychiatry, by the Coleman Institute for Cognitive Disabilities, and by the University of Illinois at Chicago's Department of Disability and Human Development. Professors Mary Kay Rizzolo, Glenn Fujiura, Tamar Heller, and Tia Nelis, at the University of Illinois at Chicago's Department of Disability and Human Development, have participated extensively in the Project for many years. Martha King at the Denver-based National Conference of State Legislatures contributes as well through a subcontract for Project dissemination activities to state legislators nationally. We thank Mary Ellen Morse for office management and general support of project activities in Boulder. The preliminary version of this monograph was distributed for review and comment to state I/DD Agency Directors nationwide and to a national audience of 440 attendees at the Coleman Institute's 12th Annual Conference on Cognitive Disability and Technology held on November 2, 2012 in Colorado.
David Braddock, Ph.D., Coleman-Turner Chair and Professor in Psychiatry, University of Colorado Denver School of Medicine Associate Vice President, University of Colorado and Executive Director, Coleman Institute January 31, 2013 http://stateofthestates.org
ix
x
STATE OF THE STATES IN DEVELOPMENTAL DISABILITIES 2013: THE GREAT RECESSION AND ITS AFTERMATH I. INTRODUCTION
spending drops in 35 years. State general fund spending increased 1.0% in 2011 and a marginal 0.4% in 2012, then dropped again by 0.4% in 2013 (Figure 1). The Great Recession was qualitatively different from the 1981-82 recession in that the labor market decline was both deeper and longer (Hoynes, Miller & Schaller, 2012; Katz, 2010). During the 1981-82 recession, aggregate state general fund expenditures declined by 3.7% in 1982 and 2.4% in 1983, less than state general fund reductions in the Great Recession (as noted, 6.4% and 6.2% in 2009 and 2010, respectively) (National Governors Association, 2012). The partial economic recovery in 2011 and 2012 fell far short of past recessions' recoveries. The unprecedented reductions in state general fund spending and the unusually weak economic recovery have made it critically important to monitor the impact of the Great
Percent Real Change in State General Funds
This monograph presents the results of our continuing study of trends in spending for intellectual and developmental disabilities (I/DD) long-term care services and supports in the United States. The study adds fiscal years (FYs) 2010 and 2011 to our ongoing monitoring of the economic impact of the Great Recession and its aftermath. The extended data set encompasses FYs 1977-2011. The Great Recession began in December 2007 and ended June 2009 (National Bureau of Economic Research, 2012). During the Great Recession, the inflation-adjusted gross domestic product (GDP) fell 5.0% (U.S. Department of Commerce, 2012a). The end of the housing bubble caused approximately four million families to lose their homes. Another four and a half million homes either entered foreclosure or their owners became delinquent in mortgage payments (Financial Crisis Inquiry Commission, 2011). Figure 1 National consumption fell ANNUAL PERCENT CHANGE IN INFLATION-ADJUSTED 2% below pre-recession STATE GENERAL FUND SPENDING IN THE U.S.: FYs 1979-2013 levels (Petev, Pistaferri & 9% Eksten, 2011). 8% 7% 6.5% State general fund 6% 5% expenditures are critical to 4.0% 3.8% 4% 3.5% I/DD long term services 3% 2.0% 2% and supports; they match 1.0% 1% federal Medicaid reim0% -1% -0.4% bursement for Home and -2% Community-Based Serv-3% -6.2% -4% -3.6% -3.7% ices (HCBS) Waivers and -5% -6% other community Medicaid -7% -6.4% programs. -8% -9% Adjusted state general 79 81 83 85 87 89 91 93 95 97 99 01 03 05 07 09 11 13 80 82 84 86 88 90 92 94 96 98 00 02 04 06 08 10 12 fund spending in the U.S. Fiscal Year declined 6.4% in 2009 and Source: Natio nal Governors Association and National Association of State Budget Officers (Spring 2012) 79-11 are "actual" state expenditures; 2012 is "estimated"; and 2013 is "recommended." 6.2% in 2010, the largest
1
State of the States in Developmental Disabilities: 2013
Recession and its aftermath on long-term services and supports for persons with I/DD and their families. II. APPROACH
Table 1
BUDGET CATEGORIES/VARIABLES FOR STATE SPENDING/DATA COLLECTION I. COMMUNITY SERVICES FUNDS A. COMMUNITY SERVICES (15 OR FEWER PERSONS)
Data Collection We collected new intellectual and developmental disabilities (I/DD) financial and programmatic data from the states for FYs 2010 and 2011.1 This extended our overall longitudinal analysis of trends in the United States across the entire 35-year period from 1977 to 2011. Data collection procedures included: 1) acquisition and analysis of budget and program documents from each state and the District of Columbia (DC); 2) development of 51 specialized state survey instruments reflecting the fiscal and programmatic idiosyncrasies of each state and DC; 3) implementation of these surveys in all states and DC; and 4) extensive collaboration with state agency officials to obtain, verify, and interpret the I/DD financial and programmatic data collected. Federal, state, and local program/budget categories employed in our analysis are outlined in Table 1. This taxonomy is the basis both for the survey instruments we constructed for each state, and for our comparative state-by-state statistical analyses. In addition to the federal, state, and local revenue and expenditure categories specified in Table 1, specialized data sets for spending, revenue, and participant data were collected for family support, supported living, and supported employment in each state, along with revenue and participant data for day and work programs. A specialized data set for participants in residential services by size of
1. STATE FUNDS a. General Funds b. Medicaid Match c. Other State Funds d. Local Funds e. SSI State Supplement Funds 2. FEDERAL FUNDS 1 a. Public ICF/ID (≤15 persons) b. Private ICF/ID (≤15 persons) c. HCBS Waiver d. Other Medicaid Services 1. Rehabilitative Services 2. Clinic Services 3. Targeted Case Management 4. Personal Care Services 5. Administrative, Other Community Services e. Title XX/Social Services Block Grant f. Other Federal Funds 1. Temporary Assistance for Needy Families (TANF) 2. Other Federal Funds g. SSI and Adult Disabled Child (ADC) benefits for HCBS Waiver Participants
II. INSTITUTIONAL SERVICES FUNDS A. PUBLIC 16+ INSTITUTIONS 1. STATE FUNDS a. General Funds b. ICF/ID Medicaid Match c. Other State Funds d. Local Funds 2. FEDERAL FUNDS a. Federal ICF/ID b. Title XX/Social Services Block Grant c. Other Federal Funds
B. PRIVATE 16+ INSTITUTIONS 1. STATE FUNDS a. General Funds b. ICF/ID Medicaid Match c. Other State Funds 2. FEDERAL FUNDS a. Federal ICF/ID b. Other Federal Funds 1
Formerly "ICF/MR," hereafter ICF/ID
Sources: Braddock (1981, 2002a); Braddock, Hemp, & Fujiura (1987).
setting was also collected to generate cost of care statistics specifically tied to the financial data we collected (Table 2).2
1
Unless otherwise noted, all years refer to states' fiscal years that run July 1 through June 30. Exceptions are Alabama, the District of Columbia, and Michigan (October 1 - September 30); New York (April 1 - March 31); and Texas (September 1 - August 31).
2
2
For additional information on I/DD residential services and supports, see research by Sheryl Larson and colleagues at: www.ici.umn.edu/
State of the States in Developmental Disabilities: 2013
Table 2 KEY PROGRAM/PARTICIPANT VARIABLES FOR DATA COLLECTION I. COMMUNITY RESIDENTIAL SETTINGS (1-6 PERSONS) A. Public ICFs/ID B. Private ICFs/ID C. Supported Living D. Personal Assistance E. Other residential settings (Group homes, apartments, foster, host homes) II. COMMUNITY RESIDENTIAL SETTINGS (7-15 PERSONS) A. Public ICFs/ID B. Private ICFs/ID C. Other residential settings for 7-15 persons III. DAY/WORK PROGRAM PARTICIPANTS A. Sheltered employment/work activity B. Day habilitation ("day training") C. Supported/competitive employment IV. HCBS WAIVER PARTICIPANTS V. PUBLIC & PRIVATE INSTITUTIONAL SETTINGS (16+ PERSONS) A. State-operated institutions B. Private ICFs/ID C. Other private residential facilities D. Nursing facility residents with I/DD Sources: Braddock (1981, 2002a); Braddock, Hemp, & Fujiura (1987).
Numerous methodological problems are encountered in any comparative, longitudinal, nationwide study of public spending. In this study, four empirical problems were confronted in regard to state budgets used in the states (Braddock, Hemp, & Fujiura, 1986; 1987): 1) the wide variety of budgeting systems (e.g., program budgets vs. line-item budgets); 2) several types of capital, equipment, and debt service budgeting methods and varied budgeting practices for fringe benefit costs; 3) the varied reliability of the spending figures reported in official state budget documents (i.e., whether the budget reported actual expenditure, revised appropriations, governor's recommendation, or legislative request data); and, 4) the difficulty of disaggregating state, federal, and local funds reported in states' executive budget documents. Fiscal data available in program budgets are frequently unavailable or available only in part in line-item budgets. Comparative nationwide financial studies are thus constrained by the lowest common denominator; that is, by the amount of detail in the least
detailed state budget. As noted, extensive interpretive contact is required with state agency officials to supplement budget document analysis. Access to state agency administrative records also is typically required. Several types of capital, equipment, and debt service budgeting methods are used in the 50 states and DC. A number of states integrate these expenditures into their regular operating budgets, and these amounts have to be carefully extracted from operating expenditures to ensure comparability across states. In addition, fringe benefit costs for state employees are often reported separately from I/DD agency budgets. These nontrivial sums, which can exceed 20-25% of state agencies’ personnel budgets, must be obtained directly from other state agencies, (e.g., personnel management agencies), and subsequently aggregated with I/DD operating expenditures managed by the principal I/DD state agency. A third methodological problem stems from the different levels of reliability in the spending figures reported in official state budget documents. The stability of a reported spending figure depends upon the stage of the budget process in which it is captured. Gubernatorial recommended or requested figures are subject to substantial change because they are subsequently reviewed and often modified by legislative appropriation committees. Actual expenditures are not subject to change and represent fixed values after the official closing of the books. Actual expenditures are generally available within two years of the initial appropriation. Intermediate stage spending data include revised appropriations and obligations, the latter reflecting legally binding financial commitments incurred by an agency. Revised appropriations figures are adjusted periodically during and after the fiscal year in which the funds were originally appropriated.
3
State of the States in Developmental Disabilities: 2013
Data used for the analysis of trends in I/DD state spending should be based on actual expenditures and obligations, or, at a minimum, revised appropriations. As we completed different iterations of this study over the years, we worked closely with the states to continuously revise and improve the reliability of prior years' data. State executive budget documents typically provide three years of data. Most governors' executive budgets for FY 2011 were published in early calendar year 2010. They typically presented actual expenditure data for FY 2009, revised appropriations for 2010, and the governor’s recommendation or legislative request for 2011. In some states, the budgets provide some detail on I/DD institutional and community services spending and related performance measures including participant data. However, useful budget detail in gubernatorial executive budgets is the exception, not the rule. We must obtain fiscal and programmatic data via statespecific survey instruments, and through ongoing communication with state I/DD, Medicaid, and social services agency officials. Altogether, the methodological problems noted above pose significant challenges, as Caiden (1978) warned over 30 years ago, referencing the extensive time and labor it takes to complete a comprehensive and accurate nationwide study of public spending. State Survey Instruments Initial contact with a given state is preceded by inspection of the state’s published executive budget documents, and review of acquired programmatic and financial documents including material from our data collection efforts in previous years. Interviews with state I/DD agency personnel help guide development of a fiscal classification system that is sensitive to each state’s budgeting terminology. The project’s survey instruments include electronic spreadsheets that are sufficiently
4
detailed to reflect each state’s unique budget structure, and are consistent with the study’s classification categories (Table 1, page 2). Reliability of the classification of I/DD revenue and spending data into the various classification categories by our project's data collection specialists has been demonstrated to be strong (Braddock & Fujiura, 1991). Winer’s (1971) unbiased intra-class correlation coefficients were determined to be between .88 and 1.00 for the classification process. At the outset of each data collection cycle, each state is provided with a guide containing definitions and instructions along with three data collection instruments. The first, for revenue and expenditure data, is structured according to the classification categories outlined in Table 1 (page 2); a second is for data on the number of participants in residential programs as outlined in Table 2 (page 3); and a third is for spending, revenue, and participant data on services to support individuals living in the family home (family support), supported living/personal assistance, and day/work programs including supported employment activities.3 Data are also collected on technology support--however a limited number of states were able to respond in this data collection effort. The data we collect on family support, supported living, and supported employment are all subsets of the broader category of community services spending, and supported living participant data are a subset of residential services data. National Data Sources Some state-by-state data utilized in this study were obtained from national sources. For example, Supplemental Security Income (SSI) and SSI state supplement data were obtained from Social Security Statistical Supplements (Social 3
For more extensive data on employment services for persons with I/DD, see research by John Butterworth and colleagues at: www.statedata.info
State of the States in Developmental Disabilities: 2013
Security Administration, 2011) and employed in our profiles of the states. Also, to augment and cross-check some of the Medicaid Intermediate Care Facility for Persons with Intellectual Disabilities (ICF/ID) and Home and Community Based Services (HCBS) Waiver data we collected from state I/DD agencies, we utilized Medicaid Statistical Information System (MSIS) beneficiary data, CMS-64 expenditure, and CMS372 Waiver data (Centers for Medicare and Medicaid Services, 2011; Eiken, Sredl, Burwell, & Gold, 2011). Data for persons with I/DD in nursing facilities in some states were based on the Centers for Medicare and Medicaid Services (CMS) Online Survey, Certification and Reporting (OSCAR) data set (e.g., American Health Care Association, 2012). In various analyses, we also employed census, demographic, income, and poverty data (Assistant Secretary for Planning and Evaluation, 2012; U.S. Census Bureau, 2012); statewide aggregate personal income (U.S. Department of Commerce, 2012c); and, states’ general fund expenditures (National Governors Association and National Association of State Budget Officers, 2012). In this 2013 edition, we made a special effort to identify, evaluate, and sometimes revise missing or non-incremental budgetary and participant data across the 35-year span of the project. This entailed collaboration with state I/DD agencies to obtain, where possible, revised historical data of improved quality and validity. Data Analysis We examined data collected to determine the presence or absence of financial and participant trends within each state and across the nation. The 42 key program/budget data collection categories presented in Table 1 (page 2) and the 20 program/participant data categories in Table 2 (page 3) enabled us to analyze the structure and financing of institutional and community services for the 50 states and DC as well as for the nation as a whole.
Financially-Focused Analyses Public spending for institutional and community services was summarized by level of government (federal, state, and local) and by revenue source. Institutional spending supported publicly and privately-operated ICF/ID-certified and non-ICF/ID facilities for 16 or more persons. (Nursing facility spending was not included in this analysis.) Community services spending included residential and non-residential services for 1-15 persons. This included publicly and privately-operated ICFs/ID; Medicaid Home and Community Based Services (HCBS) Waiver funds; and, other federal, state, or local funding for a wide range of residential services and supports including group homes, apartments, foster homes, supported living/personal assistance, as well as non-residential community supports. Analyses were also completed on spending in the states for individual and family support (i.e., supported living/personal assistance, supported employment, and family support). A consistent method of estimating the impact of inflation on I/DD spending in the states was utilized: The State and Local Government Sub-Index of The Gross Domestic Product (GDP) Government Consumption Expenditure (U.S. Department of Commerce, Bureau of Economic Analysis, 2012b). The 2005 and 2006 inflation rates were the highest in over 20 years, at 5.3% and 5.8%, respectively. The inflation rate then dropped slightly to 4.8% in 2007 before increasing to 5.7% in 2008. During the Great Recession, inflation rates plummeted to 2.5% in 2009, 0.4% in 2010, and 3.1% in 2011. The 2010 inflation rate was the lowest level in the 35-year history of our study. Fiscal effort, defined as I/DD spending as a share of aggregate statewide personal income (U.S. Department of Commerce, 2012c) was computed for each state, DC, and the U.S. for: a) community settings; b) public and private 16+ institutional settings; and c) total I/DD spending in the states.
5
State of the States in Developmental Disabilities: 2013
III. NATIONAL TRENDS IN I/DD SPENDING
Participant-Focused Analyses
Percent Real Change
We collected participant data in terms of Recent annual growth rates for total I/DD average daily participants on a fiscal year basis for 24-hour residential services and spending in the U.S. were 1.0% in FY 2006, supported living; full-time equivalent partici- 2008, and 2010, and -0.2% in FY 2011 pants for day programs, supported employ- (Figure 2). These rates were the slowest ment, and the HCBS Waiver; and undupli- annual growth rates in I/DD spending in our cated participants in family support. Com- 35 year span of data collection. In fact, total pared to end-of-year or point-in-time data, public spending for I/DD services in the U.S. these data produce more accurate daily cost- increased by only 2.0% during 2009-11. Annual percentage change in I/DD community of-care statistics. We computed the average cost of care by and institutional spending is illustrated in state in: a) public and private institutions for Figure 3 (page 7). Real spending for the 16+ persons; b) public and private ICFs/ID for community services component of total I/DD 15 or fewer persons; and c) supported living spending advanced 0.3% in 2011--the slowest settings. Participant utilization rates (per one-year growth rate since the study began. citizen of the state general population) were Public and private institutional spending for also computed for public institutions and non- persons in 16+ settings continued the decline specialized nursing facilities, for residential that began in 1992, falling 3.2% in 2011. The settings for 7-15 persons, for residential proportion of total U.S. public I/DD spending settings for six or fewer persons, and for the allocated for 15 person or fewer community services versus 16+ institutional services HCBS Waiver program. In other analyses, we estimated the num- increased from 84% in 2009 to 85% in 2011. ber of persons with I/DD living with aging caregivers in each state and nationally, identiFigure 2 fied completed and inANNUAL PERCENTAGE CHANGE IN progress state-operated TOTAL I/DD SPENDING IN THE U.S.: FY 1978-2011 12.0% institutional closures in 11.2% the states, summarized 10.0% recent developments in I/DD-relevant litigation 8.0% 7.1% in the states through 7.0% 6.6% 2012, determined the 6.0% proportion that Medicaid constituted of total 4.0% 3.3% I/DD spending in each 2.4% 2.3% 1.9% state, and estimated 1.6% 2.0% 1.0% 1.0% funds potentially available for matching ad0.0% -0.2% ditional federal Medicaid reimbursement. -2.0% 80
78 79
82 81
84 83
86 85
88 87
90 89
94 96 98 00 02 04 06 08 10 93 95 97 99 01 03 05 07 09 11 Fiscal Year
92 91
Source: Braddock et al., University of Colorado, Department of Psychiatry and Coleman Institute, 2013.
6
State of the States in Developmental Disabilities: 2013
Figure 3 ANNUAL PERCENTAGE CHANGE IN I/DD COMMUNITY AND INSTITUTIONAL SPENDING IN THE U.S.: FY 1978-2011 20% Community Services Institutional 16+
Percent Inflation-Adjusted Change
17.0% 15%
13.8%
10.3% 10%
9.1% 9.2%
5.9%
5.7%
5%
3.6%
5.5% 3.1% 0.8%
1.9%
0%
0.3%
-0.7% -3.2% -5%
-3.5%
-3.7%
-4.0%
-5.5% -10% 78
80 79
82 81
84 83
86 85
88 87
90 89
92 91
94 93
96 95
98 97
00 99
02 01
04 03
06 05
08 07
10 09
11
Fiscal Year Source: Braddock, et al., Coleman Institute and Department of Psychiatry, University of Colorado, 2013. NOTE: Community services spending includes 15 or fewer person settings; Institutional services includes public and private 16+ person institutions; excludes nursing facility spending.
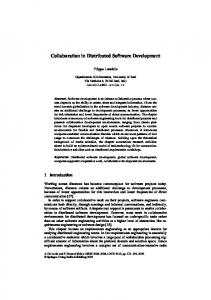
Figure 4 UNITED STATES I/DD SPENDING BY SERVICE CATEGORY: FY 2011
settings serving 16 or more persons per setting (3%). Individual and family support services (IFS; i.e., family supports, supported living, and supported employment) combined constituted 21.2% of total I/DD spending in 2011. By far the largest IFS component was supported living and personal assistance ($7.15 billion). This was 13% of total I/DD spending. Family support amounted to $4.03 billion, 7% of total spending, and supported employment amounted to $830 million (1.5% of total spending). Trends in Spending by State: FY 2009-2011
During 2009-11, inflationadjusted community spending in the U.S. advanced 3.2% 7-15 Person Settings (Table 3, page 8). Eighteen 5% states reduced community Public Institutions (16+) 11.5% services spending during 6 person or fewer Residential & 59% 2009-11, ranging from a 0.3% Related Private Institutions (16+) 3% Community reduction in Alabama and 7% Supported Employment (1.5%) Services Kansas to a 10% reduction in 13% Family Support Indiana and Nevada. Other Supported Living/ large community spending Personal Assistance reductions were in Louisiana $56.65 Billion (9%) and Maine and Rhode Source: Braddock et al., Coleman Institute and Department of Psychiatry, University of Colorado, 2013. Island (7%). The largest state increase Spending for I/DD service categories in 2011 in community spending during 2009-11 was in is illustrated in Figure 4 (percentages were Kentucky (64%). Kentucky's community rounded). Total I/DD spending in the U.S. in spending growth was heavily underwritten by 2011 was $56.65 billion; $33.28 billion of this the HCBS Waiver, the result of the Michelle P amount was allocated for community residential class action litigation (Ng et al., 2009). Other and related services for six or fewer persons state leaders in the growth of community (59%). An additional $3.0 billion (5%) was services spending during 2009-11 were North committed by states to residential services for 7- Dakota (27%); Alaska (21%); Texas (18%); 15 persons. Spending totaled $6.51 billion for Wisconsin (14%); and Arkansas, Maryland, state-operated 16+ institutional settings (11.5%), and Oklahoma (13%). and $1.87 billion funded privately-operated 7
State of the States in Developmental Disabilities: 2013 TABLE 3
PUBLIC I/DD SPENDING FOR COMMUNITY SERVICES IN THE STATES: FY 2009-11 Community Spending State Alabama Alaska Arizona Arkansas California Colorado Connecticut Delaware District of Columbia Florida Georgia Hawaii Idaho Illinois Indiana Iowa Kansas Kentucky Louisiana Maine Maryland Massachusetts Michigan Minnesota Mississippi Missouri
2011
2009
$330,566,513 $150,136,938 $799,829,657 $367,063,289 $5,434,918,763 $480,430,488 $1,310,141,851 $144,443,214 $300,520,438 $1,314,774,448 $657,427,466 $173,868,003 $212,605,336 $1,133,663,001 $1,164,202,382 $559,042,334 $419,322,011 $418,800,324 $890,003,120 $379,449,800 $837,423,806 $1,640,499,601 $1,328,070,686 $1,540,121,625 $146,901,068 $659,035,505
$319,822,347 $119,908,063 $739,999,475 $314,395,673 $5,289,312,726 $452,860,576 $1,242,297,694 $146,678,750 $266,774,701 $1,252,856,099 $631,504,751 $167,702,008 $210,918,304 $1,107,088,248 $1,250,095,315 $507,791,540 $406,005,550 $246,565,726 $939,362,252 $393,924,566 $715,354,466 $1,484,559,910 $1,251,047,946 $1,439,345,598 $148,793,616 $612,885,240
% Real Change 1 2009-11 -0.3% 20.8% 4.3% 12.7% -0.9% 2.4% 1.8% -5.0% 8.7% 1.3% 0.5% 0.0% -2.7% -1.2% -10.1% 6.2% -0.3% 63.9% -8.6% -7.1% 13.0% 6.6% 2.4% 3.2% -4.7% 3.8%
Community Spending State Montana Nebraska Nevada New Hampshire New Jersey New Mexico New York North Carolina North Dakota Ohio Oklahoma Oregon Pennsylvania Rhode Island South Carolina South Dakota Tennessee Texas Utah Vermont Virginia Washington West Virginia Wisconsin Wyoming United States
2011
2009
$126,763,545 $115,626,947 $258,896,791 $225,246,241 $143,864,687 $153,678,030 $248,736,909 $216,235,485 $1,074,737,385 $1,052,685,808 $351,276,212 $355,679,268 $9,204,056,993 $8,412,831,033 $1,040,415,449 $983,390,539 $209,404,301 $159,694,292 $2,596,787,400 $2,325,386,433 $406,476,263 $346,642,727 $779,749,185 $702,246,099 $2,329,023,861 $2,368,805,454 $259,021,142 $268,585,421 $426,423,091 $420,060,116 $135,592,530 $119,707,252 $751,907,116 $703,953,194 $1,613,616,934 $1,322,135,373 $190,678,456 $190,291,543 $162,826,336 $150,051,785 $742,010,360 $707,294,483 $844,427,261 $795,221,747 $349,550,081 $327,402,869 $1,142,680,447 $971,101,553 $112,631,820 $111,680,285 $48,294,816,223 $45,163,485,119
% Real Change 1 2009-11 5.8% 10.9% -9.7% 11.0% -1.5% -4.7% 5.6% 2.1% 26.5% 7.8% 13.1% 7.1% -5.1% -6.9% -2.0% 9.3% 3.1% 17.8% -3.3% 4.7% 1.2% 2.5% 3.0% 13.5% -2.7% 3.2%
1
Inflation-adjusted percentage change, 2009 to 2011. Source : Braddock et al., Coleman Institute and Department of Psychiatry, University of Colorado, 2013.
Total I/DD institutional and community spending during 2009-11 increased 10% or more in eight states: Kentucky (40%); Alaska (21%); North Dakota (20%); Texas (15%); Arkansas, New Hampshire, and Wisconsin, (11%); and Maryland (10%). Eighteen states and the District of Columbia increased spending between 0.2% and 8%. Reductions in total inflation-adjusted I/DD spending occurred in 24 states during 2009-11 (see Figure 5, page 9). These included Mississippi (12%), Indiana and Louisiana (11%), Nevada (8%), Maine and Rhode Island (7%), and Idaho, Tennessee, and Utah (6%). The remaining 15 states with total I/DD spending reductions of 0.2% to 5%, were Alabama, California, Delaware, Florida, Georgia, Hawaii, Illinois, Kansas, Missouri, Pennsylvania, New Mexico, North Carolina, South Carolina, Washington State, and Wyoming.
8
Change in Inflation-Adjusted Spending in 2009, 2010, and 2011 To further evaluate the impact of the Great Recession on I/DD spending in the states, we examined inflation-adjusted changes in spending by state, by service sector, and by year for 2009, 2010, and 2011 (Table 4, page 10). A hallmark of the 2009-11 period was that continuing growth in community services spending, a general rule in previous studies, was reversed in many states. Twenty-five states saw real reductions in community spending in 2011, following reductions in 15 states in 2010 and in 18 states in 2009. Thirteen states had no spending reductions over the three-year period. The largest community services reductions in 2009 were in Oklahoma (17%) and Minnesota (13%). The largest reductions in 2010 were in Nevada (8%) and Louisiana (7%). In 2011, community spending dropped 5% or more in five states: Rhode Island (9%),
State of the States in Developmental Disabilities: 2013
Figure 5 24 States Reduced Total Inflation-Adjusted I/DD Spending During 2009-11 Kentucky Alaska North Dakota Texas Arkansas Wisconsin New Hampshire Maryland Nebraska Ohio District of Columbia Oklahoma New Jersey South Dakota New York Colorado Oregon Massachusetts Vermont Arizona Iowa Montana Virginia West Virginia Minnesota UNITED STATES Connecticut Michigan North Carolina Florida Alabama Missouri Georgia Hawaii Wyoming South Carolina Washington Kansas California Delaware Illinois Pennsylvania New Mexico Utah Idaho Tennessee Rhode Island Maine Nevada Louisiana Indiana Mississippi
40%
10%
5%
-0.2%
2% 0.2%
-1%
-6%
-8% -12%
-20%
-10%
0%
10%
20%
30%
40%
50%
Source: Braddock et al., Coleman Institute and Department of Psychiatry, University of Colorado, 2013
9
State of the States in Developmental Disabilities: 2013 TABLE 4
ADJUSTED PERCENTAGE CHANGE IN SPENDING BY SETTING1 PUBLIC/PRIVATE 16+ INSTITUTION STATE Alabama Alaska Arizona Arkansas California Colorado Connecticut Delaware District of Columbia Florida Georgia Hawaii Idaho Illinois Indiana Iowa Kansas Kentucky Louisiana Maine Maryland Massachusetts Michigan Minnesota Mississippi Missouri Montana Nebraska Nevada New Hampshire New Jersey New Mexico New York North Carolina North Dakota Ohio Oklahoma Oregon Pennsylvania Rhode Island South Carolina South Dakota Tennessee Texas Utah Vermont Virginia Washington West Virginia Wisconsin Wyoming United States NO. OF STATES WITH REDUCTIONS
2009
2010
2
COMMUNITY 2011
3.9% 4.5% -8.2% No 16+ spending 3.9% -6.4% -4.0% -2.3% 8.2% 0.3% -11.0% -11.9% -2.9% 9.7% 35.0% 24.8% 1.7% -2.7% -0.5% -2.0% -5.3% 6.2% -21.7% -100.0% Not Appl. -6.5% -3.4% -5.8% -15.9% -4.7% -8.3% -4.1% -100.0% Not Appl. -13.6% -21.9% -21.5% 0.3% -8.7% -0.6% -12.0% -7.6% -19.3% -0.8% 5.2% -6.8% -7.7% -10.0% -4.8% 2.1% 3.7% -3.5% 10.2% -18.1% -0.3% -0.01% -0.5% -2.2% 5.9% -6.7% -9.3% -19.7% 14.6% -22.5% -13.9% -59.6% 24.8% -7.6% -4.7% -6.8% -1.7% -11.0% -5.8% -6.1% -14.3% -9.3% -13.6% 1.7% -18.3% -7.1% 10.2% -9.0% -32.6% 12.6% 3.1% -2.2% 1.9% -5.0% -13.4% 13.5% 7.3% No 16+ spending 2.8% 1.6% 0.4% 1.8% -3.8% -3.1% 33.4% -12.9% -0.2% -9.8% 8.7% -1.5% -5.0% 6.9% -23.1% -31.0% -76.9% -100.0% 0.7% 2.9% -3.2% 34.2% 9.9% -8.9% -10.4% -0.3% -0.1% 3.7% 2.1% -14.4% -6.8% -14.2% -28.1% 8.7% 8.9% -0.6% -0.8% -2.3% -9.3% No 16+ spending -14.2% 12.9% -2.2% 7.9% -9.9% -11.2% -1.3% -8.9% 6.8% -11.0% 1.9% -5.3% -11.3% 5.6% 0.6% -3.5% -1.0% -3.2% 32
27
37
2009 -2.9% 7.6% 4.7% 8.1% 6.8% 3.0% 4.6% 3.1% 9.3% -7.8% -4.8% -5.5% -8.9% 3.4% -4.9% -5.1% 1.7% -3.0% 10.4% 0.5% -5.2% 10.4% -1.0% -12.8% -3.9% -1.2% -5.5% 1.7% 14.5% 5.4% 1.3% 1.6% 4.4% 7.5% 7.2% 1.4% -16.7% 13.1% 3.4% -10.3% -10.9% 0.6% 0.6% -1.5% 2.7% 2.5% 5.9% 9.7% 2.2% 0.1% 1.3% 1.9%
2010 -4.4% 15.6% 4.2% 7.4% -0.5% 7.5% 2.3% -2.5% 10.6% 5.4% -0.6% 1.1% -3.3% 0.9% -5.2% 6.0% -2.9% 42.5% -6.6% -2.0% 14.5% 8.2% 3.1% 3.9% 2.9% 0.1% 3.5% 6.6% -8.4% 7.6% -5.1% 2.5% 4.7% 2.2% 19.8% 6.4% 16.7% 3.0% -0.7% 2.5% -5.5% 7.6% 2.6% 6.8% 1.6% 4.0% -2.9% 2.7% 4.2% 4.8% -5.7% 2.9%
18
15
3
TOTAL 2011 4.3% 4.6% 0.1% 4.9% -0.4% -4.8% -0.5% -2.5% -1.7% -4.0% 1.1% -1.1% 0.6% -2.1% -5.2% 0.2% 2.7% 15.0% -2.2% -5.2% -1.4% -1.5% -0.6% -0.6% -7.4% 3.7% 2.2% 4.0% -1.4% 3.2% 3.8% -7.0% 0.9% -0.1% 5.6% 1.2% -3.1% 4.0% -4.4% -9.2% 3.6% 1.5% 0.5% 10.3% -4.8% 0.6% 4.2% -0.2% -1.2% 8.4% 3.2% 0.3% 25
2009 -2.2% 7.6% 4.7% 4.8% 4.3% 3.3% 4.1% 2.2% 8.5% -7.6% -6.4% -5.5% -9.3% 2.3% -5.3% -3.8% 0.5% -1.1% 10.3% 0.5% -4.2% 6.5% -1.6% -12.7% -2.6% -2.1% -6.4% -0.5% 9.4% 5.3% -4.2% 1.6% 4.2% 6.0% 11.0% -0.8% -14.4% 11.7% 2.9% -9.6% -10.8% 1.1% -1.1% 1.8% 1.8% 2.5% 0.3% 9.3% 2.2% -1.7% -0.8% 1.0% 23
1
Inflation-adjusted percentage change Fiscal Years 2008-09, 2009-10, and 2010-11.
2
"Public/private 16+ institution" spending excudes nursing facility spending; AK, NM and VT had no 16+ setting spending during 2009-11; DC and HI had no spending during 2010-11; and OR closed all remaining public/private institutions in in 2011.
3
"Community" includes residential settings for 15 or fewer persons. Source : Braddock et al., Coleman Institute and Department of Psychiatry, University of Colorado, 2013.
10
2010 -3.5% 15.6% 3.7% 7.6% -1.9% 8.7% 1.4% -3.0% 8.6% 3.9% -1.1% -0.2% -5.0% -2.5% -5.3% 5.7% -3.7% 27.7% -9.2% -2.0% 12.4% 8.8% 0.4% 3.6% -5.6% -2.6% 3.4% 7.5% -7.0% 7.5% 1.2% 2.5% 4.4% 0.6% 14.1% 6.8% 14.6% 1.4% -0.1% 2.7% -4.5% 6.7% -1.1% 7.5% 0.5% 4.0% 0.9% 0.1% 4.1% 4.3% -4.0% 2.3% 18
2011 2.9% 4.6% -0.02% 3.6% -0.6% -3.2% -0.5% -1.0% -1.7% -4.3% -0.1% -1.1% -1.1% -1.6% -5.9% -2.0% 1.9% 9.3% -1.8% -5.1% -2.0% -3.6% -0.2% -0.7% -6.5% 1.5% 0.2% 0.9% -1.0% 3.1% 5.2% -7.0% 0.8% -0.8% 4.8% 0.7% -7.1% 3.6% -4.2% -9.2% 2.9% -1.1% -5.0% 6.5% -6.0% 0.6% 2.5% -2.2% -1.1% 6.4% 2.8% -0.2% 31
State of the States in Developmental Disabilities: 2013
Mississippi and New Mexico (7%), and Indiana and Maine (5%). Twenty-six states had no community spending reductions in 2011. Successive years of I/DD community services spending reductions in such a large number of states has likely had a harmful impact on community service provider organizations, families, and individuals with I/DD. For example, Nevada's family support income eligibility was cut by 40% in 2011 and the fact that media coverage highlighted statewide budget crises and further discouraged families from applying for services. Idaho terminated funding for family support services in 2010, and there were 2009-11 spending reductions in family support spending ranging from 1% to 80% in 27 additional states and the District of Columbia. The national trend of continued annual reduction in public and private 16+ institutional spending continued during 2009-2011. In 2009, inflation-adjusted institutional spending in the U.S. dropped by 3.5%; followed by reductions of 1.0% in 2010 and 3.2% in 2011. Thirty-three states posted real spending increases for public/private institutional services in 2009, 2010 or 2011. Of these states, only two--Colorado and New York--increased institutional spending all three years. The largest reductions in institutional spending were in 10 states: California (11% in 2009, 12% in 2010, 3% in 2011); the District of Columbia (22% in 2009, 100% in 2010); Georgia (16% in 2009, 5% in 2010, 8% in 2011); Hawaii (4% in 2009, 100% in 2010); Idaho (14% in 2009 and 22% in 2010 and 2011); Indiana (12% in 2009, 8% in 2010, 19% in 2011); Massachusetts (20% in 2009, 23% in 2011); Michigan (14% in 2009 and 60% in 2010); Nevada (33% in 2009); Oregon (31% in 2009, 77% in 2010, 100% in 2011); and Tennessee (7% in 2009, 14% in 2010, 28% in 2011). However, there was growth in institutional spending in 16 states in 2009, 21 states in 2010, and in nine states in 2011. The states posting real
growth in 2011 in public/private institutional spending were: Colorado and Michigan (25%); New Jersey and West Virginia (7%); Delaware (6%); Nevada (3%); and Arkansas, New York, and Wyoming (