Proceedings of the International Multiconference on Computer Science and Information Technology pp. 559–566
ISBN 978-83-60810-14-9 ISSN 1896-7094
Distributed Internet Systems Modeling Using TCPNs Tomasz Rak
Slawomir Samolej
Department of Computer and Control Engineering, Rzeszow University of Technology, Poland Email:
[email protected]
Department of Computer and Control Engineering, Rzeszow University of Technology, Poland Email:
[email protected]
Abstract—This paper presents a Timed Coloured Petri Nets based programming tool that supports modeling and performance analysis of distributed World Wide Web environments. A distributed Internet system model, initially described in compliance with Queueing Theory (QT) rules, is mapped onto the Timed Coloured Petri Net (TCPN) structure by means of queueing system templates. Then, it is executed and analyzed using Design/CPN toolset. The proposed distributed Internet systems modeling and design methodology has been applied for evaluation of several system architectures under different external loads.
In the next section, we present a method of applying the TCPNs based queueing systems models (TCPNs templates) to distributed Internet system modeling. Section 4 focuses on results of simulation some detailed Internet system models while section 5 sums up the paper and includes our future research plans. We assumed that the reader is familiar with TCPN formalism [3], [9] and with main features of Design/CPN tool [1], [6].
I. I NTRODUCTION NE OF modern Internet (or Web) systems development approaches assumes that the systems consist of a set of distributed nodes. Dedicated groups of nodes are organized in layers (clusters) conducting predefined services (e.g. WWW service or data base service). Simultaneously, for a significant number of Internet applications some kind of soft real-time constraints are formulated. The applications should provide up-to-date data in set time frames [13]. The appearing of new abovementioned development paradigms cause that searching for a new method of modeling and timing performance evaluation of distributed Internet systems seems to be an up-to-date research path. One of intensively investigated branch of Internet systems software engineering is formal languages application for modeling and performance analysis. Amid suggested solutions there are: algebraic description [7], mapping through Queueing Nets (QN) [4], [12], modeling using both Coloured Petri Nets (CPN) [8] and Queueing Petri Nets (QPN) [5]. Our approach proposed in this paper may be treated as extension of solutions introduced in [5]. Queueing Petri Nets (QPN) idea has been transferred onto formalism of Timed Coloured Petri Nets (TCPNs) [3]. To create classic queueing system models defined as in [2] we used Design/CPN tool package [1]. As a result we developed a programming tool which is able to map timed behavior of queueing nets by means of simulation. The Design/CPN performance tool [6] has been used to effectively capture and analyze data for created models. The main features of the preliminary version of our software tool were announced in [10]. The remaining work is organized as follows. In section 2, we introduce rules of mapping queueing systems into TCPNs.
II. Q UEUEING S YSTEM I MPLEMENTATION
O
c 2008 IEEE 978-83-60810-14-9/08/$25.00
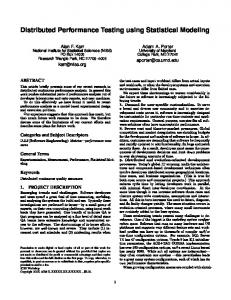
Queueing Net usually consists of a set of connected queueing systems. Each queueing system is described by an arrival process, a waiting room and a service process. In the proposed programming tool, we worked out several TCPNs based queueing system templates (Processor Sharing (PS) and First In First Out (FIFO)) most frequently used to represent properties of distributed Internet system components. Each template represents a separate TCPN net (subpage) which may be included in the model of the system as a substitution transition (using hierarchical CP nets mechanisms [3]). Queueing system properties are mapped to the TCPNs net as follows. At a certain level of system description, a part of hardware/software is modeled as a TCPN, where some dedicated substitution transitions are understand as queueing systems. To have the queueing functionality running ”under” selected transitions the mapping to adequate TCPNs subpages must be done. The corresponding subpages include the implementation of the adequate queueing system. In fig. 1a a simple TCPN is presented where PS substitution transition is interpreted as a certain queueing system. The PS transition acquires the queueing system functionality when the subnet as in fig. 1b is substituted for it. Figure 1b illustrates an example queueing system -/M/1/PS/∞ (exponential service times, single server, Processor Sharing service discipline and unlimited number of arrivals in the system; the queue’s arrival process in our modeling approach is defined outside of queueing system model). Packets to be served by given queueing system are delivered by port place INPUT_PACKS. Then, they are scheduled in a queue in PACK_QUEUE place. Every given time quantum (regulated by time multiset included in TIMERS place) the first element in the queue is selected to be served
559
560
PROCEEDINGS OF THE IMCSIT. VOLUME 3, 2008
TIMER 1‘1
TIMERS
1‘tim1
PS ps_queue
PACKS1
P
PACKS6
In
HS
PACKAGE
PACKAGE
ps_queue
PACKAGE
pack
INPUT_PACKS
PACKAGE
ps_queue update_PS PACK_QUEUE (ps_queue)
1‘tim1@+ps1_quantum release_PS (ps_queue,ps1_quantum) EXECUTED _PACKS
PACK_QUEUE
add_PS ps_queue nil PACKAGE ADD_PS (pack,ps_queue, [ps_queuenil] discExp(1.0/ EXECUTE_PS ps1_ser_mean_time) pack ) ps_queue add_PS1 (pack,ps_queue)
pack
OUTPUT_PACKS pack @+ps1_quantum P Out
[#6 pack 0]
TCPNs model of -/M/1/PS/∞ queuing system: a) primary model page b) detailed model page
(execution of transition EXECUTE_PS). Then, it is placed at the end of the queue or directed to leave the system (execution of transition ADD_PS1 or REMOVE_PS respectively). Number of tokens in TIMERS place represents number of servers for queueing system. Full description of the model requires colors and functions definition in CPN ML language connected to the net elements: v al ps ser mean time =1 . 0 ; v a l p ack g en m ean tim e = 1 . 0 ; c o l o r ID= i n t ; c o l o r PRT= i n t ; c o l o r START TIME= i n t ; c o l o r PROB= i n t ; c o l o r AUTIL= i n t ; c o l o r RUTIL= i n t ; c o l o r INT= i n t ; c o l o r TIMER= i n t t i m e d ; c o l o r r an d o m v al = i n t w i t h 1 . . 1 0 0 ; v a r t i m v a l : INT ; v a r n : INT ; v a r t i m 1 : TIMER ; c o l o r PACKAGE= p r o d u c t ID∗PRT∗START TIME∗PROB∗AUTIL∗RUTIL t i m e d ; v a r p ack :PACKAGE; c o l o r PACK QUEUE= l i s t PACKAGE; v a r p s q u e u e : PACK QUEUE;
Corresponding arc functions (add_PS(), add_PS1(), update_PS(), release_PS()) release or insert tokens within the queue: f u n add PS ( p ack :PACKAGE, q u eu e : PACK QUEUE, s e r t i m e : i n t ) = i f q u eu e = n i l t h e n [ ( # 1 pack , # 2 pack , # 3 pack , # 4 pack , ser time , ser time )] e l s e ( # 1 pack , # 2 pack , # 3 pack , # 4 pack , s e r t i m e , s e r t i m e ) : : q u eu e ; f u n add PS1 ( p ack :PACKAGE, q u eu e : PACK QUEUE) = i f q u eu e = n i l t h e n [ p ack ] e l s e p ack : : q u eu e ; f u n u p d ate P S ( q u eu e : PACK QUEUE) = r e v ( t l ( r e v q u eu e ) ) ; f u n r e l e a s e P S ( q u eu e : PACK QUEUE, p s q u an tu m : INT ) = l e t v a l r p a c k =hd ( r e v q u eu e ) I n ( # 1 r p ack , # 2 r p ack , # 3 r p ack , r an ’ r an d o m v al ( ) , #5 r p ack , #6 r p ack −p s q u an tu m ) end ;
The state of the system is determined by the number and distribution of the tokens representing data packet flow. Each of the tokens representing a packet is a tuple PACKAGE = (ID, PRT, START_TIME, PROB, AUTIL, RUTIL) (compare source code including color’s definitions), where: ID - token identification (allowing token class definition etc.), PRT - priority, START TIME -
time of a token occurrence in the system, PROB - probability value (used in token movement distribution in the net), AUTIL - absolute value of token utilization factor (for PS queue) and RUTIL - relative value of token utilization factor. Tokens have timed attribute scheduling them within places which are not queues. While packets are being served, the components of a tuple are being modified. At the moment the given packet leaves the queueing system, a new PROB field value of PACKAGE tuple is being generated randomly (release_PS function). The value may be used to modify the load of individual branches in the queueing system model. Generally, the queueing system template is characterized by the following parameters: average tokens service time (ps_ser_mean_time), number of servers (number of tokens in TIMERS place) and service discipline (the TCPN’s structure). In the software tool developed, it is possible to construct queueing nets with queueing systems having PS and FIFO disciplines. These disciplines are the most commonly used for modeling Internet systems. Some our previous works include the rules of mapping TCPNs into queues of tokens scheduled according priorities [9], [8]. The presented templates have been tested on their compatibility with mathematical formulas determining the average queue length and service time as in [2]. III. I NTERNET S YSTEM M ODELING A PPROACH
AND
A NALYSIS
Having a set TCPN based queueing systems models a systematic methodology of Internet system modeling and analysis may be proposed. Typically, modern Internet systems are composed of layers where each layer consist of a set of servers—a server cluster. The layers are dedicated for proper tasks and exchange requests between each other. To efficiently model typical Internet systems structures we proposed 3 modeling levels: • superior—modeling of input process, transactions between layers and requests removal, • layer—modeling of cluster structure,
TOMASZ RAK ET. AL: DISTRIBUTED INTERNET SYSTEMS MODELING
561
of timed multiset in PACKS1 place and then forwarded into the queueing-based model of the Internet system. When each token is being generated its creation time is memorized in the PACKAGE tuple. This makes it possible to conduct an off-line analysis of the model.
Fig. 2.
Example distributed Internet system environment
queue—modeling of queueing system. To explain our approach to Internet system modeling a typical structure of distributed Internet system structure will be modeled and simulated. The example queueing model of the system consists of two layers of server clusters (fig. 2) and is constructed following the rules introduced in [4] and [5]. The front-end layer is responsible for presentation and processing of client requests. Nodes of this layer are modeled by PS queues. The next layer (back-end) implements system data handling. Nodes of this layer are modeled by using the serially connected PS and FIFO queues. The PS queue models the server processor and FIFO models the hard disc drive of server. Requests are sent to the system can be processed in both layers or removed after processing in front-end layer. The successfully processed requests are turned to the customer. Figure 3 shows the TCPN based model of abovementioned queueing network. The superior level of system description is presented in fig. 3a, whereas in fig. 3b and 3c detailed queueing systems topologies at each layer of the system are shown (compare fig. 2). Server cluster of the first layer (e.g. WWW servers; fig. 3b) as well as the second layer cluster (e.g. database; fig. 3c) have been demonstrated on the main page of TCPN net as substituted transitions: front-end_cluster and back-end_cluster. T2 and T3 transitions (compare fig. 3a) are in conflict. Execution of transition T2 removes a token from the net (modeling the possible loss of data packet). However, if T3 fires, the data packet is transferred for processing in the second layer of the system. Guard functions connected to the mentioned transitions determine proportions between the tokens (packets) rejected and the ones remaining in the queueing net (in the example model approximately 30% of the tokens is rejected). On the superior level of system description (fig. 3a) we have also defined arrival process of the queueing network (T0 transition with TIMER0 and COUNTER places). TIMER0 place and T0 transition constitute a clock-like structure that produces tokens (requests) according to random, exponentially distributed frequency. These tokens are accumulated in a form •
Consequently, an executable (in a simulation sense) queueing network model is obtained. Tokens generated by arrival process are transferred in sequence by models of WWW server layer, by the part of the net that models loss (expiration) of some packets and by database layer. Provided that the system is balanced and has constant average arrival process, after some working time, the average values of the average queue length and response time are constant. Otherwise, their increase may occur. The main parameters of the system modeled are the queue mean service time, the service time probability distribution function and the number of servicing units defined for each queueing system in the model. In the demonstrated model it has been assumed that queues belonging to a given layer have identical parameters. At this stage of our research it has been decided that simulation will be the main mechanism used to do analysis of the constructed model. In our simulations we applied the performance analysis subsystem built in Design/CPN toolkit [6], [8]. It allows collecting selected elements of the net state at the moment of an occurrence certain events during simulation. It has been assumed that in each of the model layers, queue lengths and response time will be monitored. Monitoring of the abovementioned parameters helps to determine whether the model of the system is balanced. Fig. 4 shows example plots obtained in the simulation of the discussed model. The example experiment covered model time range from 0 to 100 000 time units. Fig. 4a shows the state of selected queue when the modeled system was balanced. Response time does not increase and remains around average value. System is regarded as balanced if the average queue lengths in all layers do not increase. In fig. 4b response time for unbalanced system was shown. The results concern the same layer as previously and identical time range for the simulation. It is clear that response time (fig. 4b) increase during the experiment. On the basis of the plot in fig. 4b, it can be concluded that the modeled system under the assumed external load would be overload and probably appropriate modifications in the structure of the system would be necessary. The software tool introduced in our paper makes it possible to estimate the performance of developing Internet system, to test and finally to help adjust preliminary design assumptions. Having the possibility to capture the net’s state during the simulation within a certain time interval, it can be possible to select model parameters in such a manner that they meet assumed time restrictions. Additionally, the parameters of real Internet system can be used to fit parameters of the constructed model.
562
PROCEEDINGS OF THE IMCSIT. VOLUME 3, 2008
PACKAGE pack INT
pack
PACKS7
T1
1‘1
COUNTER pack (n,0,intTime(), n+1 TIMER front-end_cluster n 0,0,0) 1‘1 tim1 TIMER0 T0 PACKS1 PACKS6 tim1 C @+tim_val PACKAGE PACKAGE HS output (tim_val); action front-end_cluster#25 discExp(1.0/ pack_gen_mean_time);
T3
[#4 pack >=1 andalso #4 pack=71 andalso #4 pack OUTPUT_PACKS PACKS1->INPUT_PACKS P In
HS PACKS1
P PACKS6
PS_Q1_2
PACKAGE
HS
b) Fig. 3.
PS_Q2_1#4 PACKS89->OUTPUT_PACKS PACKS8->INPUT_PACKS
PS_Q2_1
HS
P PACKS8
Out In
PACKAGE
PACKAGE
PS_Q1_2#9 PACKS6->OUTPUT_PACKS PACKS1->INPUT_PACKS
c)
PS_Q2_2#5 PACKS89->OUTPUT_PACKS PACKS8->INPUT_PACKS
PS_Q2_2
HS
P
FIFO_Q2 PACKS89
PACKS11
PACKAGE
HS
Out
PACKAGE
FIFO_Q2_1#15 PACKS11->OUTPUT_PACKS PACKS89->INPUT_PACKS
TCPNs based queueing system model: a) main page, b) front-end cluster subpage and c) back-end cluster subpage
1200
Response time
IV. E XAMPLE S YSTEM M ODEL WITH F RONT- END C LUSTER AND BACK - END R EPLICATION
Response time
1000
800
600
400
200
0 0
10000 20000 30000 40000 50000 60000 70000 80000 90000100000
a)
Time (seconds) 100000
The worked out modeling and analysis methodology was used for construction and evaluation of several detailed models of architectures of distributed Internet systems. The analysis of the models were executed with use of performance analysis tools for TCPN nets [13]. CSIM [11] simulating environment and experiments on real Internet system were used for TCPNs simulations evaluation. The overview of typical TCPNs based Internet system models analyzed so far can be found in [8]. In the remaining part of the paper one example detailed model will be discussed: ”front-end cluster and back-end cluster with replication”.
Response time
90000
A. Model description
80000
Response time
70000 60000 50000 40000 30000 20000 10000 0 0
b)
10000 20000 30000 40000 50000 60000 70000 80000 90000100000 Time (seconds)
Fig. 4. Sample system response time history: a) system balanced and b) system unbalanced
The queueing model of the example system is introduced in fig. 5. It consists of two cluster layers of servers. Let A be the number of homogeneous servers in the first and B in the second cluster layer respectively. Customer requests are sent to the chosen node of front-end cluster with 1/A probability. Then they are placed in the queue to get service. The service in the service unit (processor) can be suspend many times, if for example the requests need the database access. When the database access occures, requests are sent to back-end layer. Any request can also be removed following pREMOVE path. In case of sending to the database, a requests steers itself to service in one of back-end nodes with 1/B probability. The service in the database service unit may be suspend if access
TOMASZ RAK ET. AL: DISTRIBUTED INTERNET SYSTEMS MODELING
563
TABLE I T HE VALUE OF PROBABILITIES FOR MODEL Probability
pREMOVE pLEAVE pDB pREP
Fig. 5. Queueing model with cluster in front-end layer and replication in back-end layer
Probability values for model [%] 30 30 55 10
database replication, is described on fig. 6b. The example shown contains two nodes of database (B=2) and its most essential properties are as following: • the possibility of directing tokens to any node (the location of replication), • the return of tokens at the beginning of the layer, • the realization of data synchronisation in individual locations. B. Experimental and simulating model verification
to the input/output subsystem of the database storage device is necessary. Requests are returned to the database service unit after the storage device is served. This operation can be repeated many times. After finishing servicing in the backend layer, requests are returned to front-end servers (pDB). Requests can visit back-end layer during processing many times. After finish servicing in front-end server requests are sent to the customer (pLEAVE). If the necessity of the database replication appears the requests are sent to next database node (pREP). Unless none of these two situations appear the requests are send to frontend layer (pDB). Replication can also cause resignation from transaction. Both the replication and the rejection of realizing transaction are modeled in simplistic way as delivery of task to the next location of replication. In this model: • PS_Q1_A is A queue PS modeling element that processes in front-end layer, • PS_Q2_B is B queue PS modeling element that processes in back-end layer, • FIFO_Q2_B is B queue FIFO modeling device that stores data in back-end layer. Tab. I includes the probabilities values for Internet requests distribution for considered model. The parameters assumed for discussed model are as follows: • external load, • the identical parameters of queues, • request distribution probabilities, • the number of nodes in experimental environment. In fig. 6a the main page (superior model level) of TCPN model that corresponds to the queueing model discussed above was presented. It makes it possible to transfer tokens from back-end layer back to front-end layer. It models the possibility of multiple tokens transfer to the server disk queue and replication. A subpage, which models back-end layer for
Three example cases (configurations) of considered model were used to derive the architecture features. Individual cases mean as follows: • case 1—A=2, B=2, • case 2—A=4, B=2, • case 3—A=4, B=4. Experimental environment and the CSIM packet were used to verify proposed TCPN models. The experimental system consisted of a net segment (100Mb/s), set of computers (Pentium 4, 2.8 GHz, 256 MB RAM) with Linux operating system (kernel 2.4.22) and Apache2 software (for WWW servers) as well as MySQL, version 4.0.15 (for database servers) [8]. The verification model was written by using CSIM simulator. This is a process oriented discreet event simulation package used with C or C++ compilers [11]. It provides libraries that a program written can be used in order to model a system and to simulate it. The models created by using CSIM [8] were based on presented queue models (fig. 5) (similarly as TCPN models). As a result we obtained the evaluated TCPNs based model of the Internet system discussed. The model made it possible to predict response time of the system developed. Average error between TCPN and CSIM models amounts to (tab. II) 9,5 % for response time. The comparison of results for TCPN models and experiments gave the following errors for individual model cases (tab. III) 14,9 %. In compare with experimental environment the average error of simulation for response time amounted to 15,1 % for TCPN and 14,1 % for CSIM respectively. In case of experiments (tab. III) there is the lack of compare for case 3 because of number of nodes in laboratory environment. C. Performance analysis In fig. 7 the queue lengths for the model (cases 2 and 3) were shown. These cases differ from each other by a number of nodes in corresponding layers. Values of queue lengths
564
PROCEEDINGS OF THE IMCSIT. VOLUME 3, 2008
[#4 pack >=71 andalso #4 pack =1 andalso pack #4 pack=1 T33 andalso #4 pack=71 andalso #4 pack OUTPUT_PACKS PACKS203->INPUT_PACKS
HS
NIC1_100 pack
PACKS200
FIFO_Q2_1
pack
PACKS899 PACKAGE
PACKAGE
pack
pack
PS_Q2_1#4 PACKS89->OUTPUT_PACKS PACKS2000->INPUT_PACKS PS_Q2_1 pack
PACKS2000
PACKS89
pack
pack
PACKS203
pack PACKAGE (#1 pack, pack #2 pack, #3 pack, pack ran’random_u(), [#4 pack >=1 #5 pack, andalso pack #6 pack) #4 pack=46 andalso #4 pack =1 (#1 pack, andalso pack #2 pack, pack #4 pack=46 andalso #4 pack =11 andalso NIC3 #4 pack OUTPUT_PACKS PACKS2010->INPUT_PACKS
pack [#4 pack >=11 andalso #4 pack OUTPUT_PACKS PACKS204->INPUT_PACKS
HS
Fig. 6. TCPNs based queueing system model with cluster in front-end layer and replication in back-end layer: a) main page and b) back-end cluster subpage
TOMASZ RAK ET. AL: DISTRIBUTED INTERNET SYSTEMS MODELING
565
TABLE II L AYERS RESPONSE TIME FOR TCPN MODEL AND CSIM MODEL Case 2
100 100 300 300 500 500 100 100 300 300 500 500
front-end back-end front-end back-end front-end back-end front-end back-end front-end back-end front-end back-end front-end back-end front-end back-end front-end back-end
TCPN CSIM Model [ms] Model [ms] Case 1 49 50 567 598 701 743 813 798 1001 1109 1050 1083 Case 2 75 73 1083 867 79 85 1144 989 1042 1191 965 950 Case 3 210 282 308 290 454 472 545 499 512 595 520 384
90
Error [%]
PSQ2_1 queue length
80 70
-2.0 -5.5 -5.9 1.8 -1.8 -3.1
PSQ2_1 Length
100 100 300 300 500 500
Layer
60 50 40 30 20
2.7 19.9 -7.6 13.5 -14.3 -9.8
10 0 0
10000 20000 30000 40000 50000 60000 70000 80000 90000 100000 Time (seconds)
a)
Case 2 200
PSQ2_2 queue length
180 160
-34.2 5.8 -3.9 8.4 -16.2 5.2
140 PSQ2_2 Length
Load [req./s]
120 100 80 60 40
TABLE III L AYERS RESPONSE TIME FOR TCPN S MODEL AND FOR EXPERIMENTAL
20 0
REFERENCE SYSTEM
Layer
100 100 300 300 500 500
front-end back-end front-end back-end front-end back-end
100 100 300 300 500 500
front-end back-end front-end back-end front-end back-end
TCPN Experiments Model [ms] [ms] Case 1 49 36 567 409 701 579 813 648 1001 921 1050 973 Case 2 75 65 1083 791 79 79 1144 910 1042 975 965 925
0
Error [%]
b)
10000 20000 30000 40000 50000 60000 70000 80000 90000 100000 Time (seconds) Case 3
3
26.5 27.5 17.4 20.3 8.0 7.3 13.3 26.9 0.0 20.4 6.4 -6.9
PSQ2_1 queue length
2.5
PSQ2_1 Length
Load [req./s]
2 1.5 1 0.5 0 0
c)
10000 20000 30000 40000 50000 60000 70000 80000 90000 100000 Time (seconds) Case 3
2
1.5 PSQ2_2 Length
in second layer were presented in charts (case 2—model for A=4, B=2): PSQ2_1 (fig. 7a) and PSQ2_2 (fig. 7b). Values of corresponding queue lengths for second layer in case 3 (A=4, B=4) were presented in charts: PSQ2_1 (fig. 7c) and PSQ2_2 (fig. 7d). Charts of both cases follow assumptions presented above and the same load. Queue lengths in case 2 are significantly longer than in case 3. It is easy to see benefits of enlarging number of nodes in back-end layer. The performance problems were noticed during the distributed Internet systems analysis. Results of response time individual layers analysis (tab. II) illustrates behaviour observed by system customer. The growth of workload generally increases response time of the system. It was noticed that the use of clustering and nodes replication reduce the response time.
PSQ2_2 queue length
1
0.5
0 0
d)
10000 20000 30000 40000 50000 60000 70000 80000 90000 100000 Time (seconds)
Fig. 7. PS queues lengths history in back-end layer: a), b) for case 2 and c), d) for case 3
566
PROCEEDINGS OF THE IMCSIT. VOLUME 3, 2008
In case of workload by more than 200 requests per second the system having the case 1 structure is overloaded. Backend layer becomes the system bottleneck. By the adequate modification of the number of computers in the second layer the overload condition under 200 request per second has been overcame. The presented performance analysis methodology makes it possible to detect early performance problems and to counteract them. V. C ONCLUSION It is still an open issue how to obtain an appropriate distributed Internet system. The demonstrated research results are an attempt to apply Queueing Theory (QT) and TCPNs formalism to the development of a software tool that can support distributed Internet system design. The idea of linking Queueing Nets Theory and Coloured Petri Nets was proposed previously by other authors in [5]. However, in the presented approach queueing systems have been implemented using TCPNs formalism exclusively. As a consequence, alternative implementation of Coloured Queueing Petri Nets has been proposed. What was more, the rules of modeling and analysis of distributed Internet systems applying described net structures was introduced. This paper deals with the problem of calculating performance values like the response time in distributed Internet systems environment. The values are calculated by using the Design/CPN tool (TCPN). It is shown how the Coloured Petri net model of a distributed Internet system is created with some of its data structures and functions, and gives an examples of system analysis. A comparison of the results obtained by using the software tools (Design/CPN and CSIM) with the results acquired from the real system is presented. The proposed approach is attempted to make a contribution to performance analysis of distributed Internet systems. This analysis is useful to determinate number and distribution of elements in the distributed Internet system architecture for specified requests load.
Our future research will focus on modeling and analyzing another structures of distributed Internet systems using the software tool developed. It will be also significant to demonstrate compatibility of the models with the real systems. TCPN features such as tokens distinction will be of more extensive use. We will also make an attempt to create queueing model systems with defined token classes and consider a possibility to use state space analysis of TCPN net to determine properties of the system. R EFERENCES [1] Meta Software Corporation, Design/CPN Reference Manual for XWindows, Meta Software, 1993. [2] B. Filipowicz, Modeling and optimize queueing systems, POLDEX, Krakow, 2006. (In Polish) [3] K. Jensen, Coloured Petri Nets, Basic Concepts, Analysis Methods and Practical Use, Vol. 1, Springer, 1996. [4] S. Konunev, A. Buchmann, Performance Modeling and Evaluation of Large-Scale J2EE Applications, In Proceedings of the 29th Int. Conf. of the Comp. Meas. Group on Res. Manag. and Perf. Eval. of Enterprise Comp. Syst., Dallas, Texas, December 7-12, pp. 486-502, 2003. [5] S. Kounev, Performance Engineering of Distributed Component-Base Systems, Banchmarking, Modeling and Performance Prediction, Shaker Verlag, 2006. [6] B. Linstrom, L. Wells, Design/CPN Perf. Tool Manual, CPN Group, Univ. of Aarhus, Denmark, 1999. [7] T. Rak, Model of Internet System Client Service, Computer Science, Vol. 5, AGH Krakow, 55–65, 2003. [8] T. Rak, The Modeling and Analysis of Interactive Internet Systems Realizing the Service of High-Frequency Offers, PhD dissertation supervised by J. Werewka, Krakow, AGH, 2007. (In Polish) [9] S. Samolej, Design of Embedded Systems Using Timed Coloured Petri Nets, PhD dissertation supervised by T. Szmuc, Krakow, AGH, 2004. (In Polish) [10] S. Samolej, T. Rak, Time Properties of Internet Systems Modeling Using Coloured Petri Nets, WKŁ, pp. 91–100, 2005. (In Polish) [11] H. Schwetman, CSIM19: A Powerfull Tool for Bilding System Models, Proceedings Winter Simulation Conference, B. A. Peters, J. S. Smith, D. J. Medeiros, and M. W. Rohrer, eds., 2001. [12] B. Urgaonkar, G. Pacifici, P. Shenoy, M. Spreitzer, A. Tantawi, An Analytical Model for Multi-tier Internet Service and Its Applications, Proceedings of the ACM SIGMETRICS International Conference on Measurement and Modeling of Computer Systems, pp. 291–302, 2005. [13] L. Wells, S. Christensen, L. M. Kristensen, K. H. Mortensen, Simulation Based Performance Analysis of Web Servers, Proceedings of the 9th International Workshop on Petri Nets and Performance Models, IEEE, pp. 59–68, 2001.