Sonar ALFS subsystem of the Block II upgrade to the LAMPS MK III helicopter, and yet it has no way to guarantee that the hard real-time processing require-.
Distributed Real-Time Data ow: An Execution Paradigm for Image Processing and Anti-Submarine Warfare Applications S. Goddard K. Je�ay Department of Computer Science University of North Carolina Chapel Hill, NC 27599-3175
Abstract
The central thesis of this project is that real-time scheduling theory can be combined with data ow methodologies to bound latency and memory utilization of distributed signal processing applications, such as those found in anti-submarine warfare and image processing.
To this end, we propose a new real-time data ow paradigm that is based on the Navy's Processing Graph Method (PGM) [5], which is similar to the data ow methodology employed by Ptolemy [1, 4] of the University of California at Berkeley and the Rapid Prototyping of Application Speci c Signal Processors (RASSP) project, funded by the Advanced Research Projects Agency (ARPA). While our data ow methodology itself is not novel, our application of real-time scheduling theory to the model is. 1 Introduction Signal processing algorithms are often de ned in the literature using large grain data ow graphs [4]: directed graphs in which a collection of sequential work that executes from start to nish without synchronization is called a node or vertex, and the graph edges (arcs) depict the asynchronous ow of data from one node to the next. Thus, an edge represents a producer/consumer relationship between two nodes. Large grain data ow provides a natural description of signal processing applications with each node representing a mathematical function to be performed on an in nite stream of data that ows on the arcs of the graph. The data ow methodology allows one to easily understand a signal processing application by depicting the structure of the algorithm; any portion of the application can be understood in the absence of the rest of the algorithm. Each node consumes the data produced by its predecessor in the graph and the data exists only between its production and consumption. Data ow is used by at least two government sponsored programs to develop embedded signal processing applications. The Rapid Prototyping of Application
Speci c Signal Processors (RASSP) project, funded by the Advanced Research Projects Agency (ARPA), uses data ow techniques to specify and develop image processing benchmark applications. One of the primary benchmarks they have developed is that of synthetic aperture radar (SAR). SAR is used to identify man-made objects on the ground or in the air by producing highresolution, all-weather images, which are usually processed in real-time. Data ow methodology is also used by the Navy's standard signal processor, the AN/UYS2A | used in detection of submarines. The Navy has spent millions of dollars developing the AN/UYS-2A and applications for it such as the Airborne Low Frequency Sonar (ALFS) subsystem of the Block II upgrade to the LAMPS MK III helicopter, and yet it has no way to guarantee that the hard real-time processing requirements of these anti-submarine warfare applications can be met. Embedded signal processing applications are naturally de ned using data ow techniques, but require the deterministic performance of real-time applications. The signal processing graph must process data at the rates of a set of producers (e.g., sonobuoys, dipping sonars, or radars) without the loss of data. Hence, these applications have a dual notion of correctness: logical and temporal. It is not su�cient to produce the correct output, which may be the signature of a detected target (logical correctness); embedded signal processing applications must produce the correct output within the correct time interval (temporal correctness). Hard-real-time data ow systems provide temporal correctness without loss of data while streams of input data arrive at rates de ned by the external world. Soft-real-time systems may use bu�ering schemes to prevent data loss during transient over loads. The system then catches up during light load intervals. There are many products on the market that aid in the development of real-time data ow applications (e.g., DSPView, DataFlow, RIPPEN, PGSE, GEDAE), but none of these provide support for analysis of the hard-real-time semantics of the system. Data ow models implicitly de ne a temporal seman-
In: Proceedings of the IEEE Real-Time Systems Symposium Work in Progress Abstracts, Washington, DC, December 1996, pages 55-58.
tics of a processing graph by specifying lower bounds on when nodes may execute as a function of the availability of data on input edges. However, most models do not specify an upper bound on the time that may elapse between when a node becomes eligible to execute and the time the node either commences or completes execution. The lack of such a speci cation creates several problems: � the lack of a feasibility or admission control test | Does a set of nodes or a graph \ t" on a processor? � undetermined latency properties | Does a graph meet timing requirements? � no upper bound on queue length | If latency isn't bounded, memory requirements for a graph cannot be bounded and hence data loss may occur. System engineers use these metrics to size hardware and perform requirements veri cation. A cost tradeo� may be made on CPU utilization versus latency, or bu�er space versus latency. High latency tolerances allow the use of a slower (and cheaper) CPU but may require more memory for increased bu�er space. On the other hand, tighter latency requirements may demand a faster CPU (or lower utilization) but less memory. In keeping costs in line, a system architect uses these metrics to make fundamental design tradeo�s. None of the data ow models or real-time execution paradigms in the research literature correctly model the execution of both SAR and ALFS applications. A new real-time data ow execution paradigm is needed that supports these distributed applications and the fundamental tradeo�s made by system engineers. The central thesis of this project is that real-time scheduling theory can be combined with data ow methodologies to bound latency and memory utilization of distributed signal processing applications, such as those found in anti-submarine warfare and image processing.
To this end, we propose a new real-time data ow paradigm that is based on the Navy's Processing Graph Method (PGM) [5], which is similar to the data ow methodology employed by Ptolemy [1, 4] (of the University of California at Berkeley) and RASSP. While our data ow methodology itself is not novel, our application of real-time scheduling theory to the model is. Using real-time scheduling theory, we will be able to: � determine the execution characteristics of every node in the graph, � determine whether or not a graph can be scheduled to meet its hard real-time processing requirements,
� bound the latency between receipt of sensor data and the presentation of processed data, � use dynamic scheduling techniques to ensure latency bounds are met, � determine the maximum amount of memory required by the application, and � add or remove graphs to the system \on the y" while still guaranteeing the hard real-time requirements of the executing applications.
2 The Data ow Model In our data ow model, a system is expressed as a directed graph of large grain nodes (processing functions) and edges (logical communication channels). The topology of the graph de nes the ow of data tokens from an input source to an output sink, de ning a software architecture independent of the hardware hosting the application. The edges of a graph are typed First-In-First-Out (FIFO) queues. The data type of the queue indicates the size of each token transported from a producer to a consumer. Tokens are appended to the tail of the queue (by the producer) and read from the head (by the consumer). The tail of a queue can be attached to at most one node at any time. Likewise, the head of a queue can be attached to at most one node at any time. The nodes of the graph embody processing functions. Each node must have at least one input port and zero or more output ports. At least one of the input ports must be attached to a queue. The rest of the node ports may be attached to queues, graph variables, or constants. The port type and the type of the attached data object (queue, variable, or constant) must match. There are three attributes associated with a queue: a produce, threshold, and consume amount. The produce amount speci es the number of tokens atomically appended to the queue when the producing node completes execution. The threshold amount represents the minimum number of tokens required before the node may process data from the input queue. The consume amount is the number of tokens dequeued (starting at the head) after the processing function nishes execution. A queue is over threshold if the number of enqueued tokens meets or exceeds the threshold amount. Unlike most data ow paradigms, our model (as does PGM) allows non-unity produce, threshold, and consume amounts as well as a consume amount less than the threshold. All three attributes must be non-negative values, and the consume amount must be less than or equal to the threshold amount. A node within a graph is eligible for execution whenever all of its input queues are over threshold. Although
PGM refers to these nodes as pooled nodes we use the more common term And nodes. An And node begins
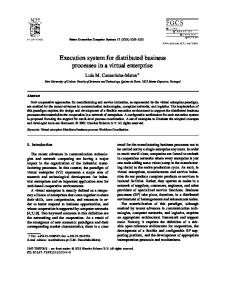
execution by reading the speci ed amount of data from all of its input ports. Next the processing function is executed. After the processing function completes, the output graph variables are written and the speci ed produce amount of tokens is appended to each output queue. Before the node terminates, but after data is produced, consume tokens are dequeued from each input queue. The production and consumption of data are both atomic operations. That is, all produce tokens are available to the consumer at the same time; all consume tokens are removed from an input queue in one indivisible operation. We assume that no data can be lost during graph execution and that no two executions of the same node overlap. The graph of Figure 1, labeled Chain1, contains two types of objects: nodes and queues, and has the topology of a chain. For simplicity, we employ chains to introduce our real-time data ow model. A chain has exactly one queue connecting any two nodes. The queue connecting Ni to Ni+1 is labeled Qi. For example, the queue connecting the source node N0 to its consumer N1 is Q0 . The produce amount is the number located at the tail of the queue (connected to the producing node). The threshold and consume values are placed at the head of the queue and separated by a comma. For example, the produce amount for Q1 is 3, the threshold is 3, and the consume value is 2. 3 Execution Model We have made substantial progress in de ning the execution model for a single processor. We are currently working on completing the single processor execution model and extending it to a distributed paradigm. This section brie y covers some of our results. A much more thorough and rigorous treatise of our real-time data ow execution model is provided in [3]. In addition to the two theorems presented without proof in this section, we have established (or a working to establish): � schedulability tests, � bounds on end-to-end latency, and � bounds on the memory requirements of a graph.
'$ '$ &% &%
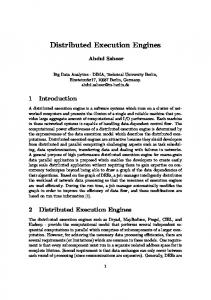
Example 3.1. Node Execution:
In the two node chain below, Ni produces 7 tokens every time it executes. Ni+1 has a threshold of 2 and consumes 2 after it executes. Qi,1
-
Ni
Qi
7
-
2; 2
Ni+1
Qi+1
-
Assume Qi contains no data. The rst execution of Ni enables 3 executions of Ni+1 , which consumes 6 of the 7 tokens produced | leaving 1 token on Qi . Hence, the second execution of Ni enables 4 executions of Ni+1 . After 2 executions of Ni and the resulting 7 executions of Ni+1 , Qi is left in its original state: containing 0 tokens. 2 We assume the synchrony hypothesis of [2] to introduce the concept of node execution rates. Under the synchrony hypothesis, we assume the graph executes on an in nitely fast machine. Hence, each node takes no time to execute and data passes from source to sink node instantaneously. The synchrony hypothesis lets us de ne execution rates in the absence of scheduling algorithms and deadlines. De nition 3.1. An execution interval is a period of time during which a node is guaranteed to have a constant number of executions. De nition 3.2. Let t be the beginning of the rst execution interval for node N. The execution rate for N is speci ed as (x; y); (Assuming the strong synchrony hypothesis of [2]) N will execute exactly x times in all time intervals of [t + y � (j , 1); t + y � j); 8j > 0. Throughout this section, we assume that each node produces a constant number of tokens and consumes a constant number of tokens with consumei � thresholdi , where the threshold is also constant. If the produce and consume values are not constant, then maximum produce and minimum consume values can be used to determine the maximum node execution rates. De nition 3.3. The rate speci cation for Ni is represented as (xi ; yi). De nition 3.4. The beginning of the rst execution interval for Ni is represented as ti . Theorem 3.1. Given the rate speci cation of (xi; yi ) for Ni , Ni will execute exactly xi times in every interval of [ti + (k � y0 ); ti + (k � y0 ) + yi ), 8k � 0. Theorem 3.2. 8i � 0; j > 0: Let ti+1 represent the beginning of rst execution interval of Ni+1 . Given the attributes for Qi in a Chain and the execution rate for N0 to be (x0 ; y0), the execution rate of Ni+1 for all intervals de ned by [ti+1 + (j , 1) � yi+1 ; ti+1 + j � yi+1 ] is (xi+1 ; yi+1) where ( produce �x xi+1 = gcd(produce �x ;consume ) (3.1) consume �y yi+1 = gcd(produce �x ;consume ) i
i
i
i
i
i
i
i
i
i
Example 3.2. Let's apply Theorem 3.2 to Chain of 1
Figure 1: Let N0 be periodic such that it executes once
'$ # # # &% "! "! "! Source N0 9
Q0
-
3; 3
N1
Q1
3
-
3; 2
N2
Q2
2
-
4; 2
N3
Figure 1: Chain1
every y time units, which means it has an execution rate of (1; y). We use Theorem 3.2 to derive the execution rate of the N1 through N3 as follows: ExecuteRate1 = (x1; y1 ) � 9�1 � � 9 3y � 3�y = gcd(9 ; � 1; 3) gcd(9 � 1; 3) = 3 ; 3( = (3; y) ) xy 1 == y3 1 ExecuteRate2 = (x2; y2 ) � � 9 2y � � 3�3 2�y ; = gcd(3 � 3; 2) gcd(3 � 3; 2) = 1 ; 1( = (9; 2y) 9 ) xy 2 == 2y 2 2
4 Conclusion and Future Work We are in the process of completing the proofs for our latency and bu�er bounds. We are also attempting to verify a feasibility test that can be used as schedulability test for preemptive EDF scheduling and variants of the canonical EDF algorithm. The single processor model will be useful for evaluating simple signal processing applications, but the real bene t of the real-time data ow methodology is the ability to support a variable number of processors in a distributed system. After completing the single processor model, which has already yielded a surprising number of new results, we will extend the model to distributed systems. The distributed model can then be integrated into existing programs such as the RASSP project, or the An/UYS2A COTS Variant (ACV) being developed by Lucent Technologies for the Navy. References [1] Buck, J., Ha, S., Lee, E.A., Messerschmitt, D.G., \Ptolemy: A Framework For Simulating and Prototyping Heterogeneous Systems", International Journal of computer Simulation, special issue on Simulation Software Development , Vol. 4, 1994.
Q3
2
- ......-....
Qn
-
'$ &% Sink
1; 1 Nn+1
[2] Berry, G., Cosserat, L., \The ESTEREL Synchronous Programming Language and its Mathematical Semantics", Lecture Notes in Computer Science, Vol. 197 Seminar on Concurrency, Springer Verlag, Berlin, 1985. [3] Goddard, S., Je�ay, K., \A Temporal Semantics for Real-Time Data ow" , University of North Carolina, Department of Computer Science, Technical Report, in progress. [4] Lee, E.A., Messerschmitt, D.G., \Static Scheduling of Synchronous Data Flow Programs for Digital Signal Processing", IEEE Transactions on Computers , Vol. C-36, No. 1, January 1987, pp. 24-35. [5] Processing Graph Method Speci cation: Version 1.0 , prepared by the NRL for use by the Navy Standard Signal Processing Program O�ce (PMS-428), December 1987.