3011 Malibu Canyon Road. Malibu, CA 90265 ... effectively and efficiently consumed depends on the way and the time the ..... 3rd edition, 2000. [3] L.S. Angell ...
2004 IEEE Intelligent Transportation Systems Conference Washington, D.C., USA, October 3-6, 2004
TuC4.1
Driver Cognitive Workload Estimation: A Data-driven Perspective Yilu Zhang†
Yuri Owechko‡
†
‡
Electrical & Controls Integration Lab R&D and Planning, General Motors Cooperation 30500 Mound Road Warren, MI 48090
Abstract— Driver workload estimation (DWE) refers to the activities of monitoring the driver and the driving environment in real-time and acquiring the knowledge of driver’s workload continuously. With this knowledge of driver’s workload, the in-vehicle information systems (IVIS) can provide information when the driver has the spare capacity to receive and comprehend it, which is both effective and efficient. However, after years of study, it is still difficult to build a robust DWE system. In this paper, we analyze the difficulties facing the existing methodology of developing DWE systems and propose a machine-learning-based DWE development process. Some preliminary but promising results are reported using a popular machine-learning method, decision tree.
I. I NTRODUCTION The latest advances in wireless communication and computer technologies can enable many features to in-vehicle information systems (IVIS) and bring forth more enjoyable driving experiences. However, whether the information is effectively and efficiently consumed depends on the way and the time the information is delivered to the driver. For example, if the driver is performing a maneuver in traffic, information provided at the time may be ignored. Workload refers to the amount of resources that is required to perform a particular task [1]. Driver workload estimation (DWE) refers to the activities of monitoring the driver and the driving environment in real-time and acquiring the knowledge of driver’s workload continuously. In the driving environment, three major types of driver workload are usually studied, namely, visual, manual, and cognitive. Our research focus is driver’s cognitive workload, which is the most difficult to measure because it is essentially internal to the driver and not directly observable. There exist four major categories of cognitive workload assessment methods in present day practice [2]. They are primary task performance measures, secondary task performance measures, subjective measures, and physiological measures. Since workload estimation needs to be done in real-time and non-intrusively, only primary task performance measures and physiological measures are appropriate. Despite the strong interests and the large amount of effort on DWE, a robust DWE system is still very difficult to build. In this paper we analyze the difficulties facing the existing methodology. We propose a DWE architecture based
0-7803-8500-4/04/$20.00 ©2004 IEEE
Jing Zhang† Information Sciences Lab HRL Laboratories, LLC. 3011 Malibu Canyon Road Malibu, CA 90265
on mature machine learning techniques and report some preliminary but promising results by using this architecture. This paper concludes with some discussions on the future work. II. E XISTING M ETHODOLOGY The task of DWE is to identify driver’s cognitive status from the observations of the driver’s behavior. Most existing researches on cognitive workload estimation follow this pattern: First, analyze the correlation between various features, such as lane position deviation, and driver’s workload 1 . The features are usually selected according to the prior understanding of human behaviors and then tested upon well-designed experiments. While there are attempts reported to analyze the features simultaneously [3], usually the analysis is done on individual features [4] [5]. Second, based on the experimental results, models are designed to generate workload index by combining a few features of high correlation. We refer to the above methodology as manual analysis and modeling and the manual DWE design process is illustrated in Fig. 1. Researches along this line have achieved encouraging success. The wellknown existing models include the steering entropy [6] and the SEEV model [7]. However, there are yet difficulties in developing a robust cognitive workload estimator, the reasons of which are discussed below. First, the existing data analysis methods very much rely on the domain knowledge in the field of human behavior. Although many studies have been conducted and many theories have been proposed to explain the way that human beings manage resources and workload [8] [9] [10] [2], the relationship between overt human behavior and cognitive activities is by and large unclear by the scientific community. It is extremely difficult to design the workload estimation models based on this incomplete domain knowledge. Second, manual data analysis and modeling are not efficient. Until now, a very large number of features related to driver’s cognitive workload have been studied. A short list of them includes: lane position deviation, the number of lane departure, lane departure durations, speed deviation, lateral 1 The ground truth of driver’s workload is usually assessed by subjective measures, secondary-task performance, or the analysis of the task.
642
Subjective/ Secondary Measures
Driver
Fig. 1.
Vehicle
Sensors for: gaze position, pupil diameter, vehicle speed, steering angle, lateral acceleration, lane position, …
Subjective/ secondary measures
Manual analysis/ design DWE
Driver
Vehicle
Workload index
The existing DWE system design process.
Fig. 3.
Sensors for: gaze position, pupil diameter, vehicle speed, steering angle, lateral acceleration, lane position, …
Machine learning algorithm DWE
Workload index
The learning-based DWE development process.
p(t fd | lWL)
pdf
standard Bayesian analysis will tell the probability of high workload given the fixation duration,
p (t fd | hWL )
p(hW L|tf d ) =
Fixation duration
p(tf d |hW L)P (hW L) p(tf d |hW L)P (hW L)+p(tf d |lW L)P (lW L) .
III. L EARNING - BASED DWE The probability distribution function of fixation duration under high and low workload. Fig. 2.
deviation, steering hold, zero-crossing and steering reversal rate, brake pressure, the number of brake presses, and vehicle headway. With the fast advancing sensing technology, the list is quickly expanding. It has been realized that while each individual feature may not index workload well under various scenarios, the fusion of multiple features tends to provide better overall performance. However, in the course of modeling the data to predict workload, the handcrafted models tend to be either relatively simple, such as the linear regression models, or narrowly scoped by covering a small number of features. It is usually expensive and timeconsuming to iteratively design models over a large number of features and validate models on a huge data set. Third, most existing researches choose workload inference features by analyzing the correlation between the observations of driver’s behavior and driver’s workload level. This analysis requires the assumption of unimode Gaussian distribution, which is very likely to be violated in reality. In addition, a feature showing low correlation with the workload levels is not necessarily a bad workload indicator. For example, driver’s eye fixation duration is one of the extensively studied features for workload estimation. However, studies show contradictory findings in the relation between workload level and fixation duration. Some of them show positive correlation [11] [12] while others show negative correlation [13] [14]. Does this mean fixation duration is not a good workload indicator? Not necessarily. The fact, that the average fixation duration may become either longer or shorter when driver’s workload is high, implies that the probability distribution function (pdf) of fixation duration under high workload (p(tf d |hW L)) is multi-modal, as shown in Fig.2. With collected ocular data, one may estimate the conditional pdfs (p(tf d |hW L) and p(tf d |lW L)) and the prior probabilities for high and low workload (P (hW L) and P (lW L)). With this knowledge,
Machine learning is concerned with the design of algorithms that encode inductive mechanisms so that solutions to broad classes of problems may be derived from examples. It is essentially data-driven and is fundamentally different from traditional AI such as expert systems where rules are extracted mainly by human experts. Machine learning has been proved to be very effective in discovering the underlying structure of data and, subsequently, generate models that are not discovered from domain knowledge, in fields as varied as banking, medicine, marketing, condition monitoring, vision, and robotics. Machine learning technology has been implemented in the context of driver behavior modeling. Kraiss [15] showed that a neural network could be trained to emulate an algorithmic vehicle controller and that individual human driving characteristics were indentifiable from the input/output relations of a trained network. Forbes et.al. [16] used dynamic probabilistic networks to learn the behavior of vehicle controllers that simulate good drivers. Pentland and Liu [17] demonstrated that human driving actions, such as turning, stopping, and changing lane, can be accurately recognized very soon after the beginning of the action using Markov dynamic model (MDM). Oliver and Pentland [18] reported a hidden Markov model-based framework to predict the most likely maneuvers of human drivers in realistic driving scenarios. Despite these progresses and the obvious relation between with driver behavior and drive workload, there has been very few work that uses machine learning technology on DWE. Based on above considerations, we propose a learningbased DWE design process. That is, instead of manually analyzing the significance of individual features or a small set of features, we propose to consider the whole set of features simultaneously, use machine-learning techniques to tune the DWE module, and derive an optimized model to index workload. The learning-based DWE design process is shown in Fig. 3. Compared to the one shown in Fig. 1, the new process replaces the module of manual analysis/design with a module of machine learning algorithms.
643
Fig. 4. The screen of the driving scene is created by the GlobalSim
Vection Simulation Software. The scene is divided into eight regions in order to count the gaze entries in each region. The region boundaries were not shown on the screen during the experiment.
Changing from a manual analysis and modeling perspective to a machine-learning perspective will gain us much in terms of augmenting domain knowledge, and efficiently and effectively using data. Since a learning process is an automatic knowledge extraction process under certain learning criteria, it is very suitable for a problem as complicated as workload estimation. In addition, machine learning techniques are meant for analyzing huge amounts of data, discovering patterns, and extracting relationships. With the use of machine-learning techniques, such as decision tree, discriminant analysis, and neural networks, tedious manual process to derive combined workload index can be saved, therefore, taking full advantage of the availability of various sensors. Finally, most machine learning techniques do not require the assumption of the uni-mode Gaussian distribution. In addition to the advantages discussed above, this change makes it possible for a DWE system to be adaptive to individual drivers. We will come back to this issue in Section VII. Having stated the projected advantages, we want to emphasize that the learning-based approach benefits from the prior studies on workload estimation, which have identified a set of salient features, such as fixation duration, pupil diameter, and lane position deviation. We utilize the known salient features as candidate inputs. IV. DATA The data we used were collected from a driving simulator study that was conducted at the University of Illinois at Urbana-Champaign and supported by General Motors [19]. The simulator system has two high-end Ethernetconnected PCs running GlobalSim’s Vection Simulation Software version 1.4.1. One of the two computers (the subject computer) generates the graphical dynamic driving scenes on a standard 21-in monitor with the resolution of 1024 × 768, a screen shot of which is shown in Fig. 4. Subjects use a non-force feedback Microsoft Sidewinder
USB steering wheel together with the accelerator and brake pedals to drive the simulator. The second computer (the experimental computer) is used by an experimenter to create driving scenarios, and collect and store the simulated vehicle data, such as vehicle speed, acceleration, steering angle, lateral acceleration, lane position, and etc. To monitor the driver’s behavior closely, a gaze tracking system is installed on the subject computer, which runs at the same time as the driving simulation software. The gaze tracking system is an Applied Science Lab remote monocular eyetracker, Model 504 with Pan/Tilt optics and a head tracker. It measures the pupil diameter and the point of gaze at 60 Hz with an advertised tracking accuracy of about ±0.5 degree [20]. The gaze data is also streamed to and logged by the experimenter computer. Twelve students participated in the experiment. Each participant drove the simulator in three different driving scenarios, namely, highway, urban, and rural. There were two sessions of driving for each scenario, each lasting about 8-10 minutes. In each session, the participants were asked to perform secondary tasks (two verbal tasks and two spatial-imagery tasks) during four different 30-second periods called critical periods. In the verbal task, the subjects were asked to name word starting with a designated letter. In the spatial-imagery task, the subjects were asked to imagine the letters from A to Z with one of the following characteristics: a) remaining unchanged when flipped sideways, b) remaining unchanged when flipped upside down, c) containing a close part such as “A”, d) having no enclosed part, e) containing a horizontal line, f) containing a vertical line. Another four 30-second critical periods were identified as control sessions in each session, during which no secondary tasks were introduced. In the following analysis, we concentrate on the data during the critical periods. In total, there were 12 × 6 × 8 = 576 critical periods. Because of some technical difficulties during the experiment, the data from some of the critical periods were missing, which ended up with a total of 535 critical periods for use. The total number of data entries is 535 critical periods × 30 seconds × 60 Hz = 1036800. In this study, we did not have direct evidence of driver’s workload level, such as the subjective workload assessment, in the dataset. We made an assumption that drivers bear more workload when engaging in the secondary tasks. As we know, the primary driving task includes vehicle control (maintaining the vehicle in a safe location with an appropriate speed), hazard awareness (detecting hazards and handling the elicited problems), and navigation (recognizing landmarks and taking actions to reach destination) [21]. The visual perception, spatial cognitive processing, and manual responses involved in these subtasks all require brain resources. In various previous studies, many secondary mental tasks, such as verbal and spatial-imagery tasks, have been shown to compete the limited brain resources with the primary driving task and affect the drivers by reducing their hazard detection capability and delaying the
644
TABLE I
output values corresponding to the attribute vectors. The path from the root to a leaf describes a sequence of decisions made to generate the output value corresponding to an attribute vector. The goal of decision-tree learning is to find out the attribute and the values (or intervals) that are Features mspd : mean vehicle velocity the best splitting points of each node of the decision tree. Vspd : standard deviation of vehicle velocity The learning criterion can be to reduce entropy [23] or to mlp : mean lane position maximize t-statistics [24], among many others. Vlp : standard deviation of vehicle lane position For the concept-proof purpose, we used the decisionmstr : mean steering angle tree learning software, See5, developed by Quinlan [23] Vstr : standard deviation of steering angle macc : mean vehicle acceleration to do the learning. In a See5 tree, the attribute associated Vacc : standard deviation of vehicle acceleration with each node is the most informative one among the mpd : mean pupil diameter attributes not yet considered in the path from the root. Vpd : standard deviation of pupil diameter The significance of finding the most informative attribute ni : number of entries the gaze moving into is that making decision on the most informative attribute region, i, i = 1, 2, ..., 8 tsi : portion of time the gaze stay in region i can reduce the uncertainty about the ultimate output value i = 1, 2, ..., 8 to the highest extend. Specifically, the information metric, tvi : mean visit time region i, i = 1, 2, ..., 8 entropy H(S), is defined by,
T HE FEATURES USED TO PREDICT DRIVER ’ S WORKLOAD . T HE “ REGIONS ” REFER TO THE EIGHT REGIONS OF DRIVER ’ S FRONT VIEW AS SHOWN IN F IG . 4. Feature number 1 2 3 4 5 6 7 8 9 10 11-18 19-26 27-34
H(S) = −Σci=1 pi log2 (pi ), decision-making time [11] [12] [22]. Although a driver can respond by changing resource allocation strategy to make the cooperation more efficient, in general, the more tasks a driver is conducting at a time, the more resources he/she is consuming and, therefore, the higher workload he/she is bearing. Based on this assumption, we labeled all the sensor inputs falling into the dual-task critical periods with high workload. The sensor inputs falling into the control critical periods were labeled with low workload. We understand that driver’s workload may fluctuate during a critical period depending on the driving condition and her actual involvement to the secondary task. The labeling strategy we adopted was the best we could do. V. L EARNING P ROCESS Generally speaking, the DWE module implements a mapping from the sensory inputs, represented by a list of attributes of the driver in each estimation cycle, to the workload index. In particular, we preprocessed the raw inputs from the sensors and generated one vector of attributes (or features) as listed in Table I for each estimation cycle. In practice, we tried different estimation cycles with different time window sizes where the largest possible time window size is 30 seconds, which equals the duration of a critical period. While many learning methods can be implemented, such as Bayes learning, artificial neural networks, hidden Markov models, case based reasoning, and genetic algorithms, we used decision tree, one of the most widely used methods for inductive inference, to show the concept. A decision tree is a hierarchical structure in which each node corresponds to one attribute of the attribute vector. If the attribute is categorical, each arc branching from the node represents a possible value of that attribute. If the attribute is numerical, each arc represents an interval of that attribute. The leaves of the tree specify the expected
where, S is a set of data, c is the number of categories in S, and pi is the proportion of category i in S. The information gain is defined as Gain(S, A) = H(S) − Σv∈V alue(A)
|Sv | H(Sv ), |S|
where V alue(A) is the set of all possible values for attribute A, S is the set of data that has not be classified at current node, and Sv is the subset of S for which attribute A has value v. Since entropy is a measure of uncertainty, Gain(S, A) is the expected reduction of uncertainty or, in other words, the expected information gain caused by knowing attribute A. So, the most informative attribute Ami is decided by, Ami = arg
max
f or all As
Gain(S, A).
To improve the performance, a popular training mechanism called boosting is used. Simply speaking, boosting requires an iterative learning process. After a tree is trained upon a training set, a resubstitution test is done to find out what are the mis-categorized samples. Then a second round of training is done by increasing the percentage of exposure to the mis-categorized samples. Each round of retraining is called a boosting. VI. E XPERIMENTAL R ESULTS A. Results with significance analysis The researchers from the University of Illinois at UrbanaChampaign reported the effect of secondary tasks on driver’s behavior in terms of the following features: portion of gaze time in different regions of driver’s front view, mean duration of visits to different regions, mean pupil size, standard deviation of lane position, and standard deviation of the vehicle speed. The significance of the effect was based on the analysis of variance (ANOVA) respect to
645
TABLE II
TABLE IV
T HE AVERAGE CORRECT PREDICTION RATES WITH 40- FOLD CROSS - VALIDATION AND 20- TRIAL BOOSTINGS UNDER DIFFERENT TIME WINDOW SIZE .
T HE CORRECT PREDICTION RATES IN THE TASK - LEVEL TRAINING WITH VARIOUS FEATURE COMBINATIONS . Feature Combination All features Eyegaze-related features All but pupil-diameter features Pupil-diameter features only Driving-performance features
30 81.2
TABLE III
T HE CONFUSION TABLE FOR DRIVER - INDEPENDENT TRAINING WITH TIME WINDOW SIZE OF 30 SECONDS .
12
Single-task 50 215
B. Results with machine learning Table II shows the average correct prediction rates of the See5 trees trained with 20-trial boostings for different time window sizes. The best performance appeared when the time window size was 30 seconds, whose confusion table is shown in Table III. To understand the contribution of different subsets of the features to the prediction, we trained See5 decision trees using various combinations of the features with the task-level training. The performance for various groupings of features is shown in Table IV. The best performance we were able to obtain was 81% using all of features. The eyegaze-related features were more predictive than the driving-performance features since removing all the driving-performance feature from the training set reduced performance by only 1 percentage point from 81% to 80%. Removing the eyegaze-related features (feature 934), on the other hand, reduced performance from 81% to 60%. The pupil-diameter features were the most important eyegaze-related features. All of the driving-performance and eyegaze-related features, however, contributed to workload detection accuracy, albeit in varying degrees. Since See5 saves the learned tree in a text file, we can analyze it by counting how many times each of the feature appears in the file. We have found from past experience that there is a high correlation between feature frequency and
Eyegaze Features
8 6 4 2
33
31
29
27
25
23
21
19
17
15
13
9
0 11
each of these features individually. The general conclusion was that the effect of secondary tasks on some features was significant. However, there was an interaction effect of driving environments and tasks on features such as lane position, which means the significance of the task effect was not consistent over different driving environments [19]. It should be noted that the ANOVA assumes Gaussian statistics and does not take into account the possible multimodal nature of the feature probability distributions. Even for those features showing significant difference with respect to secondary tasks, a serious drawback of ANOVA is that this analysis only tells the significance on average. We can not tell from this analysis how robust an estimator can be if we use the features in a moment-by-moment base.
Correct Prediction Rate (%) 81 80 70 61 60
Driving Features
10
1
Dual-task 219 51
Frequency (%)
Workload prediction/Critical periods High workload Low workload
7
7.5 78
5
1.9 71
3
Time window size (s) Correct prediction rate (%)
Feature numbers
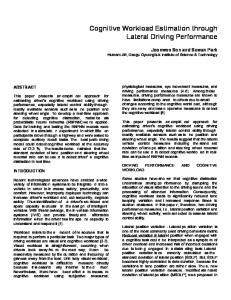
Fig. 5. Histogram of feature frequency in the workload estimator
trained by See5. Please refer to Table I for the features.
the predictive power of the feature. A histogram of feature usage in a learned ruleset is shown in Fig. 5. The feature with the highest frequency is the standard deviation of pupil diameter, which is consistent with the known correlation between pupil changes and workload [25], especially in the controlled illumination conditions of the driving simulator. Among the driving-performance features, speed deviation has the highest frequency, which is consistent with the ANOVA results done by the University of Illinois at UrbanaChampaign. It is noteworthy, however, that all of the features are used at least to some extent by the workload estimator, which indicates that all of the feature have some predictive power. The maximum predictive performance should be obtained when all of the features are used together. VII. C ONCLUSIONS AND F UTURE W ORKS In this paper, we proposed a machine-learning-based design process for driver cognitive workload estimation. The experimental results show that a driver’s cognitive status could be estimated with an average correct rate of more than 81%, which is encouraging considering the difficulty of cognitive workload estimation. Recall that our labeling strategy was that all the sensor inputs in the dual-task critical periods had high workload label and those in the control critical periods were labeled with low workload. Within each critical period, the driver might switch their attention between the driving and secondary tasks and, thus, change their actual workload level, which may have contributed to the error. In addition, in the conducted experiments, we used a general machine learning package. Usually a customized algorithm has a better performance than a general-purpose one. In the future, it will be interesting to see how much
646
improvement we can achieve with a fine tuned learning algorithm dedicated to our specific problem. The significance of learning-based DWE is not limited to quickly getting good estimation results. Most of the existing workload estimation systems work in a static mode. That is, the rules for workload estimation and the thresholds specified in the rules are determined through certain human factors studies before the vehicles are sold to the customers. Whether the induced rules represent the customer population very much depends on how the sample customers are selected and the sample size of the studies. It is also questionable whether one set of rules fit customers with different genders, different ages, different driving experiences, different education background, and etc. Ideally, the rules for DWE should be tailored to each individual driver in order to capture individual difference. Our preliminary study, reported in [26], showed that the correct prediction rate could be improved if the predictor was trained and tested on the same subject’s data. However, the manual analysis/design module in Fig. 1 prevents the adaptation process from being automated. On the other hand, the proposed learning-based method provides a possibility to get rid of this bottleneck. By specifying learning mechanisms, e.g. decision tree learning with reducing entropy as the learning criterion, the machine-learning algorithm module can do the data analysis and model design without manual interference. VIII. ACKNOWLEDGMENTS The authors would like to thank X.S. Zheng, G. McConkie, and Y.-C Tai for collecting the data under a contract with GM, which made this research possible. R EFERENCES [1] R.D. O’Donnel and F.T. Eggemeier, “Workload assessment methodology,” in Handbook of Perception and Human Performance, Vol II, Cognitive Processes and Performance, K.R. Boff, L. Kaufman, and J.P. Thomas, Eds. Wiley, New York, 1986. [2] C.D. Wickens and J.G. Hollands, Engineering Psychology and Human Performance, Prentice-Hall Inc., Upper Saddle River, NJ, 3rd edition, 2000. [3] L.S. Angell, R.A. Young, J.M. Hankey, and T.A. Dingus, “An evaluation of alternative methods for assessing driver workload in the early development of in-vehicle information systems,” in Proceedings of SAE Government/Industry Meeting, Washington, DC, May 2002. [4] J. Hurwitz and D.J. Wheatley, “Using driver performance measures to estimate workload,” in Proceedings of the Human Factors and Ergonomics Society 46th Annual Meeting, Santa Monica, CA, 2002, pp. 1804–1808. [5] C. Mayser, W. Piechulla, K.-E. Weiss, and W. Knig, “Driver workload monitoring,” in Proceedings of the Internationale ErgonomieKonferenz der GfA, ISOES und FEES, Mnchen, Germany, May 7-9 2003. [6] O. Nakayama, T. Futami, T. Nakamura, and E.R. Boer, “Development of a steering entropy method for evaluating driver workload,” in Proceedings of SAE International Congress and Exposition Detroit, Detroit, MI, March 1999. [7] C. D. Wickens, J. Helleberg, J. Goh, X. Xu, and B. Horrey, “Pilot task management: testing an attentional expected value model of visual scanning,” Tech. Rep. ARL-01-14/NASA-01-7, University of Illinois, Aviation Research Lab, Savoy, IL, 2001.
[8] S.K. Card, T.P. Moran, and A. Newell, “The model human processor: an engineering model of human performance,” in Handbook of Perception and Human Performance, pp. 1–35. John Wiley and Sons, New York, New York, 1986. [9] D.E. Kieras and D.E. Meyer, “An overview of the epic architecture for cognition and performance with application to human-computer interaction,” Human-Computer Interaction, vol. 12, pp. 391–438, 1997. [10] J.R. Anderson and C. Lebiere, The Atomic Components of Thought, Mahwah, NJ: Erlbaum, 1998. [11] Miguel A. Recarte and Luis M. Nunes, “Effects of verbal and spatialimagery task on eye fixations while driving,” Journal of Experimental Psychology: Applied, vol. 6, no. 1, pp. 31–43, March 2000. [12] J.L. Harbluk and Y.I. Noy, “The impact of cognitive distraction on driver visual behaviour and vehicle control,” Tech. Rep., Transport Canada, http://www.tc.gc.ca/roadsafety/tp/tp13889/en/menu.htm, February 2002. [13] M. Rahimi, R.P. Briggs, and D.R. Thom, “A field evaluation of driver eye and head movement strategies toward environmental targets and distracters,” Applied Ergonomiecs, vol. 21, no. 4, pp. 267–274, 1990. [14] P.R. Chapman and G. Underwood, “Visual search of dynamic scenes: event types and the role of experience in viewing driving situations,” in Eye Guidance in Reading and Scence Perception, G. Underwood, Ed., pp. 369–393. Elsevier, Amsterdam, 1998. [15] K.-F. Kraiss, “Implementation of user-adaptive assistants with neural operator models,” Control Engineering Practice, vol. 3, no. 2, pp. 249–256, 1995. [16] J. Forbes, T. Huang, K. Kanazawa, and S. Russell, “Batmobile: Towards a bayesian automated taxi,” in Proc. Int’l Joint Conf. on Artificial Intelligence, Montreal, Canada, 1995, pp. 1878–1885. [17] A.P. Pentland and A. Liu, “Modeling and prediction of human,” Behavior Neural Computation, vol. 11, no. 2, 1999. [18] N. Oliver and A.P. Pentland, “A graphical models for driver behavior recognition in a smartcar,” in Proc. of Intelligent Vehicles, Detroit, Michigan, October 2000. [19] X.S. Zheng, G.W. McConkie, and Y.-C. Tai, “The effect of secondary tasks on drivers’ scanning behavior,” in Proceedings of the 47nd Annual Meeting of the Human Factors and Ergonomics Society, October 2003, pp. 1900–1903. [20] Applied Science Lab Inc., Eye Tracking System Instruction Manual - Model 504, Applied Science Group Inc., Bedford, MA, 2001. [21] C.D. Wickens, S.E. Gordon, and Y. Liu, An Introduction to Human Factors Engineering, Addison-Wesley, New York, 1998. [22] M.A. Recarte and L.M. Nunes, “Mental workload while driving: effects on visual search, discrimination, and decision making,” Journal of Experimental Psychology: Applied, vol. 9, no. 2, pp. 119–137, 2003. [23] J. Quinlan, C4.5: Programs for Machine Learning, Morgan Kaufmann, San Mateo, CA, 1993. [24] D. Chapman and L.P. Kaelbling, “Input generalization in delayed reinforcement learning: An algorithm and performance comparisons,” in Proceedings of the Twelfth International Joint Conference on Artificial Intelligence (IJCAI-91), Sydney, Australia, 1991, p. 726731. [25] D. Kahneman, Attention and Effort, Prentice-Hall, Englewood Cliffs, NJ, 1973. [26] Y. Zhang, Y. Owechko, and J. Zhang, “Machine learning-based driver workload estimation,” in Proc. of the 7th International Symposium on Advanced Vehicle Control, Arnhem, Netherlands, August 23-27 2004.
647