DROWTION: Driver Drowsiness Detection Software Using MINDWAVE Giovanni1, Topo Suprihadi2, Kanisius Karyono3 Computer Engineering Department, ICT Faculty, Universitas Multimedia Nusantara Gading Serpong, Tangerang, INDONESIA 1
[email protected], 2
[email protected], 3
[email protected] Abstract—A Significant numbers of road accidents are caused by drowsy driver. This factor can be reduced if the drowsy condition of the driver can be identified and alarmed. This research is conducted by using Electroencephalography approach to detect drowsy state of the driver using Mindwave. Mindwave will sense the value changes of the driver's awareness caused by changes in concentration value. The changes between conscious and drowsiness state are mapped and used as threshold values for triggering the alarm. Result shows that the drowsy state is detected when the average value of low-alpha is below 0.7, the high-alpha value fall below 0.6 and the theta values is below 0.7 from the normal condition. The low-alpha values are sufficient enough to show the condition of drowsiness, but the high-alpha and theta value can be used to minimize the false alarm event. DrowTion application is developed based on this result. DrowTion is implemented with Mindwave headset with the capability of minimizing false alarm and having the capability of giving multiple alarms. Accuracy of DrowTion application in normal condition is about 68,11%. Keywords— EEG, DrowTion, drowsiness detection application, low-alpha value
Another approach is using sensor based in-vehicle system, to detect driver’s drowsiness [5]. The drowsy detection systems as mentioned before are relatively complex and have strong dependencies on some onboard sensors. Instead of implementing on-board sensor, this work focused on utilizing sensor which can have a direct contact with driver to detect drowsiness. For that reason, an independent and portable system is developed to detect drowsiness based on Electroenchephalography (EEG) approach. Previous study have been conducted to develop this kind of system [6] but the portability, the ease of use and the comfort ability factors are still become a problem. This study is conducted to overcome those problem and forms more reliable solution. Mindwave is used as a probe to detect the brain wave pattern of the user. This system can be used in various vehicles and can be moved from one to another. Application called DrowTion is built based on Windows Operating System using C# and can be installed in Windows based portable devices. This device can automatically get data from Mindwave, process it and give suggestion or alert to the users when the drowsy state detected.
I. INTRODUCTION II. RELATED WORK According to National Highway Traffic Safety Administration, at least, 1,500 people die in crashes related to fatigued or drowsy drivers in the United States of America each year. At least 40,000 people are injured in drowsy driver crashes in more than 100,000 crashes each year [1]. German insurance organization GDV's statistics reveal that about 25 percent of all fatal autobahn accidents are caused by tired or drowsy drivers. According to Automaker like Ford, Volvo, and others respond to this issue by developing a system to give alert when the abnormal driving behaviors detected [2]. But this feature is only available on the top-of-the-line cars or the new one. This feature cannot be added to a model for a custom features because many components in the system will need to be replaced and it must be done at the manufacturer site. Many efforts have been done to provide the solution for this problem. The first approach is using visual/imaging to monitor driver’s condition. Ranging from driver’s pupils detection [3] up to facial images analysis with neural network based algorithm for measuring the eye opening and closing [4].
Various studies have been conducted to analyze the connection between EEG and drowsiness condition. The brainwave signal that has correlation with the drowsy condition are Alpha and Theta wave. Some of the studies said that there are some differences in raw wave pattern in normal and drowsy state [7]. The previous study uses 2 stages of interpretation [6]. The first stage captured raw EEG voltages under normal & drowsy condition. The second stage judged drowsiness and triggered alarm. This previous study uses 2 microcontrollers, one for capturing raw data, while the second microcontroller is responsible for triggering drowsiness alarm. Based on the previous EEG research, our work use single channel dry sensor electrodes and this is already developed by MINDWAVE. The data reading then translated from analog to digital values and transmitted to Windows based device using MINDWAVE.
III. BACKGROUND THEORY A. Stages of Sleep Sleep is natural activity when the body rested. However, human brain activity changed drastically at that moment. In general, sleep consists of two basic states: rapid eye movement (REM) sleep and non-rapid eye movement (NREM) sleep. Basically NREM sleep was divided into: • Stage 1: the beginning of sleep. In this stage, the eye is closed but someone can be easily awakened. In this stage the theta and alpha wave is changed. • Stage 2: period of light sleep. In this stage, the heartbeat frequency and the body temperature are decreased. • Stage 3 & 4: deep sleep stages. In this stage, someone need some minutes to restore their consciousness. [8] Rapid Eye Movement (REM) is the next phase after nonREM sleep is exceeded. This phase occurs after a person is falling asleep approximately 90 minutes. In this stage, the brain activity is similar as people do not fall asleep [9]. B. Electroencephalography ( EEG ) Electroencephalography is used to record the electrical activity of the human brain. Impulse is generated electrically by the nervous system in the brain that can be measured by electrodes placed on certain parts of the human head. EEG provides an overview of human neural activity and can be used to detect brain physiology. EEG signal is measured in microvolt (μV) with frequencies up to 30 Hertz (Hz) [10].
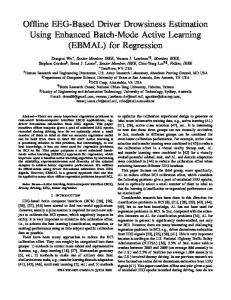
range. The Mindwave can detect blink strength, focus, and meditation of the user. There are 2 versions of Mindwave, the normal one (using RF to transfer data) and the mobile version (using bluetooth connection to transfer data)[11]. The Mindwave has been marketed as both an education and entertainment device [12]. Mindwave transmit data from the probe using Serial Communication Protocol. The Mindwave transmit the data asynchronously. Thinkgear Library is provided by Neurosky that help developers to get the data from the probe. Connection initialization provided by this library. It can classify packets to some variable that declared before. The baud rate of Mindwave is 57.600 [11]. IV. METHODOLOGY A. Hardware and Software Neurosky Mindwave is the smallest and cheapest EEG headset available right now. It used dry sensor electrode to read brain signal data. Thinkgear library was used to initialize connection and data transfer between the Mindwave and the computer. An application to log data sent by Mindwave was developed. This application classifies the data and saved them into *.csv file. During normal condition (active brain), every data are logged and then compared with the data from drowsy condition to check the differences between them. DatPlot Application was used to process and draw the graph for each data. DatPlot was chosen for its simplicity and ability to count the mean, minimum, and maximum value for each variable. The experimental framework can be seen in Figure 1.
EEG rhythmic activity is divided into frequency bands. Classification of EEG rhtmic activity can be seen in Table 1. TABLE I. Brainwave Type
EEG RYTHMIC ACTIVITY [11]
Beta
Frequency Range 0.1Hz to 3Hz 4Hz to 7Hz
Alpha
8Hz to 12Hz
Low Beta
12Hz to 15Hz 16Hz to 20Hz 21Hz to 30Hz 30Hz to 100Hz
Delta
Midrange Beta High Beta Gamma
Mental States and Condition Deep, dreamless sleep, non-REM sleep, unconscious Intuitive, creative, recall, fantasy, imaginary, dream Relaxed, but not drowsy, tranquil, conscious Formerly SMR, relaxed yet focused, integrated Blinking, aware of self & surroundings Alertness, agitation Motor Functions, higher mental activity
C. Neurosky Mindwave Mindwave is one of the Neurosky product released in 2010. It can be used to detect mental states of the user. Mindwave using dry electrodes to detect the brain wave of the user. The electrodes get the raw signal. Thinkgear chip then processes the raw signal and differentiate the value based on the frequency
Fig. 1. Experimental Framework
B. Data Collection and Manipulation Six data gathering scenario were created to get the comparison between the normal and drowsy condition. Table II shows the scenario to differentiate the normal brain activity and drowsy condition. Data will be compared between each group to analyze the characteristic. 3000 sample data are taken for each scenario to provide overview of the condition. Minimum 5 seconds initial delay are given before the application start to log. This procedure is needed to prevent Mindwave from getting false data. False data can be generated when the electrodes position are moved, unstable or loose which can lead to unstable brain wave signal generation. This condition often occurs after the subject changes his position and gets other interferences. The comparison was performed using DatPlot in Theta and Alpha Wave that indicate the drowsiness condition or stage 1 sleep.
TABLE II.
No. 1 2. 3. 4. 5. 6.
DATA GATHERING SCENARIO
Position Sit down Sit down Lie down Lie down Driving Driving
Condition Normal Drowsy Normal Drowsy Normal Drowsy
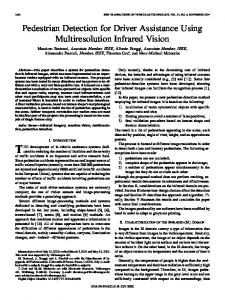
Retrieval of data in the scenario with the same position and difference condition was done without changing the electrode position of Mindwave. When the position changes, Mindwave will detect different values and make data set becomes invalid. Every data received by the application, will be initially checked whether it has the same value as the last data written. Raw value was detected by the electrodes. The rapid changing values are also detected, so values monitoring can be delivered directly based only on the raw value. This is done to prevent the duplication of data. V. RESULTS AND DISCUSSION Not all of the MINDWAVE generated data are used in this work. Only Alpha and Theta values are processed. Power spectral analysis was performed, plotted and compared for two conditions, normal and drowsy. Some differences were observed between two states: Drowsy & Normal within the same position of tests. The sample of Alpha and Theta plots of the collected data are shown in Figure 2
of coefficient X is exceeding 1, the value will be ignored because sleep state is not detected in that wave. TABLE III. SAMPLE COMPARISON RESULT BETWEEN NORMAL & DROWSY CONDITION FOR SIT DOWN AND LIE DOWN POSITION
TABLE IV.
SAMPLE COMPARISON RESULT BETWEEN NORMAL & DROWSY CONDITION WHILE DRIVING
TABLE V.
VALUE OF COEFFICIENT X
VI. DROWTION
Fig. 2. The Sample chart of low-alpha, high-alpha, and theta signal in DatPlot for Scenario 1 and 2
Drowsy states produced lower level of low-alpha, highalpha, and theta. Result of the research are shown in Table III and Table IV. Table III shows the result for scenario 1-4 which are Sit Down and Lie Down position both for normal and drowsy condition. Based on this data, the values of coefficient X are calculated which representing the value of drowsy condition compared with the normal one. Table IV shows the result for scenario 5 and 6 which are the result for driving, both for normal and drowsy condition. The trials for these scenarios are conducted more than previous scenario, to give more accurate result and better system performance. Coefficient X is generated based on the trial results. The coefficient calculation can be seen in Table V. When the value
Neurosky Mindwave, the cheapest and smallest EEG headset can indicate the drowsiness of the user. Although the initial goal is for entertainment and mental exercise, Mindwave also provide another potential if used properly. Another output of Mindwave that can be utilizing to detect drowsiness is lowbeta and high beta. But, there are some limitations of the headset because of using single channel electrodes, changes in electrode position affect the detection value. Thus, the application cannot save profile of the user and when the user changes the position of the electrodes, they have to do the callibration process again to get the normal condition data. DrowTion application was made based on the experiment result. The driver has to wear Mindwave headset while driving and activate DrowTion application in his device or smartphone. In this work, Windows based application is selected for development due to the availability of Mindwave. In this work, we use RF Mindwave. If Bluetooth Mindwave is available, the development of multiplatform DrowTion is much easier. Application is initialized by preparing memory and variables and then the application will start to get the normal condition data (callibration process). This process is carried out to overcome many disturbances that can cause reading error such as sensor position and the difference readings between different people. After the calibration process is complete, the detection process can be executed. The mean of each wave
(low-alpha, high-alpha, and theta wave) from the calibration are compared with the mean in detection process. When the mean from detection process are below the coefficient X then sleep counter in each wave will be increased. When the mean of the detection process are greater than coefficient +0.1 then the sleep counter will be decreased. Lowalpha has 2 times higher priority than high-alpha or theta because in low-alpha drowsy condition will always be detected. Algorithm to detect drowsiness in this application can be seen in Table VI. These counters are necessary to avoid false alarm while not reducing the performance of DrowTion to warn the driver.
VII. CONCLUSION Drowsiness detected when the average value of low-alpha is below 0.7, high-alpha is below 0.6, and theta is below 0.7 from the normal condition. Low-alpha can illustrate more than other waves to detect the actual condition of drowsiness. Thus, low-alpha has greater priority (2 times higher than high-alpha or theta). DrowTion is implemented with Mindwave headset with the capability of minimizing false alarm and having the capability of giving multiple alarms. Accuracy of DrowTion application in normal condition is about 68,11%. REFERENCES [1]
TABLE VI.
DROWTION ALGORITHM TO DETECT DROWSINESS
Condition
Explanation
DLA < XLA * CLA
DLA = Mean low-alpha detection XLA = X low-alpha (0.7) CLA = Mean low-alpha callibration
DHA < XHA * CHA
DHA = Mean high-alpha detection XHA = X high-alpha (0.6) CHA = Mean high-alpha callibration DT = Mean theta detection XT = X theta (0.7) CT= Mean theta callibration
DT < XT * CT
Changed in Value SleepA1 Counter =2
SleepA2 Counter =2 SleepT Counter =2
DrowTion is designed to warn the driver when drowsiness is detected. Alarm in DrowTion application would go on when sleepCounter reaches minimum 4 (Table VII). This system is also equipped with multiple alarm and special settings can be implemented in the program, such as ringing louder alarm when the counter reach higher values. TABLE VII.
SLEEPCOUNTER FORMULA
Formula
Condition
Output
sleepCounter= SleepA1Counter*2+ SleepA2Counter+ SleepTCounter
sleepCounter = 0
Normal
sleepCounter = 2
Alarm not ringing
sleepCounter = 4
Alarm I
sleepCounter = 6
Alarm II
sleepCounter = 8
Alarm III
DrowTion is tested against false alarm. From 48 cycles, DrowTion generated 3 false alarms or about 6.25%. DrowTion is also tested when driver is getting drowsy with average accuracy of 68.11%. During testing in extreme condition (the driver was in heavy drowsy condition), the result is 86.9% accurate.
Phil Konstantin, “Statistics Related to Drowsy Driver Crashes”, http://americanindian.net/sleepstats.html, last accessed: July 18, 2014. [2] Euro NCAP, “Ford Active City Stop”, http://www.euroncap.com/ rewards/Ford_ActiveCityStop.aspx, last accessed: March 19, 2014. [3] Richard Grace and Sonya Steward, “Drowsy Driver Monitor and Warning System”, First International Driving Symposium on Human Factors in Driver Assessment, Training and Vehicle Design, pp. 64-69, Iowa University, 2001. [4] Itenderpal Singh and Banga, “Development of a Drowsiness Warning System using Neural Network”, International Journal of Advanced Research in Electrical, Electronics and Instrumentation Engineering, Vol. 2, Issue 8, August 2013, pp. 3614-3623. [5] Ronald R Knipling and Walter W. Wierwille, “Vehicle-Based Drowsy Driver Detection: Current Status and Future Prospects”, IVHS America Fourth Annual Meeting, Atlanta, GA, April, 1994. [6] Neelima, S.Sri Lakshmi and T.Jaya Vardhan, “Design and Development of Warning System for Drowsy Drivers”, International Journal of Scientific and Research Publications, Volume 3, Issue 11, November 2013. [7] Choi, Jones, “Using Brain-Computer Interfaces to Analyze EEG Data for Safety Improvement,” Team for Research in Ubiquitous Secure Technology, 2010. [8] Pinel, J.P.J., “Biopsychology”, Needham Heights, MA: Allyn & Bacon, 1992. [9] Dement, W.C., “Some must watch while some must sleep”, New York: W.W.Norton, 1978 [10] Niedermeyer E. and da Silva F.L., “Electroencephalography: Basic Principles, Clinical Applications, and Related Fields”, Lippincot Williams & Wilkins, 2004 [11] Neurosky, “Brain Wave Signal (EEG)”, NeuroSky, Inc., http://frontiernerds.com/files/neurosky-vs-medical-eeg.pdf, last accessed: December, 2009. [12] Fiolet, Eliane, "NeuroSky MindWave Brings Brain-Computer Interface to Education", Ubergizmo, www.ubergizmo.com, last accessed: March 19, 2014.