Natural Hazards 33: 137–159, 2004. © 2004 Kluwer Academic Publishers. Printed in the Netherlands.
137
Drought Monitoring Using Data Mining Techniques: A Case Study for Nebraska, USA TSEGAYE TADESSE1, DONALD A. WILHITE1 , SHERRI K. HARMS2, MICHAEL J. HAYES1 and STEVE GODDARD3
1 National Drought Mitigation Center, University of Nebraska, Lincoln, Nebraska, 68583-0728, USA (E-mail:
[email protected],
[email protected],
[email protected]); 2 Department of Computer Science and Information Systems, University of Nebraska, Kearney, Nebraska, 68849, USA (E-mail:
[email protected]); 3 Computer Science and Engineering, University of Nebraska, Lincoln, Nebraska, 68588, USA (E-mail:
[email protected])
(Received: 4 April 2003; accepted: 17 October 2003) Abstract. Drought has an impact on many aspects of society. To help decision makers reduce the impacts of drought, it is important to improve our understanding of the characteristics and relationships of atmospheric and oceanic parameters that cause drought. In this study, the use of data mining techniques is introduced to find associations between drought and several oceanic and climatic indices that could help users in making knowledgeable decisions about drought responses before the drought actually occurs. Data mining techniques enable users to search for hidden patterns and find association rules for target data sets such as drought episodes. These techniques have been used for commercial applications, medical research, and telecommunications, but not for drought. In this study, two time-series data mining algorithms are used in Nebraska to illustrate the identification of the relationships between oceanic parameters and drought indices. The algorithms provide flexibility in time-series analyses and identify drought episodes separate from normal and wet conditions, and find relationships between drought and oceanic indices in a manner different from the traditional statistical associations. The drought episodes were determined based on the Standardized Precipitation Index (SPI) and Palmer Drought Severity Index (PDSI). Associations were observed between drought episodes and oceanic and atmospheric indices that include the Southern Oscillation Index (SOI), the Multivariate ENSO Index (MEI), the Pacific/North American (PNA) index, the North Atlantic Oscillation (NAO) Index, and the Pacific Decadal Oscillation (PDO) Index. The experimental results showed that among these indices, the SOI, MEI, and PDO have relatively stronger relationships with drought episodes over selected stations in Nebraska. Moreover, the study suggests that data mining techniques can help us to monitor drought using oceanic indices as a precursor of drought. Key words: drought indices, oceanic indices, drought, data mining, decision making.
1. Introduction Drought is an adverse environmental phenomenon that influences almost all aspects of society. It is a normal feature of climate and its occurrence is inevitable (Wilhite, 2000a; Rosenberg, 1978). A drought’s impact and extent varies from one region to another. However, the strategies and principles underlying the task of managing drought risk are similar, regardless of the specific situations that coun-
138
TSEGAYE TADESSE ET AL.
Figure 1. Map of selected stations to illustrate the use of data mining in Nebraska, USA.
tries face (O’Meagher et al., 2000). This implies that extracting information about drought characteristics that include its spatial extent, severity, and frequency are important everywhere to decision makers such as government officials and other users with wide regional and national interests. To identify relationships between different climatic parameters and to distinguish patterns that may be used to predict drought, large historical data sets are essential. In light of this, it is critical to have an efficient way to extract information from large databases and to deliver relevant and effective information for drought risk management. One of the recently developed techniques for such purposes is data mining. Data mining uses a variety of data analysis tools to discover patterns and relationships of physical variables in different data sets (Two Crows, 1999). This technique is used in multidisciplinary fields. For example, the method is used for commercial applications by many companies for designing strategic benefits to increase profitability (Groth, 1998). One of the applications of data mining for these commercial companies is predicting (or identifying) the customers most likely to buy certain products. This helps decision makers to effectively identify market demand. It is also used to understand trends in the marketplace. This reduces costs and improves timeliness of products reaching the market. Recent studies consider this method to be one of the best tools to identify the demand and supply of any product, as well as the patterns of the customers to be profitable in an “emerging market” (Cabena et al., 1998; Groth, 1998; Kryszkiewicz, 1998). In this study, we employ data mining to identify complex relationships involving atmospheric and oceanic variables that potentially cause droughts over selected stations and statewide areas of Nebraska, USA (Figure 1).
DROUGHT MONITORING USING DATA MINING TECHNIQUES
139
2. The Problem In studying drought characteristics and impacts, Wilhite (1993) emphasized that the occurrence of extended drought over several months, seasons, or years often results in serious economic, environmental, and social consequences. Moreover, multi-year drought events result in significant economic impacts in many sectors such as agriculture, transportation, and energy. According to Dewey (1996), the world’s vulnerability to drought has increased steadily over the centuries primarily because of an ever-increasing population that puts heavy demand on water and natural resources. Over the past century, virtually all portions of the United States experienced several extended severe droughts as well as many short-term droughts, resulting in considerable losses (Svoboda et al., 2002; Wilhite, 2000b; Hayes et al., 1999). In their study, Ross and Lott (2000) pointed out that the eight major droughts that occurred in the US between 1980 and 1999 accounted for the largest percentage (43%) of weather-related monetary losses. The second largest percentage (30%) was due to hurricanes and tropical storms. This shows that the damage due to drought is far greater than the damage from other weather-related disasters. In 1995, the Federal Emergency Management Agency (FEMA) estimated that droughts cause $6–8 billion in losses in the US each year, more than any other weather-related disaster (FEMA, 1995). In 2002, about 30 states in Great Plains, much of the eastern US, and western states were in drought (NCDC, 2002). The preliminary estimates of damages/costs due to this drought were more than $10 billion. Because of these significant impacts, drought monitoring is an integral part of drought preparedness planning and is essential in making sound and timely decisions that will reduce drought impacts in the future. An increased understanding of drought events will improve the development and implementation of drought planning and mitigation actions (Wilhite, 2000b). One of the challenges in understanding drought is the large volume of data for numerous climate and hydrologic variables and indices, and the variety of spatial and time scales for which these data exist. Data mining is one recently developed technique that might help solve this problem, improving drought monitoring by identifying spatial and temporal patterns of drought characteristics as well as finding the association of these characteristics with oceanic processes. This information can be used in making knowledge-driven decisions to reduce the impacts of drought through better monitoring. It is the goal of this study to find the relationships between oceanic/atmospheric indices and drought; and to identify the drought episodes within a certain timelag of the occurrences of oceanic and atmospheric indices so that the product can be used by decision makers in Nebraska, USA. This will increase the knowledge of drought characteristics for more effective drought planning and management. In this study, two time-series data mining algorithms are used in Nebraska to illustrate the methodology used to identify the relationships between oceanic/atmospheric
140
TSEGAYE TADESSE ET AL.
parameters and drought indices. It is hoped that this method can provide additional information that will enhance decision makers’ ability to take appropriate and timely mitigation actions. 3. Background 3.1. BRIEF EXPLANATIONS OF THE INDICES USED IN THIS STUDY In monitoring climatic parameters such as precipitation, some studies (Glantz, 1994; Ogallo, 1994; Philander, 1990; Ropelewski and Halpert, 1987) attempted to find the global relationships of ocean-atmosphere interactions and climatic parameters such as precipitation variability. The results indicate that the upper air and surface synoptic meteorological conditions are affected by this strong relationship. For example, a large, persistent upper-level high-pressure ridge over the central part of the United States contributes to dryness in Nebraska. This ‘blocking’ upper-air pattern can be linked to sea surface temperature anomalies in the Pacific and Atlantic Oceans (Ropelewski and Halpert, 1986). Based on such relationships, it is important to consider the impacts of the variability of the oceanic/atmospheric parameters using the oceanic/atmospheric indices while monitoring drought. Moreover, oceanic parameters such as Sea Surface Temperature (SST) and oceanic processes such as El Niño and Southern Oscillation (ENSO) are changing in a much longer timescale than processes over land (Wallace and Vogel, 1994; Diaz and Markgraf, 1992). Considering this characteristic, it is logical to use the oceanic data to monitor climatic parameters such as precipitation deficit based on its associations with oceanic parameters. Furthermore, the models that are used to predict these oceanic parameters are improving with more observations and technological advancement (McPhaden et al., 1998; Halpert and Ropelewski, 1992; Philander, 1990). The following most common oceanic and atmospheric indices were selected for this study. 3.1.1. The Southern Oscillation Index (SOI) The SOI is computed using monthly mean sea level pressure anomalies at Tahiti (T), French Polynesia, and Darwin (D), Australia. The standardized monthly mean sea level pressure anomaly SOI [T-D] is an index that combines the Southern Oscillation into one series (Trenberth and Hoar, 1996). A positive SOI means La Niña and negative SOI indicates El Niño conditions. 3.1.2. Pacific/North American (PNA) Index The PNA index is derived using the formula: PNA = 0.25∗ [Z(20N,160W) – Z(45N,165W) + Z(55N,115W) – Z(30N,85W)], where Z is a standardized 500 hPa geopotential height value (Wallace and Gutzler, 1981). The values in brackets show the latitude and the longitude position of the geopotential heights. This index
DROUGHT MONITORING USING DATA MINING TECHNIQUES
141
shows the upper atmosphere conditions. Monthly average values of the PNA are used in this study. 3.1.3. Multivariate ENSO Index (MEI) MEI is calculated based on six main observed variables over the tropical Pacific. These six variables are: sea-level pressure, zonal and meridional components of the surface wind, sea surface temperature, surface air temperature, and total cloudiness fraction of the sky (Wolter and Timlin, 1993). A positive MEI is associated with El Niño and negative values indicate La Niña conditions. 3.1.4. The Pacific Decadal Oscillation (PDO) Index The PDO index is defined as the leading principal component of North Pacific monthly sea surface temperature variability poleward of 20N (Francis and Hare, 1994). The monthly values of the PDO index are used to associate the North Pacific conditions with the local drought in Nebraska in this study. The positive values show the warm phase of the North Pacific sea surface temperature, and the negative values show the cold phase. 3.1.5. North Atlantic Oscillation (NAO) Index The NAO index is defined as the normalized pressure difference between a station on the Azores and one on Iceland (Hurrell, 1995). Since it is computed based on stations to the north (Iceland) and south (Azores) of the middle latitude westerly flow, it could be considered as a measure of the strength of these winds. The positive values show strong mid-latitude westerly flow while the negative values show the weak mid-latitude westerly flow (Hurrell, 1995). 3.2. DATA MINING CONCEPTS Data mining is a recent technology with great potential for identifying the most important information in databases. Data mining is part of a larger process called knowledge discovery. Essentially, data mining discovers patterns and relationships hidden within large amounts of data. Data mining may be considered as advances in statistical analysis and modeling techniques to find useful patterns and relationships (Edelstein, 1997). Data mining algorithms are also useful for data automation that is designed to allow users to create ‘intelligent’ data sets by discretizing or converting data from many formats into compatible and user friendly formats. This process of automation makes it easier to execute different functions of the algorithms to the desired output without human interference and within a relatively short time. Thus, data mining tools can answer questions that traditionally were too time-consuming to resolve. These tools search databases for hidden patterns and find predictive information that experts may miss because it lies outside their expectations.
142
TSEGAYE TADESSE ET AL.
Recent developments in computing have provided the basic infrastructure for fast data access as well as many advanced computational methods for extracting information from large quantities of data. These developments have created a new range of problems and challenges for data analysts, as well as new opportunities for intelligent systems in data analysis. According to Thearling (2001), data mining techniques are the result of a long process of research and product development. He indicates that this evolution began when business data were first stored on computers, continued with improvements in data access, and, more recently, generated technologies that allow users to navigate through their data in real time. Data mining takes this evolutionary process beyond retrospective data access and navigation to prospective and proactive information delivery. Data mining algorithms represent techniques that have recently been implemented as mature, reliable, understandable tools that are consistently outperforming older statistical methods in commercial applications (Thearling, 2001). Studies (Bigus, 1998; Cabena et al., 1998) show that data mining tools can also be used in predicting future trends and behaviors, allowing businesses to make proactive, knowledge-driven decisions. Similarly, data mining algorithms and models such as decision trees, associations, clustering, classification, regression, sequential patterns, and time series forecasting have the potential to identify drought patterns and characteristics. For example, time series data mining can be applied in monitoring patterns of drought events.
4. Time-Series Data Mining Time-series data mining applications organize data as a sequence of events, with each event having a time of occurrence. In data analysis applications on a sequence of events, one of the main challenges is finding similar situations. This is essential when trying to predict future events and understand the dynamics of the process producing the sequence (Mannila and Seppänen, 2001). Time-series data mining algorithms are being developed for many applications to identify hidden patterns within time-series data (Berry and Linoff, 2000; Klemettine, 1999; Groth, 1998). These algorithms are designed to characterize and predict non-periodic complex phenomena (Povinelli, 2000; Huang and Yu, 1999; Keogh and Pazzani, 1998; Edelstein, 1997). Because drought is sensitive to the time sequence of atmospheric and oceanic parameters, time-series data mining techniques can better contribute to identification of drought episodes and quantification of the relationships between the oceanic and atmospheric parameters. Thus, in a realworld application such as drought, it is important to study the relationships of the oceanic and atmospheric parameters that cause drought by considering the time of their occurrences. In this study, two recently developed time-series data mining algorithms were used to find the relationships of drought and oceanic/atmospheric indices by considering time lags of their occurrences (Harms et al., 2002; Tadesse, 2002). These
DROUGHT MONITORING USING DATA MINING TECHNIQUES
143
algorithms are the Representative Episodal Association Rule (REAR) and the Minimal Occurrences With Constraints and Time Lags (MOWCATL). Both algorithms are briefly discussed in the following sections.
4.1. THE REPRESENTATIVE EPISODES ASSOCIATION RULES ( REAR ) ALGORITHM
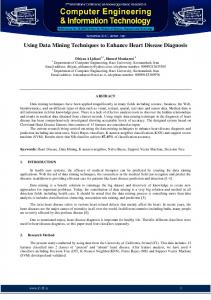
The Representative Episodes Association Rules (REAR) algorithm (Harms et al., 2001b) converts the time-series data into discrete representations and generates association rules. The pre-processing of the time-series data for the REAR algorithm begins by discretizing (segmenting into groups of records) the data. These discretized data form events in sequential data. In a data-mining context, a combination of events in an event sequence creates an episode with a time-specified order (Mannila et al., 1997). In other words, an episode occurs in a sequence if events are consistent with the given order, within a given time frame, called window width. Thus, an episode P is a pair (V , type), where V is a collection of events. In this pair, the type of episode is called parallel if no order is specified in a window, and serial if the events of the episode have a fixed order. The frequency of an episode is defined as the number of windows in which the episode occurs divided by the number of total windows in the data set. The REAR algorithm finds episodes of events that occur together in a relatively short time interval (window width). To process the data using the REAR algorithm, a sliding window is used by sequentially moving the window one step at a time through the data. The user can set the window width and the minimum frequency value. With the complete set of repeated episodes, association rule patterns within the episodes are generated. The association rule generated is defined as “if X then Y”, where X is the rule antecedent and Y is its consequent. The support and confidence of the rule are used to measure the goodness (“interestingness”) of the rule. Support of the rule is simply a measure of statistical significance. It is defined as the ratio of the count of the number of windows of the episodes X and Y occurring together divided by the total number of windows. In association rules, the support of the antecedent is also called the rule coverage. To select the best rule, one of the measures used is the confidence of the rule. For each rule, the confidence is defined as the ratio of support {X ∪ Y }, which is the percentage of events that occur in both X and Y , divided by the support of X (rule coverage). This is a measure of the conditional probability. For example, if X occurred 16% of the time and both X and Y occurred together 10% of the time, then the confidence is 10/16 (63%). In a sequential data mining algorithm, this computation of confidence is different from the traditional statistical computation of confidence. To generate rules for drought, the REAR algorithm counts occurrences of the drought episodes that occur together with other oceanic parameters within the sliding window. Then the algorithm keeps the repeated episodes that occur at more than the predetermined minimum frequency (Harms et al., 2002). Rules are gen-
144
TSEGAYE TADESSE ET AL.
Figure 2. Generation of rules using representative episodal association rule (REAR) algorithm.
erated using the antecedent (oceanic indices) and consequent (drought episodes) constraints to keep track of the target episodes (droughts). This identifies the global oceanic parameters and drought episodes of the association rules in the form of: if X (e.g., global oceanic indices values) then Y (e.g., moderate, severe, or extreme drought) occurs with more than a pre-assigned minimum confidence. For example, the rule may hypothetically show that if the Southern Oscillation Index (SOI) values are greater than 1.5, then severe droughts occur in Nebraska with more than 80% confidence. Figure 2 shows the flow chart used to generate rules using the REAR algorithm. It should be noted that the number of rules generated depends on the minimum frequency, the window width, and the minimum confidence values. In selecting these parameters one may have to consider the advantages and disadvantages of the parameters on the outputs (i.e., rules that are generated). For example, if a wider window width is selected, more relationships may be found but the analysis and interpretation of the rules may be difficult. 4.2. THE MINIMAL OCCURRENCES WITH CONSTRAINTS AND TIME LAGS ( MOWCATL ) ALGORITHM The Minimal Occurrences With Constraints And Time Lags (MOWCATL) algorithm is used to find relationships between sequences in the multiple data sets, where a lag in time exists between the antecedent and the consequent. In addition to
DROUGHT MONITORING USING DATA MINING TECHNIQUES
145
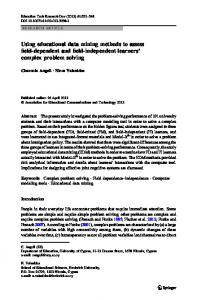
the traditional frequency and support constraints in sequential data mining, MOWCATL uses separate antecedent and consequent inclusion constraints, and separate antecedent and consequent maximum window widths, to specify the antecedent and consequent patterns that are separated by a time lag. This approach is based on association rules combined with frequent episodes, time lags, and event constraints (Harms et al., 2002). The advantage of this algorithm over the REAR method is that it can handle a lag time between the occurrence of the antecedent and the occurrence of the consequent. The MOWCATL algorithm is attractive for drought applications because it is quite likely that there is a natural time lag between the oceanic parameters (antecedents) and the drought events (consequents). Technically, the MOWCATL approach identifies minimal occurrences of episodes along with their time intervals. The minimal occurrence of an episode in an event sequence is determined when the episode occurs in the window and does not occur in any other proper sub-window. Then, instead of counting the frequency of the episodes as in REAR, the number of minimal occurrences is counted as the support of the episode. Episodes that do not meet the minimal support threshold are pruned when the rules are generated. MOWCATL has three window parameters: the maximum window width of the antecedent (wina ), the maximum window width of the consequent (winc ), and the time lag. Using these parameters, the algorithm generates episodal rules where the antecedent episode occurs within a given maximum window width, the consequent episode occurs within a given maximum window width, and the start of the consequent follows the start of the antecedent within a given maximum time lag. A hypothetical example of a generated rule might be that: if SOI is greater than 1 and MEI is less than –1.5, and these occur within 2 months of each other, then within 3 months they will be followed by severe drought occurring with more than 70% confidence. MOWCATL can find serial and parallel episodes. Serial episodes within a time series are episodes that consider the time order of the occurrence of each episode within a window, whereas in parallel episodes the episodes can occur without time order. For serial episodes, the starting time of the oceanic parameters must be greater than or equal to the ending time of the drought events, and must be less than or equal to the starting time of the oceanic parameters plus the time lag. Also, the drought event ending time must be greater than the ending time of the oceanic parameters. For a zero time lag, the REAR algorithm can be used instead of MOWCATL. In contrast, for parallel episodes, the starting time of the drought events must follow the starting time of the oceanic parameters and can differ at most by the time lag. Because the order of the events in the parallel episodes is not important, parallel episodes are used to see if the events in one episode occur “close” to the events in the other episode. Figure 3 shows the flow chart used to generate rules using the MOWCATL algorithm. In the MOWCATL algorithm, the time lag constraint can be either a fixed time lag constraint or a maximum time lag constraint. With fixed time lag,
146
TSEGAYE TADESSE ET AL.
Figure 3. Generation of rules using minimal occurrences with constraints and time lags (MOWCATL) algorithm.
the occurrence of oceanic parameters (antecedent) and the drought episodes (consequents) are separated with fixed time. This may be used to monitor parameters that occur an exact number of time lags before the consequent. With the maximal time lag constraint, the start of the consequent follows the start of the antecedent after at least one time step, and at most the set lag time steps. This may be used to monitor parameters that occur within a range of time before the consequent. Both REAR and MOWCATL rule discovery methods use the J-measure (Smyth and Goodman, 1992) as an objective measure to select best rules. The formulation of J-measure takes into consideration both frequencies on the left and right sides of a rule. Therefore, it not only favors rules that occur more frequently, but also provides a more complex metric for ranking rules in a manner such that the user can trade off rule support and rule confidence. In general, the MOWCATL approach is well suited for sequential data mining problems that have groupings of events that occur close together, but occur relatively infrequently over the entire data set. It is also well suited for problems that have periodic occurrences when the signature of one or more sequence is present in other sequences, even when the multiple sequences are not globally correlated. Both REAR and MOWCATL algorithms are designed as exploratory methods. Thus, iterative and interactive application of the approach coupled with human interpretation of the rules is likely to lead to the most useful results, rather than a fully automated approach (Harms et al., 2002). These analysis techniques facilitate the evaluation of the temporal associations between episodes of events and the
DROUGHT MONITORING USING DATA MINING TECHNIQUES
147
incorporation of this knowledge into decision support systems. In the following section, this new approach was used to conduct an experiment on selected Nebraska stations.
5. Experimental Results In monitoring drought, time-series data of meteorological, climatological, and oceanic parameters were used to generate rules that could identify the probable occurrence of drought. The justification for using oceanic parameters to monitor drought is based on the general assumption that ocean-atmosphere relationships have an impact on drought. Since changes in oceanic parameters develop more slowly than surface meteorological parameters, one can understand the trend of the oceanic parameters better than the trend of surface parameters such as surface temperature changes or precipitation deficits (McPhaden et al., 1998). Thus, oceanic parameters can be considered as antecedents and droughts as consequents in finding their relationships. As an experiment, both algorithms were used to find relationships between drought episodes at several stations in Nebraska and other climatic oceanic indices for the period from 1950 to 1999. The atmospheric and oceanic indices used in this experiment include the PNA, MEI, NAO, PDO, and SOI. The drought indices (i.e., PDSI and SPI) for each station were also used to generate rules. Out of these stations, to demonstrate the uses of these algorithms, three weather stations in Nebraska were selected (Figure 1). These stations were Clay Center (southcentral), Hayes Center (southwest), and West Point (northeastern Nebraska). For a comparison and a broader look at the state level, the Nebraska state-averaged climate data were also used. In this experiment, the monthly values from the oceanic and drought indices were converted into discrete representations and classified into seven categories. The seven drought indices categories are: extremely dry, severely dry, moderately dry, normal, moderately wet, severely wet, and extremely wet. The thresholds for classification of the drought indices are shown in Table I. The seven SPI and PDSI drought categories are based on the classifications used by the National Drought Mitigation Center (Hayes, 2003). However, in the PDSI classification, we aggregated the values of “incipient” and “mild dry” categories within normal ranges to make it consistent with seven classification categories. The oceanic parameters were also divided into seven categories using thresholds, as shown in Table II, based on their frequency distribution through their historical records. Assuming a normal distribution of the 50 years data, each oceanic and atmospheric parameter values divided into 0.5, 1, and 1.5 standard deviations from the normal frequency distribution. Thus, Table II shows the division of these values based on this criterion for classifying the values for each parameter. For example, the SOI data was discretized into 7 clusters as follows: SOI1 is Category 1 in which the values of SOI is greater than 1.5 standardized
–2 < x ≤ –1.5 –4 < x ≤ –3
≤ –2 ≤ –4
SPI PDSI
–1.5 < x ≤ –1 –3 < x ≤ –2
Moderately dry (md) –1 < x < 1 –2 < x < 2
Normal (n)
SPI = Standardized Precipitation Index; PDSI = Palmer Drought Severity Index.
Severely dry (sd)
Extremely dry (ed)
Drought category 1 ≥ x < 1.5 2≥x