DSP EVALUATION MODULE USAGE IN STUDENTS LABORATORY A. Podgorski and K. Wisniewski Institute of Radioelectronics Faculty of Electronics and Information Technology Warsaw University of Technology, 00-665 Warsaw, Poland Abstract: In the paper the application of the digital signal processor (DSP) evaluation module (EVM) in the students laboratory in the Institute of Radioelectronics of Warsaw University of Technology is shown. The laboratory stand built on the base of Motorola’s DSP56002EVM card is described. The software for the card, written in the processor assembler, and for the personal computer, written in LabWindows/CVI and MATLAB environments, are shortly presented. The way in which the EVM module can be used is also given. Keywords: DSP, laboratory stand, training in signals
1. INTRODUCTION In the courses entitled ”Signals and Systems” and “Circuits and Signals” the students of the Faculty of Electronics and Information Technology of WUT have to learn the basis of the signals processing theory. There is a manual [1] dedicated for the laboratory exercises and some manuscripts [2], [3]. One of the laboratory exercises is dedicated for the sampling of the analogue signals [4] and the other one – the investigations of the resonance circuits [5]. The aim of the first exercise is to learn the base of the signal sampling and its reconstruction, to be familiar with the frequency methods of analogue and digital signals description and to meet the stroboscope and aliasing effects. The aim of the second exercise is to learn the properties of the resonance circuits: series (voltage), parallel (current) and with the capacitive coupling taking into account the real exciting source and the loses in the circuits. The laboratory stand for these two students laboratories is based on the same, each time properly programmed, DSP card [6] and a computer with the LabWindows [7] and Matlab [8] environment. The implementation of the signal processor enables one to calculate and process the signals from the audio frequency band in the real time, to demonstrate many digital effects and to be familiar with the modern digital signal processing. The application of the LabWindows interface enables the user to control easily the stand. The data transmission between the card and the PC is realised by the RS 232C interface.
2. LABORATORY STANDS The laboratory stands consists of: the properly programmed personal computer; the DSP56002EVM card enabling the A/D and D/A signal conversion in the real time; the function generator as the source of the investigated signals; the dual channel oscilloscope; the speakers and headphones set (for signal sampling); the specially designed board with resonance circuit (for the resonance investigations). On the card the 24-bits fixed point Motorola’s DSP 56002 processor with the 40 MHz clock and Cristal’s CS 4215 Coder/Decoder are placed. The CS 4215 consists of two 16-bits A/D and two 16-bits D/A converters with the common clock up to 48 kHz. On the card there is one analogue input, two analogue outputs, digital input and output in the TTL standard directly connected to the processor and the RS 232C interface connector. In the socked the EPROM can be placed in which the processor’s programme can be stored. • • • • • •
3. LABORATORY STAND PROGRAMMES According to the idea of the virtual measurement instrument the programme is responsibly for the application and the laboratory set performance. This general approach enables the user to modify easily the set of functions and to wide the possibilities of the instrument in order to fulfil the growing up demands. The programme modification allows performing different laboratory exercises using the same hardware configuration. The developed programme consists of three parts described below.
3.1
Personal computer’s programme
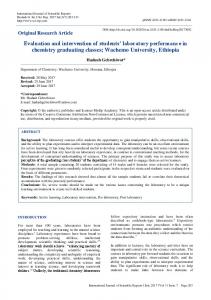
The computer programme written in C language in National Instruments’ LabWindows/CVI environment is dedicated to control the system and to analyse the results. It can be executed on any PC with the VGA card and with MS Windows version 3.1 or higher. After the start of the programme on the computer’s screen the main panel is presented. The view of the panel depends on the exercise being executed. In the case of the “Signal Sampling and Reconstruction” it is as in Fig. 1.
Figure 1. The view of the main panel in the case of ”Signal Sampling and Reconstruction” exercise
Figure 2. The generation of the sine signal in the “Signals Sampling and Reconstruction” exercise The user can select the proper button in order to perform the consecutive steps of the exercise. On a graphical panel the time series taken from the card or generated inside are presented. The values of the parameters are set by the panel’s slides or edited directly. The ZOOM option enables the user to view more precisely the selected part of the signal. The SAMPLE function enables the user to collect the required number of samples and to store them in the DSP and PC memory. The sampling is performed with the frequencies: 8 kHz, 16 kHz, 32 kHz or 48 kHz selected with the slider. The SIGNAL GENERATOR function enables one to generate the signals with the required parameters. The following signals are available: sine (cf. Fig. 2), rectangle, triangle and noise. The SEND function enables the user to send the data to DSP memory and to reconstruct the signal on their base. The
DSP Options menu enables one to select special effects like echo, spectrum shifting, noise gate, lowpass and high-pass filtration. The programme co-works with the MATLAB universal environment for the engineering calculations for MS Windows. All data are written to the files readable by MATLAB. After starting execution of this environment one can execute the prepared scripts with the functions of sophisticated data processing, e.g. spectrum analysis of the signal (cf. Fig. 3) before and after quantisation.
Figure 3. Sampled signal and its spectrum presented in the MATLAB environment In the case of the exercise “Resonance Circuits” the view of the front panel is quite different (cf. Fig. 4). The DSP module plays in this exercise the role of the virtual wobbuloscope. On the presentation panel the resonance curves are observed. In the Frequency range window the user can select the starting and ending frequency of the wobbuloscope (from 10 Hz to 20 kHz). In the step freq window the step of the tone generation is chosen. This value should be correlated with the previously described parameter: for the wide frequency range the step should be short (the measurement should not last too long). The amplitude parameter selects the level of the generated signal. The ZOOM option enables the user to view more precisely the selected part of the signal. Using the cross the user is able to read out the frequency and the amplitude of the selected point of the curve. The logarithm or linear scale can be selected (the Log Scale button). The CLEAR button is used for erasing the contents of the display before the new measurement. It is also possible to see a few curves on one screen.
Figure 4. The view of the main panel in the “Resonance Circuits” exercise
3.2 Digital signal processor programme
This programme is written in the DSP’s assembler language, which enables the code and memory management optimisation. After the powering of the card the contents of the EPROM is transferred to the DSP memory and the processor starts the programme execution. The interrupts priority are defined, the converters and the serial port are initialised and the processor starts to wait for the user’s commands. The programme enables the processor to read out the commands and to execute them e.g. the input signal sampling, the data storing in the cyclic buffer, the data processing by the DSP, the data or results transfer to the personal computer – for the case of the “Signal Sampling and Reconstruction”; the wobbulation procedure starting with the defined parameters Fmin, Fmax and step – in the case of the “Resonance Circuits”. In the latter case, after starting the generation of the sinusoidal signal with the known frequency (using for this purpose the Tchebyszev polynomials), the processor waits for the stable signal from the investigated circuit. Then DSP collects the data, searches the maximal value and stores it in the buffer. Later on the frequency of the generated signal is increased by the value of the step parameter and the process is repeated until the Fmax frequency is achieved. The time of the tone generation depends on its frequency: the time for lower frequencies is longer than for the higher. After achieving the Fmax frequency the programme waits for the new user commands.
3.3 Data transmission Data transmission is performed using the simple RS 232C serial interface available on each PC. The parameters of the transmission can be selected. As a standard 10-bits asynchronous mode is chosen (start, 8-bit data, stop) with 19.2 kb/s. The 24-bits data from the DSP are sent sequentially in 8bits portions and they are „glued” in the PC.
Figure 5. The RS 232C interface configuration.
4. SIGNAL SAMPILNG AND RECONSTRUCTION - EXEMPLARY TASKS The following measurements and investigations are performed in this exercise: • Analogue signal sampling using the A/D converter placed on the DSP card; off-line processing in the MATLAB environment. • Analogue signal sampling and its reconstruction from the samples with the different sampling time period and the signal’s frequency. • Analogue signal sampling in the lower audio frequency band and its processing in the real time using the DSP card. The block diagram of the laboratory stand for this exercise is presented in Fig. 6.
Signal Generator
A/D
D/A
OSCILLOSCOPE
Out Inp DSP56002EVM RS232C
COMPUTER
Figure 6. The block diagram of the laboratory stand for “Signal Sampling and Reconstruction”
4.1 The investigation of the relation between the signal and its spectrum The aim of this part is to observe the discrete signal after sampling, its spectrum, step signal obtained from the discrete signal, its spectrum and the effects which occur during the sampling with too small frequency (Nyquist’s frequency). The signal (periodic or not) with the different frequency from the function generator (sinusoidal, rectangular, triangular) is applied to the A/D input of the DSP card. The effect of the sampling with the constant frequency is observed on the computer’s screen.
4.2 The investigation of the aliasing and the stroboscope effects The aim of this part is the observation of the effects related to the sampling and the signal reconstruction - the aliasing and the stroboscope effects. During the experiments the audio signal with the different frequencies is applied to the A/D input and the obtained discrete signal is directed to the D/A converter. The relations between the sampling and the signal frequencies are investigated.
4.3 The investigation of the signal processing by the DSP The aim of this part is the demonstration of the power of the digital processor in the real time audio signals processing. The analogue signal from the generator or from the radio is applied to the A/D input of the card. The discrete signal is going through the digital low or high pass filters (the coefficients of the filters can be changed), its spectrum is shifted, the echo effects and the discrimination level (noise gate) are presented on the oscilloscope and/or the speakers set.
5. RESONANCE CIRCUITS - EXEMPLARY TASKS The following circuits are investigated in this exercise: • the series (voltage) resonance circuit; • the parallel (current) resonance circuit; • the resonance circuits with the capacitive coupling. The block diagram of the laboratory stand for this exercise is presented in Fig. 7. OSCILLOSCOPE A/D Inp
Out
Out1
Inp DSP56002 EVM
D/A
RS232C
Out2
Out3 Out4 Out5
Resonance cuircuit board
COMPUTER
Figure 7. The block diagram of the laboratory stand for “Resonance Circuits” exercise The most of the measurements is performed automatically using described wobbuloscope. Only a few measurements are executed manually with the function generator and the dual-channel oscilloscope, mainly for the didactic purposes.
5.1 The investigation of the series resonance circuit • The estimation of the series circuit parameters: the capacity of the circuit - C, quality factor QR, the characteristic resistance - ρ, the equivalent series resistance - RC for RW =0Ω and for RW =51Ω. • The measurement of the voltage on the capacitors and the circuit inductive reactance for RW =0Ω. • The estimation of the amplitude characteristic of the general resonance curve for RW =0Ω.
5.2 The investigation of the parallel resonance circuit • The estimation of the parallel circuit parameters: the capacity of the circuit - C, quality factor QR, the dynamic resistance - Rd for RW =20Ω and for RW =51.
5.3 The investigation of the resonance circuit with the capacitive coupling • The observation on the wobbuloscope screen the frequency characteristics for the different values of the coupling capacity. • The estimation of the coupling impedance value |Z| = 1/ωC for the critical and over(-critical) coupling. • The measurement of the distance between the maximum of the frequency characteristics for the over-critical coupling and the estimation the value of the band as a function of the coupling impedance. The exemplary view of the computer screen during the investigations of the resonance circuits with the capacitive coupling is presented in Fig. 8.
Figure 8. The exemplary view of the virtual wobbuloscope screen during the investigations of the resonance circuits with the capacitive coupling
6. CONCLUSIONS The application of the DSP-based evaluation module in the different laboratory stands enables one to perform diverse exercises using the same hardware equipment. According to the idea of the virtual measurement instrument, the programme is responsible for the application and the laboratory set performance. Modifying the programme one can fulfil different tasks with the low-cost, easily available units. The application of the LabWindows environment enables the user to design graphic interface which on the PC screen simulates different instruments.
REFERENCES [1] J. Wojciechowski (ed.), Signals and systems - lab. exercises (in Polish), OW PW, Warsaw 1998. [2] K. Radecki, Laboratory of Circuits and Signals – Manual for the Exercise “Resonance Circuits”, (in Polish), IR PW, Warsaw 1999. [3] A. Podgórski, Laboratory of Signals and Systems – Manual for the Exercise “Signal Sampling and Reconstruction”, (in Polish), IR PW, Warsaw 1999.
[4] A. Podgórski, K. Wisniewski, Signal Sampling and Reconstruction on the Base of Samples – the Exercise Project in the Laboratory of Signals and Systems, Proc. of the XXXI’MKM Conf. (in Polish), Bialystok, Poland, 7-10.IX.1999. [5] A. Podgórski, K. Wisniewski, The Implementation of the Wobbuloscope for the Needs of the Laboratory of Circuits and Signals, to be published in Proc. of the XXXII’MKM Conf. (in Polish), Rzeszów, Poland, IX.2000. [6] DSP56002EVM Product Information; Motorola [7] LabWindows/CVI Users Manual, National Instruments, Feb. 1998 Ed., Part Number 320681D-01. [8] MATLAB - The Language of Technical Computing; Using Matlab version 5, The Math Works Inc. th
AUTHORS: Assist. Prof. Ph. D. Andrzej PODGÓRSKI, 5 year student Krzysztof WISNIEWSKI, Institute of Radioelectronics, Faculty of Electronics and Information Technology, Warsaw University of Technology, 00-665 Warsaw, ul. Nowowiejska 15/19, Poland, Phone Int. +48 22 660 54 53, Fax Int. +48 22 825 52 48, E-mail:
[email protected]