THE QUAD BIKE PERFORMANCE PROJECT
Part 2: Dynamic Handling Test Results (Report 2)
Transport and Road Safety (TARS) Research
Part 2:
DYNAMIC HANDLING TEST RESULTS REPORT 2 by
Professor Raphael Grzebieta, Adjunct Associate Professor George Rechnitzer Mr. Keith Simmons
TRANSPORT AND ROAD SAFETY (TARS) University of New South Wales Sydney, Australia for
THE WORKCOVER AUTHORITY OF NEW SOUTH WALES 92-100 Donnison Street, Gosford, New South Wales 2250, Australia. January 2015
1
Part 2: Dynamic Handling Test Results (Report 2)
Contents Acknowledgements: .................................................................................................................. 3 Disclaimer................................................................................................................................... 5 Further Information ................................................................................................................... 5 1. Executive Summary ............................................................................................................... 6 2. DYNAMIC STABILITY AND HANDLING TEST PROGRAM FOR QUAD BIKES AND SSVs ......... 11 2.1 Introduction ................................................................................................................. 11 2.2 The Dynamic tests ........................................................................................................ 14 2.2.1 Introduction .......................................................................................................... 14 2.2.2 Steady-state circular driving tests ......................................................................... 22 2.2.3 Lateral transient response tests............................................................................ 28 2.2.4 Bump obstacle perturbation tests ........................................................................ 31 2.2.5 Repeatability Testing ............................................................................................. 38 2.3 The Dynamic Test Results ............................................................................................ 38 2.3.1 Steady-state circular driving behaviour – limit of lateral acceleration ........................................................................................................... 38 2.3.2 Steady-state circular driving behaviour – understeer/ oversteer characteristics ....................................................................................... 41 2.3.3 Lateral transient response time ............................................................................ 45 2.3.4 Test results - bump obstacle test .......................................................................... 48 2.3.5 Repeatability of results ......................................................................................... 51 2.3.6 Different riding positions (simplified Active Riding) ............................................. 52 2.3.7 Comparison with Standards .................................................................................. 54 3. DYNAMIC STABILITY AND HANDLING OVERALL RATING INDEX FOR THE 17 TEST VEHICLES ............................................................................................................................. 56 3.1 Points Ratings ............................................................................................................... 56 3.2 The Dynamic Handling Overall Rating Index ................................................................ 57 3.3 Observations from the Dynamic Handling Overall Rating Index ................................. 57 4. CONCLUSIONS ..................................................................................................................... 60 4.1 The Dynamic Handling Test Results ............................................................................. 60 4.2 The Dynamic Handling Overall Rating System and Further Research ......................... 62 5. References ........................................................................................................................... 64 6. Appendix 1: Copy of US CPSC letter to ROVA dated 28th August 2013 .............................. 67
2
Part 2: Dynamic Handling Test Results (Report 2)
Acknowledgements: This is the second major test report for the Quad Bike Performance Project, and follows on from Part 1: Static Stability Test Results report. Although Dynamic Handling testing was initially not part of the Quad Bike Performance Project, it became apparent during the project that adding the Dynamic Handling testing could be done at an incremental additional cost, which fortunately (and gratefully) was able to be funded by NSW WorkCover with support from the NSW State Government. The Authors are particularly grateful to Mr. Tony Williams and Ms. Diane Vaughan from the NSW WorkCover Authority and to the NSW State Government for providing the bulk of the funds and making it all happen for this vitally important safety project. The contributions from Mr. Steve Hutchison and Mr. Victor Turko from the Australian Competition & Consumer Commission (ACCC) are also gratefully acknowledged for the additional funding to include the three recreational Quad bikes into the test matrix. The contribution by the Heads of Workplace Safety Authorities Australia (HWSA) is also gratefully acknowledged. The Project Team would particularly like to thank, with much appreciation, the Roads and Maritime Services Crashlab test team led by Ross Dal Nevo (Crashlab Manager), Mr. Drew Sherry and other Crashlab staff for their outstanding and dedicated work in conducting this extensive and very demanding testing program, and providing the results and comprehensive test reports (see Attachment 1). Dr. David Renfroe from EI Consultants1 was hired as a consultant to the project. The work of Dr. David Renfroe from EI Consultants, LLC (formerly known as The Engineering Institute, LLC) in assisting with the development and analysis on the Dynamic Handling test programme has been particularly helpful and greatly appreciated. The Authors also wish to acknowledge the contribution of Dr. John Zellner from Dynamic Research Inc. (USA) 2, Mr. Cameron Cuthill and Mr. James Hurnall from the Federal Chamber of Automotive Industries (FCAI) in their review of the reports and generous time, support, technical assistance and comments provided. The development and tuning of the ‘bump’ type dynamic test was also largely as a result of Dr. John Zellner’s advice and assistance. The Authors would also like to gratefully thank all members of the Project Reference Group and in particular the following people for their various valuable contributions and comments:
Mr. Colin Thomas from Thomas-Lee Motorcycle Pty Ltd, Moore, NSW and other Quad bike and SSV distributors;
1
http://www.enginst.org/
2
http://www.dynres.com/
3
Part 2: Dynamic Handling Test Results (Report 2)
Mr. Paul Vitrano formerly from the Specialty Vehicle Institute of America (SVIA);
Mr. Neil Storey and Ms. Liela Gato from Safe Work Australia;
Mr. Charlie Armstrong from the National Farmers’ Federation;
Dr. Yossi Berger from the Australian Workers’ Union;
A/Prof Tony Lower from the Australian Centre for Agricultural Health and Safety;
Professor Gordon Smith from Department of Epidemiology & Public Health, University of Maryland School of Medicine;
Mr. Jim Armstrong, Branch President Warragul Branch, Victorian Farmers Federation;
Members of the Australian Defence Force, namely Lt Col Colin Blyth, Lt Col Damien McLachlan, Maj Bill Collins, and Lt Col Andrew Heron;
Commissioner Rob Adler, Mr. Jason Levine and Mr. Perry Sharpless from the Consumer Product Safety Commission (CPSC), Bethesda, USA for discussions focussed on the Australia testing of Quad bike and SSVs (ATVs and ROVs);
Mr. Jörgen Persson and Prof. Claes Tingvall from the Swedish National Road Authority, Trafikverket in Borlänge Sweden and Professor Tomas Nordfjell, Professor of Forest Technology at the Swedish University of Agricultural Sciences in Umeå, Sweden for scheduling a two day workshop and discussions focused on Quad bike and SSV (ATV) safety;
The Academy of Sciences, Transport Research Board’s (TRB), ANB 45 Occupant Protection Committee Co-Chairs Joann Wells and Dr. (Capt.) Ruth Shults and TRB’s Mr. Bernardo Kleiner for allowing the scheduling of ANB45(1) sub-committee meetings focused on Quad bike and SSV (ATV and ROV) rollover safety;
Mr. Stephen Oesch (consultant) from the USA for assistance with US Quad bike and SSV (ATV and ROV) data and discussions with US researchers.
Finally, the Authors would like to acknowledge the hard work and valuable contributions of the TARS Quad bike Project Team members: Adjunct A/Prof Andrew McIntosh, Dr. Rebecca Mitchell, Dr. Tim White, Dr. Mario Mongiardini, Mr. David Hicks, Dr. Declan Patton, and Dr. Jake Olivier, and particularly the administration team looking after the accounts and project administration, namely Ms. Sussan Su and Mr. Nick Pappas and the TARS Director Professor Ann Williamson for her encouragement, support and patience.
4
Part 2: Dynamic Handling Test Results (Report 2)
Disclaimer The analyses, conclusions and/or opinions presented in this report are those of the Authors and are based on information noted and made available to the Authors at the time of its writing. Further review and analyses may be required should additional information become available, which may affect the analyses, conclusions and/or opinions expressed in this report. While the project has been widely researched and developed, with much input from many sources worldwide, the research methods, ratings system, conclusions and recommendations are the responsibility of the Authors. Any views expressed are not necessarily those of the funding agencies, the Project Reference Group, FCAI or others who have assisted with this Project. This report, the associated reports and the results presented are made in good faith and are for information only. It is the responsibility of the user to ensure the appropriate application of these results if any, for their own requirements. While the Authors have made every effort to ensure that the information in this report was correct at the time of publication, the Authors do not assume and hereby disclaim any liability to any party for any loss, damage, or disruption caused by errors or omissions, whether such errors or omissions result from accident, or any other cause.
Further Information Correspondence regarding the Project and Reports should in the first instance, be by email to Professor Raphael Grzebieta, at
[email protected] or to the WorkCover Authority of NSW, attention Mr. Tony Williams, at
[email protected].
5
Part 2: Dynamic Handling Test Results (Report 2)
1. Executive Summary The Quad Bike Performance Project (QBPP) is aimed at improving the safety of Quad bikes, in the workplace and farm environment by critically evaluating, conducting research, and carrying out testing, to identify the engineering and design features required for improved vehicle Static Stability, Dynamic Handling and Rollover Crashworthiness including operator protective devices and accessories. This is being done through the application of a Quad bike and Side by Side Vehicle Star Rating system (ATVAP: Australian Terrain Vehicle Assessment Program) to inform consumers purchasing vehicles for the workplace and farming environment. This is the second major test report for the Quad Bike Performance Project (QBPP), and follows on from Part 1: Static Stability Test Results (Report 1), for the 17 vehicles (16 production vehicles and one prototype Quad bike) and Operator Protection Devices tested (Figure 1 and Figure 2). The reader is referred to Report 1 for the detailed introduction and background to the Project (also see Rechnitzer et al. 2013), which is not repeated here. Hence, this Report provides a summary of the methodology used, key findings and analyses from the Dynamic tests and its significance to the Project, Quad bike and SSV safety, and ratings. The industry (through FCAI) claim that there is currently no incident statistical data available or collected to enable determining the correlation (if any) between a vehicle’s handling characteristics and collision and injury risk. The Authors strongly disagree with this claim and have set out the basis for this in Section 2.2.1 Introduction. The Dynamic Handling tests were carried out at Crashlab and the grounds at Sydney Dragway, Eastern Creek race track. Over 546 tests were carried out. The full Crashlab Test Report (written by Mr. Drew Sherry and Mr. Ross Dal Nevo), the methods used and all test results for each of the sixteen production vehicles tested are provided in Attachment 1. Following on from the Static Stability test program for the 17 vehicles (includes the prototype Quad bike), the dynamic test program provides the second arm of the assessment and rating of production Quad bikes and SSVs for stability and handling. Improvements in Quad Bike and SSV handling has been highlighted by authors such as Roberts (2009) and others as being practical means to reduce crash and rollover risk. The Part 1: Static Stability Test Results (Report 1) and Part 2: Dynamic Handling Test Results (Report 2) are combined with Part 3: Rollover Crashworthiness Test Results (Report 3) of the Project involving testing the crashworthiness of the 17 vehicles, with the objective of developing an Australian Terrain Vehicle Assessment Program (ATVAP) relative rating system to inform consumers purchasing vehicles for the workplace and farming environment. There is a fourth report (Report 4) which is titled Final Project Summary Report: Quad Bike Performance Project Test Results, Conclusions and Recommendations. There is also a
6
Part 2: Dynamic Handling Test Results (Report 2)
Supplemental Report that presents a summary of the ‘Examination and Analysis of Quad Bike and Side By Side Vehicle (SSV) Fatalities and Injuries’ carried out by McIntosh and Patton (2014) and Mitchell (2014) and some further analysis by the co-Authors Grzebieta, Rechnitzer and Simmons. All these ‘final’ reports are dated January 2015. However, it should be noted that the first drafts of these reports were completed much earlier and parts were subsequently amended following feedback from NSW WorkCover Authority, Industry and International Reviewers. First draft dates are provided in Table 1 in Report 4: (Final Project Summary Report: Quad Bike Performance Project Test Results, Conclusions and Recommendations). As mentioned above, the dynamic test program consisted of 546 tests, in three different dynamic tests series (see Attachment 1) all relating to vehicle control and handling characteristics which are likely to improve a driver’s/ rider’s vehicle path control and the vehicle’s resistance to rollover: 1.
Steady-state circular driving behaviour dynamic tests to determine each vehicle’s limit of lateral acceleration and the understeer/ oversteer characteristics. The Steady-state circular driving behaviour test consisted of slowly accelerating each vehicle from rest whilst tracking around a circle of 7.6m radius. The vehicle was accelerated until it either: lifted the two inside tyres off the ground and tipped up; could no longer stay on the circle; or the rear of the vehicle slid out causing the vehicle to point towards the inside of the circle; or the vehicle could not travel any faster.
2.
Lateral transient response dynamic tests to determine each vehicle’s time taken to respond to steering manoeuvres. The test consisted of driving the vehicle in a straight line at a velocity of 20km/h and then rapidly inputting a steering response to generate a lateral acceleration of 0.4g. The yaw rate to steering response time was recorded.
3.
Bump obstacle perturbation tests to determine each vehicle’s response characteristics while riding over asymmetric bumps in terms of change in steering direction or displacement and lateral and vertical acceleration of the test dummy. These tests represent the ability of the vehicle to ride over ground obstacles that could in some circumstances precipitate loss of control and consequential rollover. The test consisted of towing the vehicle in a straight line towards a 150mm high semicircular ‘bump’ object lined up with either the right or left vehicle track. Each vehicle ‘free-wheeled’ over the obstacle unaffected by the tow system. An Anthropomorphic Test Device (ATD) was positioned on the vehicle with the pelvis acceleration recorded.
The steady-state circular driving behaviour and lateral transient response tests were conducted at Sydney Dragway, Eastern Creek, NSW Australia. The bump obstacle perturbation tests were conducted at Crashlab, Huntingwood, NSW, Australia. While most testing was conducted on a dry asphalt surface (for reproducibility purposes), to identify the effects of different surfaces on handling, some testing was also conducted on dry grass and loose bluemetal over compacted roadbase. Each test configuration was tested
7
Part 2: Dynamic Handling Test Results (Report 2)
three times to establish result repeatability. Results tables are contained in the Crashlab Report, Appendix C (Attachment 1). Results show and confirm that Quad bikes can be reliably tested and rated for handling characteristics using such surfaces. Of course there are other surfaces and soil conditions such as wet mud, sand, tilled soil, etc., which may not be represented by these tests. The key findings from the dynamic tests are: 1. For the Quad bikes, the measured minimum limit of lateral acceleration at tip up, with rider hips centred and buttocks in contact with the seat, was in the range of 0.36g to 0.55g, and for each Quad bike was less than the Tilt Table Ratio (TTR). Such tipping up can be counteracted to some degree by the rider moving their body around relative to the vehicle (‘Active Riding’). However, depending on the vehicle and rider, at best a 10%20% gain in regards to increasing TTR might be achieved. The tests carried out and results presented in this report are for a worst case scenario where the rider was not ‘Actively Riding’, i.e. in the majority of farm related fatalities. The circle tests validated that the tilt-table static stability TTR value provide valid measures of the lateral stability (i.e. level of rollover resistance) of Quad bikes. 2. All Quad bikes limit of lateral acceleration on these test surfaces in a quasi-constant speed steady turning condition, occurs by tipping up onto two wheels, and is a precursor to rollover or loss of control – that is, a loss of stability. 3. For the SSVs, these vehicles showed higher limits of lateral acceleration, i.e. higher rollover resistance) than the Quad bikes, and did not tip up except for the Yamaha Rhino. These results are generally consistent with the Static Stability tilt-table tests, which showed higher stability metrics for the SSVs. 4. The Authors note that the most recent US CPSC’s (2014) study recommends an increase in lateral stability in the current standards, to require a minimum lateral acceleration at tip up for SSVs of 0.70g in a 30 mph (48 km/h) J turn test to reduce the risk of rollover. 5. The three Quad bikes that were tested on dry asphalt and dry grass displayed very similar handling characteristics and tipped up at similar lateral acceleration values on both surfaces. Testing of Quad bikes on an asphalt surface did provide relevant, reproducible performance characteristics. 6. The Honda TRX250 Quad bike3 was used as a representative Quad bike for comparing the effects of surface type, load combinations and ‘Active Riding’ on lateral stability. With Active Riding (on asphalt), the dynamic stability values increased by approximately 13%, from 0.46g up to 0.52g. The maximum value was very similar to the tilt table TTR (without Active Riding) of 0.51g.
3
A ‘representative’ Quad was selected for these comparison tests. It was beyond the scope and budget of this dynamic test program to be able to test all of the 17 vehicles in all load and surface combinations. As noted well in excess of 546 tests were conducted in this dynamic test program alone.
8
Part 2: Dynamic Handling Test Results (Report 2)
7. The example Quad bike (Honda TRX250) when tested with the Quadbar and Lifeguard OPDs, showed only a minor change in limit of lateral acceleration (0.46g down to 0.45g). The Quick-fix OPD was not tested as it was not recommended for fitment as an OPD to any Quad bike in Part 1: Static Stability Test Results report. This was because of the Quickfix’s effect on reducing a Quad bike’s TTR by up to 14%. The Quickfix unit also restricts a rider from standing upright on the vehicle limiting the ability to correctly use Active Riding techniques. 8. The results overall obtained show that most Quad bikes tested for this program have an oversteer characteristic, which is not a favourable characteristics for most workplace riding situations. Notably, the Honda TRX700 recreational Quad bike, showed a light understeer characteristic of around 2 degrees per g through to above 0.5g. This is considered a very good steering characteristic and demonstrates that it is quite possible to design the steering system of a Quad bike to produce the recommended handling results for a work place environment. 9. In order to handle well (consistently and safely) and reduce the risk of a loss of control crash occurring, a Quad bike or SSV, like any other self-propelled vehicle, should have a slight understeer characteristic when excited between 0.1g and 0.5g lateral acceleration. 10. All vehicles tested unloaded on asphalt had steering response times of less than 0.3 seconds, with a significant number of the vehicles displaying steering response times of less than 0.2 seconds (see Figure 23), which is generally considered to be satisfactory. 11. The ‘bump tests’ identified, possibly for the first time, a significant mechanism where riders on some Quad bikes may have lost control while traversing moderately sized bumps (similar to half-buried logs, drainage or irrigation pipes, small mounds, furrows, rocks, rabbit holes, etc.), which could have led to a rollover and resulted in their being pinned by the Quad bike as was observed in a large number of fatality cases analysed by the Authors. Although no full loss of control event was recorded with the human test rider obviously for safety reasons, riders as well as the Quad bike itself were displaced substantially laterally similar to what was observed with the crash test dummy tests (see Figure 16 and Attachment 1 Crashlab Report). In addition, and as a result, in the bump tests, the passive crash test dummy can lean away from the Quad bike, pulling on the far-side handle bar, further increasing the Quad bike’s turning rate, leading to potential rollover. All of the SSVs traversed the bump satisfactorily, with a low level of rider or vehicle perturbation. This potential loss of control mechanism as observed in the bump tests is currently being explore by a postgraduate David Hicks as part of his PhD studies. In contrast to the Quad bikes, and based on these tests, SSVs had more ‘forgiving’ handling and higher stability characteristics (i.e. higher resistance to rollover), and are less reliant on operator vehicle handling skills, i.e. the tested SSVs have a higher error tolerant threshold in terms of their handling and stability when operated in a typical farming environment.
9
Part 2: Dynamic Handling Test Results (Report 2)
Observations from the Dynamic Handling Overall Rating Index Results from the Dynamic Handling tests provide sufficient discrimination between vehicles for the range of vehicles tested (Quad bikes and SSVs) to use as a basis for a rating system. The SSVs, except for one model (14 points) all have a higher Dynamic Handling Overall Rating Index with points from 18 to 20, compared with 10 to 12 for the work Quad bikes. One of the recreation Quad bikes has a high rating of 17 points. The maximum possible index value is 25 points. These dynamic tests were also innovative in that they showed that Quad bikes could be subject to scientifically reliable, reproducible, and meaningful Dynamic Handling testing. The tests were also innovative in terms of introducing a bump test to ascertain possible loss of control mechanism leading to rollover. This finding was contrary to claims by some in industry that such testing was not feasible or meaningful. The Authors are strongly of the opinion that history has clearly demonstrated that advances in safety for all types of land mobile vehicles are correlated with improvements in stability, handling and crashworthiness. Indeed, the Authors agree with the latest September 2014 report and proposed rulemaking (CPSC, 2014) by the US Consumer Product Safety Commission (CPSC) regarding improved handling and stability for SSVs (see Section 2.2.1).
10
Part 2: Dynamic Handling Test Results (Report 2)
2. DYNAMIC STABILITY AND HANDLING TEST PROGRAM FOR QUAD BIKES AND SSVs 2.1 Introduction The Quad Bike Performance Project (QBPP) is aimed at improving the safety of Quad bikes, in the workplace and farm environment by critically evaluating, conducting research, and carrying out testing, to identify the engineering and design features required for improved vehicle Static Stability, Dynamic Handling and Rollover Crashworthiness including operator protective devices and accessories. This is being done through the application of a Quad bike and Side by Side Vehicle Star Rating system (ATVAP: Australian Terrain Vehicle Assessment Program) to inform consumers purchasing vehicles for the workplace and farming environment. This is the second major test report for the Project, and follows on from the Static Stability test report. The reader is referred to the Part 1: Static Stability Test Results for the detailed introduction and background to the Project, which is not repeated here. This Report provides the key findings, methodology and analyses from the dynamic stability and handling tests and its significance to the Project and Quad bike and SSV safety. Attachment 1 of this report provides the detailed test methods and results as presented by Crashlab on the extensive dynamic testing undertaken (over 546 tests). The Report is structured as follows: Section 1: Executive Summary Section 2: Dynamic Stability and Handling Test Program for Quad Bikes and SSVs Section 3: Dynamic Stability and Handling Overall Rating Index for the 17 Test Vehicles Section 4: Conclusions Appendix 1: Copy of US CPSC letter to ROVA dated 28th August 2013 Attachment 1:
Crashlab Special Report SR2013/004, Quad Bike Performance Project: Dynamic Vehicle Performance Testing, and Appendices A, B, C, D, E, F. Appendix A – Test specifications Appendix B – Test matrix Appendix C – Result summary tables Appendix D – Instrument response data (Separate attachment as file is very large) Appendix E – Test specimen details Appendix F – Test photographs Appendix G – Instrument details
11
Part 2: Dynamic Handling Test Results (Report 2)
No.
1
2
3
4
5
Model Honda TRX250; Quad bike ($6k)* Honda TRX500FM; Quad bike ($12k) Yamaha YFM450FAP Grizzly Quad bike ($12k) Polaris Sportsman 450HO; Quad bike ($8k) Suzuki Kingquad 400ASI; Quad bike ($9k)
6
Kawasaki KVF300; Quad bike ($6k)
7
Kymco MXU300; Quad bike ($6k)
8
CF Moto; CF500 Quad bike ($6.5k)
No.
Model
9
Can-am DS90X; Sports/ Rec Quad bike (youth) ($5k)
10
Yamaha YFM250R Raptor; Sports/ Rec Quad bike ($8k)
11
Honda TRX700XX; Sports Rec Quad bike ($13k)
12
Yamaha YXR Rhino; SSV ($17k)
13
Kubota RTV500; SSV ($14k)
14
John Deere XUV825i; SSV ($18k)
15
Honda MUV700 Big Red; SSV ($18k)
16
17
Tomcar TM2; SSV ($25k)
Prototype wide track Quad bike
*Approximate bulk purchase cost for the project in Australian dollars, 1k=$1000 (purchased November 2012 including 10% GST). Note: prices will vary depending on where the vehicle is purchased and under what terms.
Figure 1: The 17 test vehicles
12
Part 2: Dynamic Handling Test Results (Report 2)
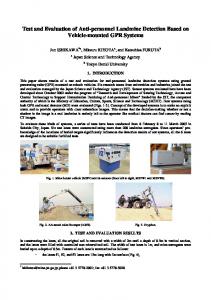
The sixteen production vehicles and the prototype Quad bike selected for testing are set out in Figure 1 comprising eight Quad bikes typically used in the work place, particularly on farms; three sports/ recreational type Quad bikes; and five Side-by-Side style off-road vehicles used in the workplace/farms. Late in the program, a specially modified prototype Quad bike was provided for testing by Dr. David Renfroe. This vehicle incorporated changes to its track width (around 150mm either side compared to the Honda TRX700XX), an open and lockable rear differential and modified suspension design (independent suspension and tuned shock absorber for spring and damping) aimed at significantly improving stability and dynamic handling. The vehicle is still a prototype and for that reason its identity is not revealed in this report. However, the intention of testing this vehicle was to demonstrate that the rollover resistance and dynamic handling of Quad bikes can be significantly improved for the work environment. Two Operator Protection Devices (OPDs) were included in the test series to determine their effect on dynamic handling (see Figure 2). Each of the OPDs was fitted to one of the Quad Quadbar
Lifeguard
QB Industries
Ag TECH industries
8.5kg
14.8kg
Figure 2: The CPD/ OPD units used in the dynamic tests with the ‘work’ Quad bike. Top frames: on Tilt Table. Bottom frames: with outrigger wheels.
13
Part 2: Dynamic Handling Test Results (Report 2)
bikes (Honda TRX250). This Quad bike was selected to represent a typical median result with respect to rollover resistance. The vehicle was also out fitted with outrigger wheels to ensure riders were safe during these tests.
2.2 The Dynamic tests 2.2.1 Introduction Analysis of the control of any system by a human requires an understanding of the human ability to perceive, process, and react to events encountered by the vehicle as it follows the path desired by the driver or rider. This includes the ability of the system dynamic characteristics to receive a control input and respond in a stable manner and provide feedback to the human controller who can then evaluate the response and make adjustments to maintain a desired path. A block diagram (Figure 3) describing such an operator/vehicle system is shown below (McRuer et al., 1975). The McRuer et al. study set out to determine how the response of a vehicle to a driver’s steering input affects the driver’s ability to maintain precise control over vehicle path. He stated in his opening paragraph of his report, “With this knowledge we can identify those vehicle steering response characteristics which may lead to imprecise vehicle path control and which may, in turn, lead to accidents.” Since the McRuer et al. 1975 study there have been many attempts made to quantify human control of a vehicle, especially for the purpose of modelling. (Lee et al., 2010; Jurgensohn, 2007; Weir and Di Marco, 1978; Weir et al., 1977; McRuer et al, 1977 and McRuer, 1980, and MacAdam, 2003). As is typical, these studies quote heavily from McRuer but do not change the fundamental parameters or requirements he identified for effective vehicle control. Moreover, they build on his study for the purpose of defining characteristics of a computer model or the functionality of driver assist technology.
Figure 3: Block Diagram of Driver/Vehicle System for Lateral Steering Control and Regulation (McRuer et al., 1975)
14
Part 2: Dynamic Handling Test Results (Report 2)
All of the studies referred to above have shown that control of any machine by a human requires that the vehicle responds quickly to a control input. The human controller then recognises the effect of the control input through visual or tactile perceptions, analyses the response and determines any error with respect to the desired effect, then adjusts the control input to correct for any error in the response. There is a finite time in which this can occur, beyond which the operator inputs additional control demands, to speed up the required response. This situation can lead to an exponentially degrading or oscillatory pattern resulting in a loss of control. Control implies the machine must respond the same way to a given control input, respond in a timely manner, and not change the response over time when the inputs are held constant. For dynamic systems such as vehicles, the response time must be short enough to allow the controller to adjust the control inputs to safely manage a vehicle at speed along a desired path. When the vehicle or machine ceases to respond or is random in its response then that vehicle is “out of control.” Research regarding dissimilar vehicles as a starting point for understanding and improving vehicle control is not a new or novel endeavour. A 1956 study drew on the work concerning the stability of aircraft and ships to understand and improve the handling of road vehicles (Segal, 1956). Milliken et al. (2002) also relied on aircraft studies to improve the handling and longitudinal stability of the modern automobile (Milliken, 2004; Milliken and Milliken, 1995)). Similarly, the automobile/operator interface has been used in the study of the handling of Quad bikes. Indeed, in the SAE Technical Paper "An Introduction to the Operational Characteristics of All-Terrain Vehicles", authors Weir and Zellner (1986) argue: "Handling qualities include, in general, controllability which in turn involves ease of control, the ability to follow a desired path or make the desired manoeuvre, and the ability to suppress disturbance inputs, whether they arise from the environment or from within the system itself." The use of internationally accepted tests that determine handling characteristics for road vehicles can, with some assumptions and extensions, be adapted to Quad bikes and SSVs. Simply put, they are four wheeled, powered vehicles being directly controlled by a human operator and the tests apply to any such vehicle, regardless of its specific design or purpose (allowing for differences in vehicles). A review of National Coroner’s Information System (NCIS) data and a subsequent detailed review of Coroner’s case reports for Quad bike deaths in Australia by McIntosh and Patton (2014) identified rollover as the most significant fatal crash causes. The rollover typically occurred as a loss of control situation where the vehicle was travelling on firm ground, including unsealed roads and dry paddocks, and/ or after striking a bump obstacle. With this in mind, it was decided by the Quad Bike Performance Project team to focus attention on those riding and handling characteristics that can potentially cause loss of control described under these key circumstances. There are two control characteristics that the Authors consider can be used to determine if a vehicle is controllable; the understeer/oversteer characteristic (Segal, 1956) and the
15
Part 2: Dynamic Handling Test Results (Report 2)
steering response time (McRuer et al., 1975). It is important to note that while subsequent research has refined the specific parameters and requirements of human responses, the fundamentals of vehicle dynamic handling, just like the laws of physics, have not changed since these seminal studies were first published. A vehicle that has poor handling characteristics will be unwieldy and/or will be slow to respond to operator inputs. Another concern is that the suspension system response to a bump or single obstacle impact can cause the rider to be partially displaced from the saddle, resulting in them falling off (to impact the ground or another hazard) or a rollover crash occurring. There are distinct relationships between the fundamental control characteristics of vehicles and the occurrence and consequence of certain de-stabilising or excitation events. Vehicles with an excessive understeer or oversteer characteristic are difficult to manoeuvre at low speeds and at higher speeds can require control inputs that are counter-intuitive. In emergency situations this can lead to the compounding of problems, which can result in a loss of control crash. The industry (through FCAI) claim that there is currently no incident statistical data available or collected to enable determining the correlation (if any) between a vehicle’s handling characteristics and collision and injury risk. The Authors strongly disagree with this proposition providing two examples why their opinions (along with other safety stakeholder’s opinions) differ from manufacturer’s representatives. The first example is presented in the United States of America (USA) Consumer Product Safety Commission (CPSC) most recent September 2014 report (CPSC, 2014) proposing a Safety Standard for Recreational Off-Highway Vehicles (ROVs)4, Notice of Proposed Rulemaking, 16 CFR Part 1422. CPSC staff reviewed incidents reported to them involving the Yamaha Rhino model vehicles between January 2003 and May 2013, to address stability and handling issues with the vehicles. Figure 4 is reproduced from that report’s Figure 1 showing the number of incidents reported. A repair program was initiated by the CPSC after negotiations with Yamaha in March 2009:
4
Recreational Off-Highway Vehicle (ROV) is the USA’s term for a Side by Side Vehicle. ATV is the term used in the USA for a Quad bike. Extract from US CPSC (2014): “ROVs are motorized vehicles designed for off-highway use with the following features: four or more pneumatic tires designed for off-highway use; bench or bucket seats for two or more occupants; automotive-type controls for steering, throttle, and braking; and a maximum vehicle speed greater than 30 miles per hour (mph). ROVs are also equipped with rollover protective 4 structures (ROPS), seat belts, and other restraints (such as doors, nets, and shoulder barriers) for the protection of occupants. … ROVs differ significantly from ATVs in vehicle design. ROVs have a steering wheel instead of a handle bar for steering; foot pedals instead of hand levers for throttle and brake control; and bench or bucket seats rather than straddle seating for the occupant(s). Most importantly, ROVs only require steering wheel input from the driver to steer the vehicle, and the motion of the occupants has little or no effect on vehicle control or stability. In contrast, ATVs require riders to steer with their hands and to maneuver their body front to back and side to side to augment the ATV’s pitch and lateral stability. … The seats on ATVs are intended to be straddled, unlike the bucket or bench seats on ROVs.”
16
Part 2: Dynamic Handling Test Results (Report 2)
“In March 2009, CPSC staff negotiated a repair program on the Yamaha Rhino 450, 660, and 700 model ROVs to address stability and handling issues with the vehicles. CPSC staff investigated more than 50 incidents, including 46 driver and passenger deaths related to the Yamaha Rhino. The manufacturer voluntarily agreed to design changes through a repair program that would increase the vehicle’s lateral stability and change the vehicle’s handling characteristic from oversteer to understeer. The repair consisted of the following: (1) addition of 50-mm spacers on the vehicle’s rear wheels to increase the track width, and (2) the removal of the rear stabilizer bar to effect understeer characteristics.” The CPSC’s (2014) Figure 1 shows the decrease in Rhino-related reported incidents after the repair program were due to handling improvements, “Specifically, correction of oversteer and improved lateral stability can reduce rollover incidents …..”. An extract of the narrative from that report related to the Rhino-related incidents is as follows: “CPSC staff also analyzed the 242 Yamaha Rhino-related incidents reported to CPSC and identified 46 incidents in which a Yamaha Rhino vehicle rolled over during a turn on flat or gentle terrain. Staff identified forty-one of the 46 incidents as involving an unrepaired Rhino vehicle. In comparison, staff identified only two of the 46 incidents in which a repaired Rhino vehicle rolled during a turn, and each of these incidents occurred on terrain with a 5 to 10 degree slope. Among these 41 reported incidents, there were no incidents involving repaired Rhinos rolling over on flat terrain during a turn.
Figure 4: Extracted Figure 1 from US CPSC’s (2014) most recent ‘Notice of Proposed Rulemaking’ for a ‘Safety Standard for Recreational Off-Highway Vehicles (ROVs)’ showing the number of reported Yamaha Rhino Incidents from January 2003 to May 2012.
17
Part 2: Dynamic Handling Test Results (Report 2)
The Commission believes the decrease in Rhino-related incidents after the repair program was initiated can be attributed to the vehicle modifications made by the repair program. Specifically, correction of oversteer and improved lateral stability can reduce rollover incidents by reducing the risk of sudden and unexpected increases in lateral acceleration during a turn, and increasing the amount of force required to roll the vehicle over. CPSC believes that lateral stability and vehicle handling have the most effect on rollovers during a turn on level terrain because the rollover is caused primarily by lateral acceleration generated by friction during the turn. Staff’s review of rollover incidents during a turn on level ground indicates that repaired Rhino vehicles are less likely than unrepaired vehicles to roll over. CPSC believes this is further evidence that increasing lateral stability and correcting oversteer to understeer contributed to the decrease in Yamaha Rhino incidents.” In addition the CPSC highlights “the Commission believes that improving lateral stability (by increasing rollover resistance) and improving vehicle handling (by correcting oversteer to understeer) are the most effective approaches to reducing the occurrence of ROV rollover incidents”, as follows: “V. Overview of Proposed Requirements Based on incident data, vehicle testing, and experience with the Yamaha Rhino repair program, the Commission believes that improving lateral stability (by increasing rollover resistance) and improving vehicle handling (by correcting oversteer to understeer) are the most effective approaches to reducing the occurrence of ROV rollover incidents. ROVs with higher lateral stability are less likely to roll over because more lateral force is necessary to cause rollover than an ROV with lower lateral stability. ROVs exhibiting understeer during a turn are less likely to rollover because steering control is stable and the potential for the driver to lose control is low.” The second example relates to the correlations that have been established for Static Stability Factor and risk of a rollover for a diverse range of other vehicle types such passenger cars, SUVs, pickups, four wheel drives and heavy trucks, e.g. Mengert (1989) and DIER 2006. This is discussed in more detail in Section 3.3.2 in the Part 1: Static Stability Test Results and Rating of 17 Quad Bikes and Side By Side Vehicles (SSVs) report. It is obvious from the graphs presented in that Part 1 report (Figures 2 and 3) that the higher the vehicle’s lateral stability is, the less likely the vehicle will roll over because more lateral force is necessary to cause rollover than a vehicle with lower lateral stability, i.e. it has a higher resistance to rollover. The US CPSC (2014) latest report also states: “The Commission believes that when rollovers do occur, improving occupant protection performance (by increasing seat belt use) will mitigate injury severity. CPSC’s analysis of ROV 4 incidents indicates that 91 percent of fatally ejected victims were not wearing a seat belt at the time of the incident. Increasing seat belt use, in conjunction with better shoulder retention performance, will significantly reduce injuries and deaths associated with an ROV rollover event. To address these hazards, the Commission is proposing requirements for:
18
Part 2: Dynamic Handling Test Results (Report 2)
•
A minimum level of rollover resistance of the ROV when tested using the J-turn test procedure;
•
A hang tag providing information about the vehicle’s rollover resistance on a progressive scale;
•
Understeer performance of the ROV when tested using the constant radius test procedure;
•
Limited maximum speed of the ROV when tested with occupied front seat belts unbuckled; and
•
A minimum level of passive shoulder protection when using a probe test.”
Hence, we the Authors are strongly of the opinion that history has clearly demonstrated that advances in safety for all types of land mobile vehicles are correlated with improvements in stability, handling and crashworthiness. There is no reason why Quad bikes and SSVs should be any different and not obey the same laws of physics and vehicle dynamics. Thus, it was decided by the Quad Bike Performance Project research team that the understeer/oversteer gradient tests and steering response time (step steer) tests would be conducted generally in accordance with the ISO standard tests.5 Specific protocols were developed for these tests that take into account the unique characteristics of the Quad bike and SSVs. Understeer is a measure of a handling characteristic of the vehicle independent of the driver. It can be measured using a circle test as described in SAE J266 (ISO 4138:2012). In simple terms, when the amount of slip angle occurring at the front tyres exceeds that at the rear, then the vehicle is understeering. In these circumstances, more steering input is required to remain on a constant circle path as speed increases. If the amount of slip angle at the rear exceeds that at the front, then the vehicle is oversteering. The driver will have to continually reduce the steering input to remain on the intended path as speed increases. If the amount of slip angle at the front is equal to that at the rear, then the vehicle is said to
5
Note that the J-turn test quoted by the in their September 2014 report (CPSC, 2014) is sometimes referred to as the step steer test. It is, in effect, the same procedure as the Lateral Transient Response Test (ISO 7401) that the Authors based their step steer test on. The step steer test was used to determine the Quad bike’s and SSV’s vehicle response time, measured as the time from the application of a steering input until the vehicle established a constant yaw rate for the desired steer angle, wheel base, and vehicle speed. For the reasons specified later in this report, the Authors decided to use the steady-state circular driving behaviour test based on SAE J266 (ISO 4138:2012) to determine the Quad bike’s and SSV’s understeer/ oversteer characteristics. Moreover, the decision to use the steady-state circular driving behaviour test instead of the step steer test (J-turn) was made mainly for occupational health and safety reasons, and also (it should be noted) that this decision was made in 2013 well prior to the September 2014 release of the US CPSC’s (2014) proposed rulemaking for a Safety Standard for Recreational Off-Highway Vehicles (ROVs). Both test procedures are valid in terms of determining a vehicle’s understeer/ oversteer characteristics. Depending on whether the CPSC September 2014 is made law in the USA, the CPSC proposed J-turn Dynamic Handling test procedure could be used for future ATVAP rating procedures.
19
Part 2: Dynamic Handling Test Results (Report 2)
be neutral steer, which means regardless of speed, the driver would not have to vary the steering input to remain on the intended path. These variations in steering response as speed changes are represented diagrammatically in Figure 5, where K is the understeer gradient. If K is negative, then the vehicle has an oversteer characteristic. To measure the characteristic understeer or oversteer, a vehicle is driven on a circle laid out on a flat surface of consistent coefficient of friction while gradually increasing speed. While driving around the circle, the steering angle and lateral acceleration are measured. The plot shown in Figure 6 shows the steering angle versus the lateral acceleration for a typical (well behaving) understeer vehicle. The focus of the Quad Bike Performance Project is to encourage those dynamic characteristics that provide predictable and forgiving handling characteristics while remaining responsive and highly mobile in a farming and workplace environment. Moreover, in order to provide predictable and forgiving handling characteristics while remaining responsive and highly mobile, a vehicle should be designed to provide a light understeer response of between 1 to 2 degrees per g lateral acceleration. In light off-road vehicles, this understeer characteristic should continue to at least 0.5g lateral acceleration. In addition, there are other suspension performance requirements required to meet the vehicle mobility demands that must be satisfied and the necessary mechanical compromises for this may require the steering response to transition to neutral or even an oversteer response at greater lateral accelerations. This same safety requirement is also highlighted in a letter from the US CPSC to the Recreational Off-Highway Vehicles Association (ROHVA) of 28 August 2013, which requested the ANSI/ROHVA 1 Standard be revised to include a requirement for an understeer gradient that is positive (light understeer) from lateral accelerations ranging from 0.1 to 0.5g. A copy of the CPSC letter is attached in Appendix 1. Hence on the basis of the above introduction, it was decided that the test program should consist of three different dynamic test series, namely, steady state circular driving behaviour tests, step steer response tests and bump obstacle perturbation tests.6 The circular tests were to provide information on the vehicle’s limit of lateral acceleration and whether it had an understeer, oversteer or neutral steering characteristic, and the point of transition between them, if it transitioned from one characteristic to another. The step steer response tests provided information on the vehicle lateral transient response time. The perturbation bump tests provided information on pitch and yaw response and how much the perturbation disturbs and displaces the rider from their riding position.
6
For details refer to the Crashlab Special Report SR2013/004, Quad Bike Performance Project: Dynamic Vehicle Performance Testing, Attachment 1.
20
Part 2: Dynamic Handling Test Results (Report 2)
21
Direction of travel
Figure 5: Curve response of neutral, under and oversteer at fixed steer angle
Figure 6: Understeer characteristic for a vehicle with good handling properties. The steady state circular driving behaviour tests and lateral transient response tests were conducted at Sydney Dragway, Eastern Creek, NSW on both asphalt and grass surfaces. The bump obstacle perturbation tests were conducted on an asphalt surface at Crashlab, Huntingwood, NSW, Australia. For all vehicles that were tested on the asphalt surface, the surface was flat, smooth and level, with an average coefficient of friction of 0.76. A number of vehicles were also tested on a mowed grass surface at Eastern Creek and on loose bluemetal over compacted roadbase at Crashlab, for comparison of handling response. A number of vehicles were also tested with the maximum recommended cargo load applied to each of the designated cargo
Part 2: Dynamic Handling Test Results (Report 2)
areas for the steady state circular driving behaviour tests and lateral transient response tests, for comparison purposes. The basis of each of these test series and methodology is outlined as follows: 2.2.2 Steady-state circular driving tests The steady-state circular driving behaviour test consisted of slowly accelerating the vehicle from rest whilst tracking around a circle of 7.6m radius (see Figure 7). The vehicle was accelerated until it lifted the two inside tyres off the ground and tipped up, or could no longer stay on the circle, or the rear of the vehicle slid out which caused the vehicle to point towards the inside of the circle, or could not travel any faster. As mentioned earlier, the tests used for the Quad bike and SSV handling assessments were developed based on SAE J266 (ISO 4138:2012) tests. The circle radius of 7.6 metres (25 feet) was chosen for several reasons. Firstly, it produced lateral accelerations near the vehicle limit (rollover threshold) at speeds at or below 25 km/h. This was considered important because although outrigger devices were fitted to the vehicle to resist rollover (Figure 2 and Figure 7), a crash at these speeds though considered highly unlikely, would have a low injury risk for the test rider should one occur. These relatively low test speeds also represent the circumstance of a farmer or worker who is riding while undertaking their primary task (such as herding animals, inspecting fence lines, spraying weeds, etc.) in a neutral non-Active Riding position (worst case scenario). While a wide variety of test speeds and steering inputs are possible, this sample speed is representative of the circumstances for at least a large portion of fatal and serious injury Quad bike crashes that have occurred in the workplace in Australia (McIntosh and Patton, 2014; Lower et al., 2012). The other main reason is that a radius of 7.6 metres is used by the United States (US) ANSI/ROHVA 1-2011 Standard for Recreational Off-Highway Vehicle testing and would remove the need to have different test tracks for the different test protocols. Following the prescribed circle, the rider steadily increases the speed and data is recorded continuously for as long as the vehicle remains on the desired circular path within ± 0.2m. The maximum rate of increase of lateral acceleration was approximately to 0.1m/sec²/sec, making each test about 3 mins duration. While other test methods are available within the ISO protocol, this method could be conducted in a relatively small area, produced the least crash risk for the test rider, and the results were able to be transferred directly to response graphs. Tests were conducted in both left and right hand circle directions and repeated at least 3 times in each direction. The Steady State Circular Driving protocols are provided in Appendix A of the Crashlab Report (Attachment 1). For the steady state circular driving behaviour tests and lateral transient response tests the vehicles were fitted with an AiM EVO4 data acquisition unit which was mounted close to the vehicle’s centre of gravity. This data acquisition system has an internal tri-axial accelerometer and was configured to record external instruments measuring yaw rate,
22
Part 2: Dynamic Handling Test Results (Report 2)
steering angle, vehicle velocity via GPS and vertical distance to ground on the vehicle’s left and right side. The acquisition rate was 100Hz. The vehicles were also fitted with an underbody camera to record the point of wheel lift on the steady state circular driving behaviour tests. Hence, for example, lateral acceleration was continuously recorded at 100 Hz along with synchronised video recording such that at the point where both wheels were observed to lift off the ground, the lateral acceleration at that point could be determined. Details concerning the test instrumentation are also presented in the Crashlab Report (Attachment 1). In terms of the oversteer/understeer response all charts in this project have been standardised so that oversteer is shown as a negative gradient and understeer is represented by a positive gradient. This variation to sign convention was done to make the results easier to interpret. An example plot for the Polaris Sportman 450HO is shown in Figure 8. Each dot on the graph represents a data point taken at 100Hz then filtered during post-processing using a 10 step moving average filter. The test results shown graphed as red points in Figure 8 were used to determine a line of best fit using a 2nd order polynomial, to determine the understeer/oversteer gradient. The detailed curve fits for understeer/oversteer parameters are shown in Appendix D of the Crashlab Report SR2013/004 for the 240 tests7. The results of the steering characteristic testing for every vehicle were very closely grouped, demonstrating good repeatability of the test procedure. In every case but one, the understeer gradients derived from the graphed results of three separate test runs varied by less than 0.5 deg/g, typically 0.25 deg/g or less. Scatter is caused by the vibrations from the engine and knobby tyres, including the tyre pulsing effect identified by Renfroe (1996). In addition, the 'stab-steer' method required to follow the circle introduces a step like separation of otherwise continuous results. The test team observed that as the rear wheel lifts and breaks traction on the dry bitumen and dry grass surfaces used, the plow effect on such surfaces is suddenly relieved, which demands a steering correction requirement to remain on path. This then causes the lateral acceleration to reduce and the inside wheel to re-engage the ground and repeated oscillation occurs until at higher lateral accelerations, the inside rear wheel is suspended permanently in the air and the Quad settles down to more stable path following. While Quad bike industry representatives8 argue that Quad bikes and SSVs are not specifically designed to be operated on paved surfaces (this is a manufacturer ‘warned against’ behaviour). The fact remains that they are being used on hard surfaces from time to time and loss of control crashes on those hard surfaces are occurring in Australia and
7
The ‘line of best fit’ methodology is detailed in the Crashlab Report SR2013/004, Appendix A (Attachment 1).
8
This includes both manufacturers and distributors of Quad bikes and SSVs. For convenience in this report, where it is noted the Quad bike industry this includes manufacturers and distributors of both Quad bikes and SSVs.
23
Part 2: Dynamic Handling Test Results (Report 2)
Figure 7: Steady state circle testing on asphalt and on grass. Top left: Rider on Quad bike following circle. Top right: Rider on Quad bike following grass circle at point of tilt. 2nd row: Grass circle test site 3rd row: Typical Quad bike circular driving behaviour test (G130449) – both wheels lifted. Bottom: Yamaha Rhino SSV with outrigger wheels.
24
Part 2: Dynamic Handling Test Results (Report 2)
Figure 8: Understeer/oversteer graph for the Polaris Sportsman 450HO showing characteristic understeer (1.754 degrees per g) transitioning at 0.15g to oversteer behaviour of around -8.971 degrees per g between 0.15g and 0.4g lateral acceleration. elsewhere (including the US (Denning et al., 2013), Canada and Sweden). The project demonstrated that the vehicle characteristics identified by the handling test results are not surface dependent, within certain limits. Alternate testing was conducted on various surfaces including asphalt, loose bluemetal over compacted roadbase, and on grass. It was acknowledged by the Authors and the test team that there will be a variation in handling response if operating the vehicle on a plastic (i.e., yielding) surface, such as course sand or thick mud, where the surface grip at the tread face is relatively low causing increased slip and early saturation, but sideways movement is opposed by material that will build up against the outside of the tyres, both reducing the amount of slip and increasing rolling resistance. This was not considered to be a critical issue, since on those surfaces a rider will normally adapt their riding style and limit their top speeds to suit the riding circumstances. Firmer and smoother surfaces however, encourage higher speeds, since the rider experiences smooth running and has no expectation of needing to undertake an emergency manoeuvre or critical steering response. Similarly, there was concern that the test would be rider dependant in terms of mass variation. To address this issue, the vehicle was ballasted to a standard load, described as 'rider only'. The total standard load was the sum of the mass of the rider with his/ her safety clothing and equipment, outriggers and data acquisition equipment, along with any necessary ballast, i.e. a total of 103kgs ± 0.5kgs. This represented the mass of the 95th %ile Anthropomorphic Test Device (ATD) used for the Static Stability testing program.
25
Part 2: Dynamic Handling Test Results (Report 2)
Additionally, a standardised rider position was established, termed the ‘seat reference point’ (see Figure 9). This point was defined as when the 95th %ile ATD is fitted to the Quad bike and the hands are fixed to the handgrips. The pelvis was then centred on the saddle and shifted forward or aft until the spine box was vertical (±0.5 deg). A mark was placed on the saddle directly below the vee formed in the skin of the pelvis, below the instrument cavity. This seat reference point allowed the ATD to be quickly returned to the set up position during stability testing and similarly allowed the test riders to quickly adopt a standardised seating position by sitting their own buttocks on the saddle, with their coccyx positioned at the seat reference point. For most tests, a neutral riding style was adopted, which is to say no ‘Active Riding’ involving hip or torso shift or standing was undertaken. This was deliberate and represents a worst case scenario, i.e. the situation where a rider who is not concentrating, or is distracted from the riding task for some reason, or is tired after a hard day’s work or riding, is suddenly required to make an emergency manoeuvre. The test rider was permitted to lean his upper body into the circle slightly, to counter the lateral acceleration they were subjected to, but was required to generally maintain head, neck and spine alignment. Standardised rider mass and positioning back to back sample testing with different riders (see Figure 10) on the same machine (Kawasaki KVF300 Quad bike) on the same test
Figure 9: Use of the seat reference position to ensure the rider was sitting in the correct position on the saddle prior to each test run
26
Part 2: Dynamic Handling Test Results (Report 2)
surfaces were also carried out. Twelve (12) Dynamic Handling tests were used to assess repeatability, i.e. six circular and six step steer tests were repeated with an alternative rider. The results are presented in Tables 2 and 3 of Crashlab Report SR2013/004 (Attachment 1). Another test series was run to evaluate the effect of different riding positions. This was not a complete assessment of Active Riding style, where the movement of the body at the most appropriate time provides a transient or dynamic benefit to vehicle stability beyond the simple variation to static stability. It was a simplified series of tests to assess the effects of the rider leaning well forward, fully rearward and leaning into the circle as far as possible (Figure 11 and Figure 12).
Figure 10: Different riders undertaking back to back testing. Results obtained (Attachment 1) show the vehicle characteristic is not rider dependant.
Figure 11: (left frame) Rider sitting at the seat reference point; (right frame) body shifted inward, forward and torso leaning into the turn. Rider weight is transferred forward and also to the inside footrest by this movement. Rollover resistance is thus improved by this.
27
Part 2: Dynamic Handling Test Results (Report 2)
Figure 12: Showing riding position fully forward (left frame) and fully rearward (right frame).
2.2.3 Lateral transient response tests The lateral transient response test consisted of driving the vehicle in a straight line at a velocity of 20 km/h and then rapidly inputting a steering response to generate a lateral acceleration of 0.4g. The yaw rate to steering response time was recorded during the test. Figure 13 shows the rider approaching the circle (top left frame) and when reaching the line inputs a steering response (top right frame) and continues to ride in a circle at a lateral acceleration of 0.4g (bottom frames). Vehicle response time is the measure of the time from the application of a steering input until the vehicle establishes a constant yaw rate for that desired steer angle, wheel base, and vehicle speed. Weir and Di Marco (1978), identified the importance of response time as part of proper vehicle steering control.
Figure 13: Showing conduct of Lateral Transient Response (Step Steer) Test
28
Part 2: Dynamic Handling Test Results (Report 2)
"For proper vehicle control via steering of the wheels, front or rear, there are two steering parameters that affect this control, the steering response time and the steering gain. For automobiles, the two parameters (gain and time constant) used in most of the correlation plots effectively describe the key handling properties…" A standard test for this response time is the Lateral Transient Response Test (ISO 7401). This test is more often referred to as the step steer or J turn test. The intent is to have a near instantaneous steering change to produce a given steer angle and hold that angle and measure the yaw rate of the vehicle while maintaining its speed. Knowing that the steer control takes a finite amount of time, the response time is measured from when the steer angle is at 50% of the desired step steer angle to the time when the yaw rate reaches 90% of the steady state yaw rate. Weir and Di Marco (1978) found that there is an upper limit to a steering response time above which control of a vehicle is difficult. "There is also an upper limit on the effective time constant (Te), beyond which the vehicle’s directional response is not rapid enough." That upper acceptable limit for steering response time for passenger car control in lane regulation and lane change manoeuvers on paved roadways at 50 mph (80 km/h) was found by Weir and Di Marco (1978) to be between 0.25 and 0.30 seconds depending on the vehicle steering gain. The Authors adopted a response time of 0.25 to 0.5 seconds as an appropriate response time for both the Quad bikes and SSV assessments. The lateral transient response characteristic testing procedure was modelled on ISO 7401:2011; Road Vehicles - Lateral transient response test methods - Open-loop test methods, and has been modified to suit the physical and dynamic characteristics of Quad bikes and SSVs. A copy of the Lateral Transient Response test protocols are provided in Appendix A of the Crashlab Report (Attachment 1). In this test, the vehicle was driven in a straight line at 20 km/h (±1 km/h) and then a steering input was introduced as rapidly as possible to a preselected value and maintained for several seconds after the vehicle motion variables had attained a steady state. The speed was maintained at a constant 20 km/h (±1 km/h) while turning, which required a small throttle increase as the turn was introduced. Throttle and steering stop devices were used to aid the rider select and maintain the required throttle position and steering input. The target time between 15% and 90% of the steering input was not to exceed 0.15 secs (see Figure 14). The test speed of 20 km/h was again chosen as it was low enough that had something gone wrong in the test, the rider would not be seriously injured and yet the speed provided sufficient demand on the vehicle steering system to establish what the transient response is. In addition, the test was conducted by maintaining vehicle speed. The test can be conducted with constant throttle, constant speed or dropped throttle. Constant throttle resulted in variable lateral accelerations that made it difficult to determine the vehicle
29
Part 2: Dynamic Handling Test Results (Report 2)
Figure 14: Lateral Transient Response Curve for asphalt testing. This test shows the vehicle had achieved 90% of the steady state steering response for the steering input demanded within 0.12 seconds, which is considered a good response time. response. Dropped throttle on a vehicle with relatively low mass and high engine retardation made the test invalid, as the vehicle would simply come to a halt with the additional load of cornering. The Lateral Acceleration demanded of the vehicle (in steady state turning) was 0.4g9, at the test speed of 20 km/h. The steering input required to describe a circle to produce this value was calculated using the Lateral Acceleration formula: 𝒗𝟐 𝑨𝒚 = 𝟗. 𝟖𝟏 × 𝒓 where: 𝑨𝒚 is Lateral Acceleration, in gravities; 𝒓 is the turn radius in metres; and 𝒗 is the velocity, in metres per second. The Ackerman Steering Angle for the desired lateral acceleration can be determined from the formula: 𝑤ℎ𝑒𝑒𝑙𝑏𝑎𝑠𝑒 𝐴𝑐𝑘𝑒𝑟𝑚𝑎𝑛 𝑆𝑡𝑒𝑒𝑟𝑖𝑛𝑔 𝐴𝑛𝑔𝑙𝑒 = 𝑎𝑟𝑐𝑡𝑎𝑛 ( ) 𝑟𝑎𝑑𝑖𝑢𝑠 Theoretically, the steering input can be pre-set using this equation, where the Ackerman Steering Angle is taken as the average of the steering angles of the left and right wheels.
9
0.4g is the lateral acceleration required by ISO 7401:2011; Road Vehicles - Lateral transient response test methods - Open-loop test methods.
30
Part 2: Dynamic Handling Test Results (Report 2)
The procedure specified in American National Standard ANSI/ROHVA 1- 2011 Section 8.3.4 Test Procedures, (with minor modification) can be used to determine the wheel angles required. Because the Quad bikes and SSVs have significant compliance within the steering system and the low pressure tyres and also due to the plow effect caused by the fixed rear axle, it was not possible to achieve the required lateral acceleration at steady state based on a calculated angle. Hence, iterative test measurement was required to establish the appropriate steering angle to achieve the required lateral acceleration at 20 km/h. Data was noted for the desired steering inputs and response variable outputs and the test was repeated at least three times in each direction. Similar to the circle testing, the rider was required to keep his buttocks positioned at the ‘seat reference point’ on the saddle throughout the tests and only lean their upper body into the turn, to counter the lateral acceleration being generated. Head and neck were to remain in general alignment with the upper body. 2.2.4 Bump obstacle perturbation tests The Bump obstacle perturbation test consisted of towing the vehicle in a straight line towards a 150mm high semi-circular ‘bump’ object lined up with either the right or left vehicle track. Each vehicle ‘free-wheeled’ over the obstacle without being under the effect of the tow system. An ATD was positioned on the vehicle with the pelvis acceleration recorded. As stated previously, the dynamic handling characteristics of a vehicle form a very important part of vehicle’s active safety, especially so for a vehicle that offers little or no crash protection, making crash avoidance ever more important. Pitch and yaw response to a bump is a function of the suspension geometry and spring and shock absorber design. A part of the suspension, or the ride stiffness of the vehicle, includes the properties of the tyre. Due to the low pressure used in Quad bikes and SSVs, the tyre acts like a lightly damped spring. The overall suspension system will have a major effect on the handling of the vehicle when encountering a bump. Figure 15 shows how the tyre deforms when travelling over a perturbation. Analysis of the National Coroner’s Information System data (McIntosh and Patton, 2014) indicated there were a number of crashes that resulted from a perturbation caused by the rider striking an obstacle. In addition, a bump obstacle test using a matrix of speeds and heights was recommended by the Industry members of the project steering group in their position paper of 1 October 2013 (FCAI, 2013). The Quad Bike Performance Project team decided to investigate this phenomenon in more detail. Initial testing was conducted using ‘koppers logs’10 as the obstacle. These were engaged at speeds of 10, 15, 20 and 25 km/h by riders who were trying to remain in a neutral or inert
10
Koppers logs are a commercially available treated pine log with a nominal diameter of 125 mm.
31
Part 2: Dynamic Handling Test Results (Report 2)
riding position on the seat (i.e., not Active Riding)11. Very early in testing the research team recognised that striking a bump obstacle was a high risk event. Some of the sample Quad bikes did well to attenuate the bump and the rider was able to ride straight over without significant perturbation or crash risk. Some impacts, however, caused a significant vertical and lateral displacement of the rider, so much so that the rider’s bottom was displaced sideways to end up more than 50% off the saddle on some occasions (Figure 16). The sequence of events that followed from this displacement of a seated rider were that being half off the saddle, the rider's body tended to fall on the outboard side, rotating about the rider’s buttocks still in contact with the seat. Because the rider’s legs were not positioned or prepared to take their body’s load and resist this rolling motion, the rider could only pull on the opposite handgrip to try to reposition themselves, or to try to remain in contact with and stay on the Quad bike. This caused the vehicle to be steered away from the side that the rider was already leaning outboard on (see Figure 16).
Figure 15: Negotiating a 100mm bump obstacle at 25 km/h (ballasted to 103 kg load). The low pressure tyre bottoms out, as has the suspension travel, forcing the Quad bike and rider to rise up over the obstacle. This creates vertical and lateral accelerations for the rider that can be measured by the test protocol.
11
Note that industry based training courses and owner’s manuals recommend standing up with the rider’s knees flexed while riding the machine over obstacles similar to that shown in Figure 15. By standing, balancing and centering over the vehicle seat can be maintained. Riding over an obstacle while seated on an Active Riding vehicle such as a Quad bike is a warned against behavior by industry; and in that sense, the bump tests in this project serves to verify why it is a warned against behaviour. However, this requirement by industry further demonstrates the vulnerability of particular Quad bikes to such perturbations in terrain becoming unstable and rolling over. Moreover, from a human factors and ergonomics perspective, to require a rider to be continuously vigilant for such obstacles is an unrealistic expectation and unsafe requirement. Rather than designing a vehicle that is human error tolerant, and can traverse terrain with moderate obstacles without requiring Active Riding, the manufactures instead appear to simply accuse the rider of performing warned against behavior and thus absolve themselves of the need to improve vehicle design. Hence, the introduction of such a test to highlight the vehicle’s low rider ‘warned against behaviour’ tolerance.
32
Part 2: Dynamic Handling Test Results (Report 2)
What is interesting to note is that there appears to be a dominance of left side rollover compared to right side rollover for workplace fatalities (McIntosh and Patton, 2014). It is speculated by the research team that having the thumb throttle on the right handle bar may be resulting in the rider inadvertently over accelerating the Quad bike during a rollover bump event as depicted in Figure 16. That is, when the rider attempts to pull themselves back onto the straddle seat to regain control of the Quad bike, particularly when they use their right hand, they may be inadvertently pressing the thumb accelerator and thus further exacerbating the rollover mechanism. It was obvious to the Quad Bike Performance Project research team that the consequence of steering away from the side the rider is leaning out meant that either the rider must let go and fall to the ground (with a risk of striking hard and dangerous objects with their head or receiving serious neck injuries) or to hold on, which would in turn cause the Quad bike to roll over, i.e. the rider would effectively pull the vehicle over on top of them. It should be noted again that industry recommends Active Riding when negotiating such obstacles. However, in many terrains such obstacles may not be visible to the rider such that Active Riding is not implemented in time. This crash mechanism was considered dangerous and since there was some evidence in the NCIS data that this could be a crash mechanism involved in a number of fatal crashes, it was decided the asymmetric bump obstacle response of each vehicle was an important safety characteristic to include in the Australian Terrain Vehicle Assessment Program. Acceleration data was measured using accelerometers fitted to the rear cargo tray of the Quad bike, measuring the vertical and lateral accelerations experienced by the vehicle chassis when negotiating the obstacle. Laser height measurements were also used to determine vehicle body roll angle. During a visit at the early stages of test development by the FCAI representatives on the Project Reference Group, Dr. John Zellner suggested the team try using asymmetric obstacles that were semi-circular, with radii of 100, 150 and 200mm. Suitable obstacles were developed and tested at these same speeds (10-25 km/h). The perturbation experienced by the rider indicated that while the largest obstacle produced the most perturbation, there was sufficient disturbance created by the 150mm obstacle to warrant its use as the test obstacle. Further justification was found in narratives of Coroner’s reports, where 150mm obstacles were occasionally described (McIntosh and Patton, 2014). The team also considered that 150mm obstacles such as logs, rocks, ruts and grass tussocks were more likely to be concealed by long grass or might not appear to be a threat to the rider, whereas the larger 200mm obstacle would more likely be seen by a rider and because of its size, an appropriate riding style was more likely to be adopted to negotiate it correctly.
33
Part 2: Dynamic Handling Test Results (Report 2)
34
Left side perturbation
1
4
2
5
3
6 Right side perturbation
Figure 16: Time series photographs of rider on Honda Fourtrax TRX250 negotiating 200mm bump obstacle at 25 km/h. Note the lateral displacement of the rider and the vehicle yaw.
Part 2: Dynamic Handling Test Results (Report 2)
Data acquisition test runs were made using the 150mm obstacle at the various speeds. The results were difficult to interpret during the early stages of test development and contained a large amount of signal noise, caused by both the knobby tyres of the Quad bikes and the vibrations of the single cylinder engine. In addition, the results were widely scattered, with little repeatability. This methodology proved difficult for several reasons. Video analysis of the seated rider negotiating the obstacle showed that no matter how hard he tried, it was impossible for him to completely relax and strike the bump as if it was entirely unexpected. Variations in arm and wrist stiffness, calf and thigh clench around the cowling, stiffness of leg muscles and hip/knee joints etc., were all highly variable. The data also indicated the response at the cargo rack and failed to include the saddle cushioning as part of the attenuated perturbation of the rider. For these reasons it was decided that an ATD would be a more reliable instrument to measure the likely response of the vehicle and rider to a bump obstacle. While differences in response in such a test between a human and an ATD are likely to exist, nevertheless, observations by the study team of the motion of the ATD and a rider appeared sufficiently similar. The test team then developed a methodology whereby the 95th %ile ATD would be seated on the Quad bike and the vehicle towed over the obstacle at the test speed, slacking the tow cable just before bump impact. Accelerometers to measure vertical and lateral accelerations experienced by the ATD were installed in the pelvis instrument cavity. Tests were conducted at the various speeds and results analysed. Based on the results obtained and the knowledge that there was information contained in Coroner’s reports suggesting a large percentage of the fatal crashes on farms had occurred at low speeds, i.e. less than 25 km/h, it was decided to use only a single test speed of 25 km/h for the bump obstacle perturbation test (McIntosh and Paton, 2014). Note that selecting a such a single test speed may tend to “tune” the test results to this particular test speed (and bump size), as it is well known that vehicle bump response is highly speed- and vehicle-dependent, and the speed for “maximum response” would be expected to vary from vehicle to vehicle. Nevertheless, as a practical expedient for these tests, one test speed was used for all vehicles tested. To satisfy the test team that the test did in fact produce an accurate reproduction of the rider experience, a subjective Bump Obstacle Comparative program was also conducted. Each member of the three man research team rode each Quad bike over the 150mm bump obstacle at 25 km/h three times on each side and then assigned that Quad bike’s response to the given bump a score between 1 and 10. A score of 1 was considered to be subjectively totally unacceptable or highly hazardous by the individual test rider, whereas 10 was considered very comfortable and of low hazard by the individual rider. The resulting integer scores were summed and averaged and then the Quad bikes ranked in order of best to worst. The results are shown and discussed later in this report. Splay of Hips. The investigation team considered the issue of the effect the maximum splay of the ATD’s hips may have on dynamic handling results, especially the bump obstacle test
35
Part 2: Dynamic Handling Test Results (Report 2)
results. When setting up the ATD on the Quad bike, it is clear that the larger Quad bikes with wider fuel tank, cowling and saddle cause the ADT’s knees and thighs to press firmly against the Quad bike. In effect, the legs are at the limit of their splay. To move the ATD forward on the saddle, the legs must be physically pulled further apart at the knees, then the ATD can be slid forward on the seat. This compares with smaller and narrower Quad bike design, where the ATD may be slid forward and rearward with only minimal effort to splay the knees. The test team were concerned whether this would affect the results achieved in bump testing. It was considered that it will have some effect, but that the effect would be minimal, so as to be among the noise and variations in measurement. The reason for this is that while moving the ATD forward and rearward does require effort to splay the legs, moving the ATD sideways requires no additional adjustment of the knees or legs. The ATD is free to move vertically and laterally on the saddle in a limited radius without resistance caused by the leg positions. It was recognised that if the lateral displacement was to become very large, then there would be an effect caused by the clenching of the cowling by the ATD legs, but for the displacements observed, the impact on results was considered to be negligible. Foot Position for Bump Obstacle Test. Negotiation of the bump obstacle causes displacement of the ATD vertically and laterally, varying between each run made with a particular Quad bike. Clearly, whether the foot is in contact with the foot rest at the time of the bump impact and hence will be accelerated upward during the obstacle negotiation, could have an impact on the results. The foot may become displaced from its initial position in which the leading edge of the heel is in contact with the rear edge of the foot peg for a number of reasons. This includes: movement caused during the vehicle’s initial acceleration from rest (jerk) toward the obstacle; vibration caused by ground imperfections; vibrations caused by the knobbly tyres on the hard test surface during run-in; and the step onto the boards that the bump obstacle is positioned on for this test series. These all contribute minor variations to final positioning. This was considered in detail and video analysis of a number of test runs was undertaken to ensure the foot position did not cause results to vary widely or to be invalid. Despite minor movement of the foot occurring during the acceleration and run-in phase of the test run, this did not appear to significantly affect the test results. There was some minor variation in results caused by this phenomena but this was factored into the overall limits of accuracy for acceptable results. Deformation of Quad bike seat during bump obstacle testing. One variable that was not measured was the individual variation between repeat test runs of the Quad bike seat, caused by repeated application of the bump obstacle forces to the saddle. The saddle itself is generally a plastic base and frame, supported on several rubber mounting blocks along its length and held in position by a locating tongue(s) at the front and a securing latch at the rear. Depending on Quad bike make and model, there is some limited movement laterally
36
Part 2: Dynamic Handling Test Results (Report 2)
and longitudinally of the seat relative to the Quad bike frame, by as much as 10mm. This was generally managed by the testing team, by checking the position of the seat relative to the Quad bike frame as part of the set-up procedure for each test run. The variations were only very minor, but did contribute, along with other variables, to the overall margin of error allowed before results from repeat tests were considered to be within the acceptable accuracy limits. Effect of initial acceleration from rest of test specimen. During each test run the test specimen was accelerated from a standing start to 25 km/h within a relatively short distance (approximately 30 metres). This entailed harsh acceleration (jerk) at the start, reducing in magnitude as the test speed was approached, such that the tow vehicle was braked just before the moment the front wheel impacted the obstacle, allowing the test vehicle to negotiate the obstacle purely under its own momentum. The investigation team had concerns that the initial acceleration (jerk) that occurs at the start of each test run could affect the ATD set-up position and hence the repeatability of results. Video analysis was undertaken of several test runs, examining the ATD rearward motion relative to the Quad bike and whether this resulted in the elbows of the ATD pulling straight, so as to be locked in a 'stiff arm' position at the point of impact. This analysis showed that while there was some rearward motion observed during the initial longitudinal acceleration (jerk) from rest, the ATD elbows articulated correctly and repeatedly at the point of impact. This allowed the upper torso to shift sideways as part of the bump induced motions and so as to cause the ATD to then induce a steering effect through the Quad bike handlebar, as the upper arms and forearms articulated relative to each other. It was found that drift in ATD joint stiffness had more effect on repeatability of results than the initial acceleration from rest (jerk) during the test run (for the ATD used for this test battery - one side elbow tightened slightly over time, while one side loosened slightly, requiring regular checking of joint stiffness to ensure consistent results). Setting the Upper Arm and Elbow Position - Effect on Results. During the initial test development, it was found that some test runs produced highly repeatable results, while others (for seemingly no reason) produced a widely varying visual result (final position of the dummy), despite similar accelerations recorded at the ATD pelvis. Video analysis of these test runs showed that failure to ensure the ATD elbows were accurately positioned in a slightly bent arrangement, especially if they were locked in a straight arm position, could result in a visibly different outcome after the bump impact. Having the elbow locked straight caused the ATD to push differently on the handlebar and also to resist the torso from falling in the direction away from the bump. This 'stiff arm' of the ATD also appeared to resist lateral movement at the pelvis. The combination of arm articulation, shoulder movement and body displacement resulted in very different visible outcomes, despite the imparted accelerations being similar in magnitude. For this reason the ATD joint stiffness and setup position were constantly monitored during the test series.
37
Part 2: Dynamic Handling Test Results (Report 2)
A copy of the final Bump Obstacle Perturbation Test protocol is presented in Appendix A of the Crashlab Report (Attachment 1). Bump Testing SSVs. It was postulated by the Dynamic Handling testing team that the SSVs did not require bump testing. The reasons were that unlike the Quad bike, where the rider sits astride the saddle and any displacing movement is moving the rider towards falling off the side of the bike, the driver of a SSV sits behind the steering wheel and is restrained in their seating position by a seat belt and other lateral restraints (three point seat belt and other lateral restraints if the vehicle complies with the US ANSI/ROHVA 1 Standard). In addition, the driver has a steering wheel to hold on to and to brace against which, unlike the handlebar of a Quad bike, may not induce a steering input that magnifies the vehicle’s bump-induced yaw and roll when pulled on by the driver’s upper body lean. Positioning and measuring the reaction of a 95th %ile ATD was found to be difficult and the reactions showed that even if the ATD was subjected to a significant perturbing acceleration, the seat belt and other restraint mechanisms retain the ATD in its position. It was also considered that the force of the bump for an SSV would probably only be a driver comfort factor, not a safety factor, and that the degree of bump-related comfort can be tested by the consumer by way of a short test drive at the dealership or vehicle display area. Simply driving over a kerb or small log would tell the customer how well the vehicle attenuated the bumps. There was some concern within the Quad Bike Performance Project research team, however, that an SSV may negotiate the bump, but may yaw significantly, possibly enough to go out of control (noting that SSVs are often capable of quite high maximum speeds). To test this concern, the four SSVs tested in this program were driven over the 150mm bump at 25 km/h and the reactions of the vehicle and driver were recorded on video, which was then analysed in detail. The results were as expected, with the driver being restrained and retained in their seating position and no unacceptable perturbation of the vehicle or driver noted 2.2.5 Repeatability Testing Each test configuration was tested three times to establish result repeatability. Reproducibility testing with alternate riders and on different surfaces (asphalt, grass and bluemetal over compacted roadbase) with and without loads, was also conducted. For detailed results in regards to repeatability testing on asphalt and grass refer to Appendix B and Appendix C of the Crashlab Report (Attachment 1).
2.3 The Dynamic Test Results 2.3.1 Steady-state circular driving behaviour – limit of lateral acceleration The dynamic test results are summarised in Table 1 and in bar chart form in Figure 17. These show for each vehicle the limit of lateral acceleration (in ‘g’) when two wheel lift occurs (i.e. tip up) or when the rear of vehicle slides out which causes the vehicle to point towards the
38
Part 2: Dynamic Handling Test Results (Report 2)
inside of the circle, i.e. slides out or brakes traction (no tip up). Also shown for comparison is the measured “static” lateral stability in terms of the Tilt Table Ratio (TTR), from Part 1: Static Stability Test Results and Rating 17 Quad bikes and Side by Side Vehicles (SSVs) (Report 1-2013). The observations from these test results are: 1. All the Quad bikes’ limit of lateral acceleration occurs by tipping up onto two wheels, which unless able to be counteracted by the rider, is a precursor to rollover or loss of control – that is a loss of stability. 2. For the Quad bikes the measured minimum limit of lateral acceleration at tip up, with rider hips centred, is in the range of 0.36g to 0.55g, and for each Quad bike, was less than its measured TTR (rider only). 3. For the SSVs, these showed higher lateral stability than the Quad bikes, and for the test surfaces driven on and circle radius in a quasi-constant speed steady turning condition, did not tip up except for the Yamaha Rhino. 4. The three Quad bikes that were tested on dry asphalt and dry grass displayed very similar handling characteristics and tipped up at similar lateral acceleration values on both surfaces (see Appendix C in Crashlab Report (Attachment 1)). 5. The Honda TRX250 Quad bike12 was used as a representative Quad bike for comparing the effects of surface type, load combinations and Active Riding on lateral stability (see Table 2). Further, Table 2 compares the dynamic lateral stability results with those from the static stability Tilt Table Results (TTR). From Table 2: a. The representative Quad bike (Honda TRX250)12 when loaded and tested on dry asphalt, showed a small reduction of less than 6% in lateral acceleration at tip up (0.46g down to 0.43g), and about a 17% reduction when loaded and tested on dry grass (0.46g down to 0.38g). b. For the load combinations, the measured limit of dynamic lateral acceleration at tip up was in the range of 0.38g to 0.46g (dry grass and dry asphalt), compared with the static tilt table test of TTR of 0.49g to 0.51g. c. With Active Riding (asphalt), the dynamic stability values increased by approximately 13%, from 0.46g up to 0.52g. These values were very similar to the tilt table TTRs (without Active Riding) of 0.51. 6. The example Quad bike (Honda TRX250) when tested with the Quadbar and Lifeguard PPDs, showed only a minor change in limit of lateral acceleration (0.46g down to 0.45g)
12
A ‘representative’ Quad was selected for these comparison tests. It was beyond the scope and budget of this dynamic test program to be able to test all of the 17 vehicles in all load and surface combinations. As noted, well in excess of 546 tests were conducted in this dynamic test program alone.
39
Part 2: Dynamic Handling Test Results (Report 2)
1 2 3 4 5 6 7 8 9 10 11 12 13 14 15 16 17
Type SSV SSV Quad RQD SSV SSV RQD Quad Quad SSV RQD Quad Quad Quad Quad Quad Quad
Make Yamaha Honda Polaris Honda Kubota John Deere Can-am Honda CF Moto Tomcar Yamaha Honda Kawasaki Suzuki Yamaha Kymco Prototype
Model Rhino 700 Big red MUV700 Sportsman 450HO TRX700XX RTV500 Gator XUV825i DS90X TRX500FM CF500 TM2 YFM250R Raptor TRX250 KVF300 Kingquad 400ASI YFM450FAP Grizzly MXU300 (unlocked differential)
Min Dyn (g) 0.61 0.56 0.55 0.55 0.54 0.54 0.54 0.52 0.50 0.49 0.47 0.46 0.46 0.45 0.41 0.36 0.56
40
TTR (g) 0.65 0.83 0.6 0.66 0.72 0.82 0.78 0.58 0.6 0.96 0.56 0.51 0.54 0.57 0.52 0.46 0.81
Tip up Yes No Yes Yes No No Yes Yes Yes No Yes Yes Yes Yes Yes Yes No
Table 1: Steady State circular driving test - Average (minimum) limit of lateral acceleration vs TTR (g). ‘Yes’ is two wheel lift (i.e. tip up), ‘No’ is no tip up (asphalt surface, rider only).
Figure 17: Steady State circular driving test - Average (minimum) limit of lateral acceleration vs TTR (g). The category ‘Yes’ is for two wheel lift occurring (i.e. tip up), and ‘No’ is for no tip up (asphalt surface, rider only).
Part 2: Dynamic Handling Test Results (Report 2)
41
As a comparison, the testing by Scientific Expert Analysis (SEA) for the Consumer Product Safety Commission (CPSC) in the USA of 10 SSVs, reported in detail by Heydinger13 (2011) (and Heydinger et al., 2011), also identifies that the static rollover metric of Tilt Table Ratio (TTR) provides good correlation with the limit of lateral acceleration (Ay) at tip up for a J-turn test. This comparison14 of Ay to TTR from the CPSC tests is shown in Figure 18. Load Condition No.
1 2
3
4
Honda TRX250 Quad bike
Surface
Static Stability Tests Tilt (TTR) table Dynamic TestsAsphalt Limit of lateral acceleration Dynamic TestsGrass Limit of lateral acceleration Dynamic TestsAsphalt with Active Riding Limit of lateral acceleration
Baseline
Operator only
Operator plus rear load
Operator plus front load
Operator & front & rear load
0.82
0.51
0.51
0.49
0.49
n/a
0.46
0.46
0.43
0.43
n/a
0.41
0.41
0.38
0.40
n/a
0.49 to 0.52
Table 2: Honda TRX250 Quad bike: Effect of surface type, load and Active Riding on lateral stability: Comparison of static stability Tilt Table Results (TTR) with Steady State circular driving test - Average (minimum) limit of lateral acceleration. Static tests used 95th % adult male ATD, with Dynamic test rider similarly weighted.
2.3.2 Steady-state circular driving behaviour – understeer/ oversteer characteristics The results overall obtained show that most Quad bikes tested for this program have an oversteer characteristic. Table 3 shows the understeer and oversteer and point of transition characteristics for all vehicles. Table 4 shows the understeer and oversteer and point of
13
It is noted that Heydinger used a 'dropped throttle' J turn test for the Recreational Off Highway Vehicles (ROVs). This produces a slightly different dynamic and because he was testing ROVs with a roll cage and seat belt, he was able to conduct the test at a higher speed. While the test outcomes are somewhat similar, they are different dynamic tests to what this Project conducted.
14
The graph in Figure 18 is based on the presentation “Side by Side Off-Road Vehicles, Characteristics, Rollover Metrics and Standards” given by Lawrence A. Wilson of Wilson Consulting, LLC, Baltimore,
[email protected], at the ANB45(1) Rollover Subcommittee Meeting; Transportation Research Board (TRB), Washington, DC. January, 2014.
Part 2: Dynamic Handling Test Results (Report 2)
Side-by-side Rollover Threshold and TTR (g)
Figure 18: Comparison of Lateral acceleration of SSVs at tip-up (30mph (≈48km/h) J-Turn test) to static rollover resistance metric (TTR) (from Heydinger, 2011) transition characteristics for different surfaces and loading for selected vehicles. For example, the Honda Fourtrax TRX250 (Figure 19) indicates that vehicle transitions to oversteer almost immediately at 0.01g and subsequently displays around -7.5 degrees per g oversteer characteristic. In contrast, notably, the Honda TRX700 recreational Quad bike (Figure 20), showed a light understeer characteristic of between 2 and 3 degrees per g transiting to a slight oversteer at around 0.3g to 0.35g which is maintained through to beyond 0.5g. This is considered a very good steering characteristic15 and demonstrates that it is quite possible to design the steering and suspension systems of a Quad bike to produce the recommended handling characteristics desirable for a workplace environment. Importantly, both test riders commented that this vehicle was the most fun to ride as it improved rider confidence and provided very good feedback. SSVs that have open rear differentials (Honda Big Red MUV, John Deere Gator XUV825 and the Kubota RTV500) all exhibited light understeer handling characteristics. For off-road (e.g., low friction, rough and/or uphill) operations, it is essential that the differential be lockable, to provide traction and acceptable handling on such surfaces. When the rear differential was locked on test surfaces, the vehicle demonstrated oversteer characteristics. In addition, the open rear differential provided a self-limiting mechanism under the test conditions (7.6m radius), whereby the vehicle could not reach the speed and hence lateral
15
While there are disagreements in regards to what is considered to be good handling characteristics for Quad bikes overall, the Authors’ perspective relates to Quad bike use in the workplace environment.
42
Part 2: Dynamic Handling Test Results (Report 2)
Type 1 2 3 4 5 6 7 8 9 10 11 12 13 14 15 16 17
SSV SSV Quad RQD SSV SSV RQD Quad Quad SSV RQD Quad Quad Quad Quad Quad SSV
43
Understeer (g) Turning Left Make Model Transition Gradient (g) (deg/g) Yamaha Rhino 700 0.2 -2.92 Honda Big red MUV700 n/a 2.92 Polaris Sportsman 450HO 0.13 -7.83 Honda TRX700XX 0.52 2.58 Kubota RTV500 0.35 0.92 John Deere Gator XUV825i n/a 2.08 Can-am DS90X 0.2 -2.33 Honda TRX500FM 0.05 -4.17 CF Moto CF500 0.1 -4.58 Tomcar TM2 n/a 3.58 Yamaha YFM250R Raptor 0.02 -8.42 Honda TRX250 0.07 -12.17 Kawasaki KVF300 0.3 -10.5 Suzuki Kingquad 400ASI 0.03 -11.08 Yamaha YFM450FAP Grizzly 0.13 -7.08 Kymco MXU300 0.135 -9.33 Honda Big red MUV700 0.2 -0.83
Understeer (g) Turning Right Transition Gradient (g) Deg/g) 0.05 -10.58 n/a 3.58 0.1 -9.0 0.51 1.58 n/a 2.58 n/a 7.92 0.04 -3.25 0.09 -8.0 0.1 -9.0 n/a 7.0 0.03 -8.67 0.07 -11.0 0.025 -7.5 0.05 -11.33 0.15 -8.58 0.1 -11.83 0.1 -1.33
(locked differential)
18 Quad Prototype
(unlocked differential)
n/a
7.81
n/a
7.54
Table 3: Steady State circular driving test - understeer characteristics and point of transition for the 17 test vehicles. Asphalt surface, rider only. Note that negative understeer is an oversteer characteristic. n/a means the gradient did not transition between under and oversteer in the range tested, i.e. remained understeer.
Steady-state circular driving behaviour – understeer characteristics Operator only Load Understeer Transition Gradient
Operator plus load Understeer Transition Gradient
Vehicle
Surface
Honda TRX250 (Quad) Honda Big Red MUV700 (SSV) Yamaha Rhino 700 (SSV)
Asphalt
0.075
-10.17
0.09
-16.58
Grass
0.06
-10.33
0.05
-12.57
Asphalt
n/a
3.58
n/a
1.17
Grass
n/a
4.08
n/a
4.08
Asphalt
0.05
-10.58
0.06
-10.33
Grass
0.05
-14.42
0.05
-10.92
Table 4: Steady-state circular driving behaviour – understeer characteristics - affect of loading and surface (asphalt and grass). Note: a negative understeer gradient indicates an oversteer characteristic. Honda TRX250 front load = 15kg; rear load = 30kg; Honda MUV rear load = 454kg; Yamaha Rhino 700 (SSV) rear load = 181kg. N/A means the gradient did not transition between under and oversteer in the range tested, i.e. remained understeer.
Part 2: Dynamic Handling Test Results (Report 2)
Figure 19: Understeer/oversteer graph for the Honda TRX250 showing characteristic oversteer behaviour of around -7.5 degrees per g between 0.1 and 0.4g lateral acceleration.
Figure 20: Understeer/oversteer graph for the Honda TRX700XX showing characteristic understeer behaviour of around 2.5 degrees per g between 0.1 and 0.33g lateral acceleration and then transition at around 0.33g to slight oversteer beyond 0.5g.
44
Part 2: Dynamic Handling Test Results (Report 2)
acceleration required for 2 wheel lift and tip-over. As the inside wheel lifted, drive would transfer to the free wheel and it would spin up, causing a slight loss of vehicle speed and then the wheel would return to the ground. Future testing should consider the use of a larger radius circle so that the vehicle tip up speed could be reached To make the comparison, the rear differential was locked on selected vehicles and driven on the test circle (Figure 21 and Figure 22). Not only was it more difficult to control the vehicle
Figure 21: Honda Big Red MUV with open differential on left. Vehicle follows path of test circle easily and top speed is limited by inside rear wheel lift (spin-up). With locked differential on right, MUV oversteered throughout the test, ending up turning into the test circle, sliding sideways to the intended direction of travel and nearly tipped up onto the outrigger wheel. on the circle, the vehicle reached the lateral acceleration required for 2 wheel lift and the rear slid out, resulting in the vehicle oversteering sharply towards the centre of the circle and a sudden transient roll onto the outrigger wheel at the end of each test. Based on the experiences of the test team, as well as supported by test data, the best handling vehicles had a light understeer characteristic in the range between 0.1 and 0.5g lateral acceleration and also had an open rear differential. This allowed the vehicle to turn freely and not resist the rider or driver due to the plow effect of a locked rear axle. The vehicle were not only more nimble and responsive, it is more pleasant to operate. As previously noted, on some loose low friction surfaces or muddy conditions, the ability to lock the differential is a necessary feature, i.e. differentials should be selectable for both open or locked. 2.3.3 Lateral transient response time Eleven Quad bikes, the prototype Quad bike and the five SSVs were subjected to lateral transient response tests in a total of forty different configurations. The key finding of the lateral transient response testing was that most of the Quad bikes tested have what can be considered good steering response times (of the order of 0.2 seconds or less), which is to be expected of a relatively short wheel-based, lightweight vehicle that has quite grippy tyres.
45
Part 2: Dynamic Handling Test Results (Report 2)
Unlocked rear differential
Locked rear differential Figure 22: Understeer/oversteer graph for the Honda Big Red MUV700 SSV. Top frame: understeer with unlocked rear differential. Bottom frame: oversteer with lock rear differential.
46
Part 2: Dynamic Handling Test Results (Report 2)
47
The SSVs also exhibited good steering response times, typically of 0.3 seconds or less at the test lateral acceleration of 0.4g developed at the test speed of 20 km/h, indicating they are generally suitable for use in a farming environment (see Figure 23). Other research (Renfroe, 1996, Heydinger, 2011) has shown higher speeds can produce longer steering response times for SSVs. Lateral transient response tests - Average Lateral transient response time (s) 0.35
Lateral transient response time (s)
0.30
0.25
0.20
0.15
0.10
0.05
X7 00 XX
TR
Ra pt or
2
S9 0X
25 0R
YF M
D
TM
V7 00 M U
V8 25 i
re d
XU
at or G
Left
Bi g
TV 50 0 R
70 0 hi no
F5 00
R
C
KV F3 00 M XU 30 0
X5 00 FM 45 0F AP Sp G riz or zly ts m an 45 Ki 0H ng O qu ad 40 0A SI YF M
TR
TR
X2 50
0.00
Right
Figure 23: Results Lateral transient response test, average steering response time unladen vehicles on asphalt (from Crashlab Report – Attachment 1) The three Quad bikes and two SSVs that were tested on asphalt and grass all displayed slower lateral transient response times when tested on grass. The lateral transient response times were typically in the order of twice as long when tested on grass compared to asphalt. The average lateral transient response times on grass for these five vehicles were less than 0.5 seconds. However, the slowest individual lateral transient response time for one of the SSVs was 0.61 seconds. In summary, as already noted previously, based on the testing program results as well as the subjective assessments by the test team, the vehicles that handled well (consistently and safely)16 and were likely to reduce the risk of a loss of control crash occurring, had a slight understeer characteristic when excited between 0.1 and 0.5g lateral acceleration and a lateral transient steering response of less than 0.25 - 0.3 seconds when tested on asphalt.
16
This is in relation to the typical workplace environment. Of course there are other circumstances such as in some recreational riding or racing where different characteristics are desired.
Part 2: Dynamic Handling Test Results (Report 2)
2.3.4 Test results - bump obstacle test Eleven production Quad bikes and a prototype Quad bike were subjected to the bump obstacle test. The visible outcomes of the bump obstacle test ranged from the Quad bike with its dummy rider passing straight over the bump, without significant perturbation to either, to a large vertical and lateral displacement of the Quad bike and dummy with associated steering input leading to near rollover of the test vehicle. In between these two extremes, there appeared to be variations that included significant vertical displacement without much lateral displacement and some which included sideways motion (yaw) of the Quad bike (movement of the rear end away from the obstacle). The visible outcome (dummy body roll and steering input) occurred after the accelerations had been imparted by the bump obstacle. These ‘bump tests’ identified, possibly for the first time, a significant mechanism in which Quad bike riders may lose control when one track goes over moderately high rounded bumps (similar to half-buried logs, drainage or irrigation pipes, small mounds, rocks, rabbit holes, etc.) with either the left wheels or the right wheels. When the rider and Quad bike is displaced substantially laterally whilst traversing a ‘bump’, the rider can pull on the handle bar, further increasing the turn of the Quad bike, potentially leading to rollover. In some cases the rider could inadvertently press the thumb accelerator and accelerate the vehicle during this mechanism. The Quad bikes exhibited ATD pelvis lateral/vertical resultant acceleration values of between 1.47g and 3.66g (see Figure 24). Quad bikes such as the CF Moto CF500 that exhibited lower resultant ATD pelvis acceleration typically negotiated the bump with little lateral movement of the Quad bike and ATD relative to the seat of the Quad bike. Quad bikes that exhibited higher resultant ATD pelvis acceleration typically showed significant ATD movement relative to the seat of the Quad bike such as, for example, the Honda Fourtrax TRX250 (Figure 16). In regards to the bump obstacle subjective comparative testing, the results are shown in Table 5. This final test configuration proved useful, with the peak resultant of lateral and vertical accelerations being repeatable (within 5% of the arithmetic mean). The experience of test riders with each vehicle generally compared very closely as shown subsequently in Figure 24 to the both the visual assessment of the response of the ATD and the accelerations recorded at the ATD pelvis. The final ranking by the test team was similar to the result obtained using the test protocol, with 9 of the 11 Quad bikes exactly in order and the last two juxtaposed. The two dissenting results had very close riding assessment scores and recorded test accelerations. It is possible the shape of the saddle may have influenced the riding assessment slightly, but the size of the measured differences meant it would be very hard for any rider to discriminate between the performances of these two vehicles. All of the SSVs traversed the bump satisfactorily, with low level of rider or vehicle perturbation. Subjectively, the best attenuation of the bump was made by the Yamaha Rhino (Figure 25), which hardly disturbed the driver or the vehicle at all. Both the John
48
Part 2: Dynamic Handling Test Results (Report 2)
49
Deere Gator (Figure 26) and the Honda Big Red MUV (Figure 27) handled the bump well, with only minor perturbation experienced by the driver and very little course deviation. The largest perturbation observed was the Kubota RTV 500 (Figure 28 and Figure 29), which passed a significant bump on to the driver and displayed noticeable (but not dangerous)
Table 5: Bump Obstacle Comparative testing with three different riders.
Pelvis resultant acceleration (lateral/vertical) over 150mm obstacle 3.50
2.50 2.00 1.50 1.00 0.50
Left perturbation
Figure 24: Bump obstacle test results for the 11 Quad bikes.
00 TR X7
or ap t R Right perturbation
XX
0R YF
D
M 25
S9 0
X
0 F5 0 C
00
30 0 M XU
ad Ki ng
qu
KV F3
40
45 0H an m
or ts Sp
YF y zl G riz
0A SI
O
0F AP M 45
X5 0 TR
re m an Fo
ur tra x
TR X2
0F
M
50
0.00
Fo
Acceleration (g's)
3.00
Part 2: Dynamic Handling Test Results (Report 2)
Figure 25: Yamaha Rhino passes over bump at 25 km/h with minimal disturbance to driver or vehicle.
Figure 26: John Deere Gator passes over bump at 25 km/h with only slight vertical disturbance to driver or vehicle.
Figure 27: Honda Big Red MUV passes over bump at 25 km/h with only slight vertical disturbance to driver or vehicle.
Figure 28: Kubota RTV 500 passes over bump at 25 km/h with minor visible vertical and lateral disturbance to vehicle and driver who holds on to the steering wheel.
50
Part 2: Dynamic Handling Test Results (Report 2)
Figure 29: Vehicle ended up facing toward the camera, approximately 6 degrees of yaw. yaw towards the bump (the rear moved away from the side the bump struck). This was not considered as an adverse result because the Kubota’s bump response was subjectively considered by the team to be uncomfortable but not unsafe. 2.3.5 Repeatability of results Each test configuration was tested three times to establish result repeatability. Full results tables are contained in Attachment 1 – the Crashlab report, Appendix B and Appendix C. Table 2 and Table 4 provide summary details of the comparison between asphalt and grass. The results were considered acceptable for all three test series (circle test, lateral transient response and perturbation bump test). For the Steady-state circular driving behaviour tests, the dynamic vehicle response gave very similar results for each of the three tests for all configurations tested. The results for the circle tests on asphalt were within 10% and for grass it was within 20% variation. For lateral transient response, the only significant variation between the results obtained on bitumen and on grass are that there are slightly more oscillations occurring in the lateral yaw rate data, due to minor inconsistencies (tufting) in the grass surface. There was a slight increase in response time associated with lower friction coefficient surfaces, as was expected. The lateral transient steering response times for vehicles in the unladen test condition when tested on asphalt varied between repeat tests by less than 0.14 seconds with a significant number of tests displaying a variance of less than 0.05 seconds. Different riders and different surfaces produced very similar response curves, indicating acceptable repeatability and reproducibility of the test. Figure 30 shows the differences between the two riders used for testing (Figure 10) in regards to assessing understeer/ oversteer response. The top graph has slightly greater data spread, caused by slightly more stab steer as the rear wheel lifted. The second rider was less familiar with this vehicle. Importantly, the characteristic curves have the same shape and represent an oversteer characteristic of around 9.1 to 9.7 degrees/g between 0.1 and 0.4g lateral acceleration.
51
Part 2: Dynamic Handling Test Results (Report 2)
Concerning the tests on different surfaces, it was anticipated that when the surfaces have reasonable cohesiveness, then the results would be similar in nature (i.e. the characteristic would be the same). The understeer/oversteer response results obtained from testing showed that the only effect the surface type has is to shift the curve up or down on the graph, but does not affect the slope of the curve to any large amount, which is the important parameter describing the vehicle’s handling characteristic. In the Bump obstacle perturbation tests, the lateral/vertical ATD pelvis resultant acceleration values varied by up to 0.45g between three tests of the same vehicle. Typically the variation between repeat runs was less than 0.25g. These results show good repeatability and confirm that Quad bikes (and SSVs) can be reliably tested and rated for handling characteristics and thus also improvements in handling can be demonstrated, and as a result a rating system such as ATVAP that includes Dynamic Handling can be successfully developed. 2.3.6 Different riding positions (simplified Active Riding) While the test series run to evaluate the effect of different riding positions was not a complete assessment of Active Riding style, the movement of the body implemented as shown in Figure 11 and Figure 12 at the most appropriate time provided a transient or dynamic benefit to vehicle stability beyond the simple variation to static stability that could be measured. It was a simplified series of tests to assess the effects of the rider leaning well forward, fully rearward and leaning into the circle as far as possible. With Active Riding (asphalt), the dynamic stability values increased by approximately 13%, from 0.46g up to 0.52g (Table 2). These values were very similar to the tilt table TTRs (without Active Riding) of 0.51 (Table 1). Figure 31 shows the effect on oversteer/understeer of the rider seated at the reference point and when actively riding in the positions noted. The results were in line with expectations and were in keeping with the principles of vehicle dynamics, which are well documented in the literature (Miliken, 2004, Gillespie, 1992). Leaning forward shifted the vehicle Center of Gravity (CoG) forward and hence improved understeer (decreased oversteer effect), and shifting the rider weight rearward shifted the CoG of the entire system rearward increasing oversteer. Note, on yielding surfaces, e.g., soft sand or mud, different effects may occur but were not part of this testing program. Leaning into the corner resulted in shifting the vehicle CoG slightly forward (the rider could not reach the far side handgrip without moving forward slightly). This reduced oversteer and the inboard movement helped improve static stability and hence increased the lateral acceleration at which vehicle tip-up occurred. While these results are not conclusive as to the exact benefits of an Active Riding style, they do strongly suggest that proper training and use of an Active Riding style are important to reduce the risk of rollover and can be used to increase the performance envelope of a Quad bike, should the rider so desire it.
52
Part 2: Dynamic Handling Test Results (Report 2)
Rider 1
Rider 2 Figure 30: Understeer/oversteer graph for Honda Fourtrax TRX250 for two riders.
53
Part 2: Dynamic Handling Test Results (Report 2)
rider at seat reference point
rider leaning in and forward
rider sitting well forward
rider sitting well back
Figure 31: Effect on understeer/oversteer and tipping point of different riding positions. 2.3.7 Comparison with Standards There are no standards or compliance requirements in Australia for Quad bikes or SSVs. However, three United States of America (USA) standards exist, one of which is relevant to Quad bikes and two of which are relevant to SSVs. They are, respectively for Quad bikes: ANSI/SVIA 1-2010: American National Standard for Four Wheel All-Terrain Vehicles; and for SSVs: ANSI/ROHVA 1-2011: American National Standard for Recreational Off-Highway Vehicles, and also ANSI/OPEI B71.9-2012: American National Standard for Multipurpose Off-Highway Utility Vehicles. The difference between ANSI/ROHVA 1-2011 and ANSI/OPEI B71.9-2012 in terms of which SSV vehicle any respective standard applies to appears vague. In this project the research team referred to the ANSI/ROHVA 1-2011 standard for SSVs. There are no dynamic handling requirements specified for Quad bikes in the ANSI/SVIA 12010: American National Standard for Four Wheel All-Terrain Vehicles. For SSVs the ANSI/ROHVA 1-2011 standard sets out the following Dynamic Handling test requirements in Clause 8.3: Asphalt surface with friction co-efficient of at least 0.90. Vehicle loaded with driver plus equipment (including outriggers) of 195kg.
54
Part 2: Dynamic Handling Test Results (Report 2)
55
Circle test, with a 7.6m radius. The vehicle drive train is set in its most-open setting, e.g. if possible, two-wheel drive shall be used instead of four-wheel drive, and a lockable differential, if so equipped, shall be in its unlocked, or “open,” setting. Vehicle is slowly accelerated until: a) a corrected lateral acceleration of at least 0.6g is reached; or b) a corrected lateral acceleration of at least 0.6g cannot be reached and: i. a two-wheel lift of two inches or more occurs; or ii. further increases in vehicle throttle input do not result in increases in vehicle speed. Tests are repeated 5 times for each direction (clockwise/ anticlockwise or left/ right). While these exact test conditions were not used in the SSV testing, some similar but possibly more severe tests were carried out on two SSVs with results set out in Table 6. These results show that the two vehicles would very likely meet these ANSI /ROHVA 1-2011 minimum requirements of lateral acceleration exceeding 0.6g. The Authors consider that while SSVs in general demonstrate higher stability TTRs than Quad bikes, the Standard should nevertheless require higher dynamic stability limits of lateral acceleration. The Authors note that the most recent US CPSC’s study (US CPSC, 2014) recommends an increase in lateral stability in the current standards, to require a minimum lateral acceleration at tip up for SSVs of 0.70 g in a J turn test at 30 mph (48 km/h) to reduce the risk of rollover. The issue concerning inadequacy of current standards regarding vehicle stability has also been discussed in detail in Part 1: Static Stability Test Results and Rating of 17 Quad bikes and Side by Side vehicles (SSVs) in Sections 3.5 and 4.4 and in particular Table 11 in that report lists the outcomes.
Make
Model
Surface
Loading
Average limit of lateral acceleration (g)
Left Rear 0.75 differential locked
Right 0.67
Asphalt
Rear load (454kg)
0.62
0.55
Rhino 700 Asphalt
Rear load (181kg)
0.74
0.68
Honda
Big red MUV700
Asphalt
Honda
Big red MUV700
Yamaha
Dynamic vehicle outcome Left Rear of the vehicle slid out causing vehicle to point towards the inside of the circle Inside rear wheel broke traction (limiting speed) Two wheel lift
Right Rear of the vehicle slid out causing vehicle to point towards the inside of the circle Inside rear wheel broke traction (limiting speed) Two wheel lift
Table 6: Average limit of lateral acceleration (g) for two SSVs loaded, on asphalt.
Part 2: Dynamic Handling Test Results (Report 2)
56
3. DYNAMIC STABILITY AND HANDLING OVERALL RATING INDEX FOR THE 17 TEST VEHICLES The Dynamic Handling Overall Rating Index is the second of the three major test components of the ATVAP Star rating system:
Static Stability Tests Dynamic Stability Tests Crashworthiness Tests
The proposed Dynamic Handling Overall Rating Index is based on the summation of the index values from the following four dynamic test results with rider/ driver for each vehicle.
3.1 Points Ratings Each test will be rated out of 5 points, with a total of 25 points, with points allocated as set out in Table 7. 1. Steady-state circular driving dynamic tests - the limit of lateral acceleration, Ay (g) 2. Steady-state circular driving dynamic tests - understeer/oversteer characteristics. 3. Lateral transient response dynamic tests - the steering response time. 4. Bump obstacle perturbation tests - the measured acceleration of the ATD’s pelvis. The total points for the Dynamic Handling Overall Rating Index (25) are similar to those proposed in the Static Stability rating. These are based upon the Authors’ assessment that the risk of rollover is reduced by having higher rollover resistance, mild understeer, shorter yaw/steering response time, and minimal dummy resultant acceleration when traversing a bump with one wheel track (either left or right).
Criteria 1. Lateral Stability Ay (g) at tip up (no tip up = 3 pts) 2. Steady State turning -Transition to oversteer (g) 3. Steady State turning -Understeer Gradient (degree/g) 4. Steady State turning - Oversteer Gradient (degree/g) 5. Steering response time (s) 6. Bump Obstacle Response - Pelvis acceleration (g)
1 1.0
0.5 >3.0
-7.9 to -4.0 Oversteer 0.41 to 0.5 2.1 to 3.0
-3.8 to -1.0 Oversteer 0.31 to 0.4 1.6 to 2.0
-0.99 to 0.5 Neutral 0.2 to 0.3 1.0 to 1.5
0.49 to 3.0 Understeer