Dynamic Highway Congestion Detection And Prediction Based On Shock Waves Dijiang Huang, Swaroop Shere
Soyoung Ahn
School of Computing, Informatics, and Decision Systems Engineering Arizona State University Tempe, Arizona 85281, USA
School of Civil, Environmental and Sustainable Engineering Arizona State University Tempe, Arizona 85281, USA
{dijiang,
sshere}@asu.edu
[email protected]
ABSTRACT Existing highway traffic monitoring system requires to deploy a large number of sensors and video cameras to detect traffic congestions, which is costly and prone to errors and failures [1]. In this paper, we present a distributed traffic detection and prediction solution by using shock wave traffic model. We develop a Hello protocol to maintain the vehicle sequence on the same lane. Based on the measurements of velocity and distance between immediate leading and following vehicles, a vehicle can detect and compute shock wave velocity incurred by vehicle merges or obstacles on the highway. When velocity changes occur continuously, congestions will be formed, which can be detected and predicted by the vehicles through a shock wave detection procedure. Our solution is effective since we only require vehicles to communicate with its neighboring vehicles within its wireless communication range.
Categories and Subject Descriptors C.2.4 [Computer-Communication Networks]: distributed systems, distributed applications; H.4.3 [Information Systems Applications]: Communications Applications
General Terms Algorithms, Design, Measurement
Keywords VANET, Traffic Modeling, Congestion Detection and Prediction
1. INTRODUCTION Highway congestion detections are usually based on either stationary video cameras or using moving vehicles (or helicopters) as mobile sensors to collect road traffic information. The collected data are eventually processed for congestion prediction by a centralized server using techniques such
Permission to make digital or hard copies of all or part of this work for personal or classroom use is granted without fee provided that copies are not made or distributed for profit or commercial advantage and that copies bear this notice and the full citation on the first page. To copy otherwise, to republish, to post on servers or to redistribute to lists, requires prior specific permission and/or a fee. VANET’10, September 24, 2010, Chicago, Illinois, USA. Copyright 2010 ACM 978-1-4503-0145-9/10/09 ...$5.00.
11
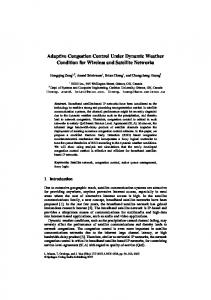
as artificial intelligent techniques (e.g., to build a learning model for traffic properties of road congestions). There are several drawbacks of existing solutions for highway congestion detection and prediction. First, stationary video cameras cannot be installed on every road segment of a highway system due to high cost and high maintenance overhead. As a result, the fixed cameras cannot detect congestions caused by accidents or temporary road constructions that are located outside of the monitoring areas. Second, using mobile vehicles as mobile sensors to report their locations and velocities requires end-to-end communication connections from each vehicle to a centralized server for information processing. Third, existing congestion prediction models require historical data to build congestion prediction models, which require large amount of data and thus they are not suitable in a distributed fashion. Furthermore, the centralized congestion prediction models may incur long delay, high false positive and negative, and unreliable information collection and distribution in a highly dynamic vehicular communication system. To address the deficiencies of existing congestion detection and prediction models, the following properties are desired: (a) congestion can be detected by each vehicle based on its own movements and surrounding vehicles’ behaviors; (b) no centralized server is required to collect traffic data for congestion detection; (c) no centralized server is necessary to maintain a large data source to predict congestion; and (d) each vehicle must be able to detect and predict congestion just based on communicating to its neighboring vehicles. Achieving these properties allows vehicles to perform congestion detection and prediction on any road segment. To this end, we present a novel solution that allows each vehicle to detect shock (or Kinematic) waves and compute the distance and time toward congestion, and predict the congestion’s length, and duration. In Figure 1, we present an illustrative example to demonstrate the vehicle following model in the space-time domain, where the red arrows indicate shock waves traveling towards the upstream directions when congestions occur. The impact of a shock wave is the velocity reduction of each vehicle sequentially towards the upstream of the traffic flow. To utilize shock waves for congestion detection and prediction, we first need to investigate the causes of shock waves in the highway. Research in [2, 3, 4] shows that shock waves are usually caused by road events such as vehicle merges, diverges, traffic controls (such as road constructions), and accidents. Among these common events on a highway, merges,
shock waves
speed to study the formation of shock waves. In an attempt to simplify the evaluation of traffic characteristics, Newell [8, 9] proposed a simplified kinematic wave theory, which expressed the conservation law using cumulative flow, where cumulative curves were used to analyze traffic dynamics rather than following the path of shock waves. To apply existing traffic models for real road system traffic flows, moving sensors or stationary video cameras [10] need to be deployed to capture traffic flow and density information. For example, serving as moving sensors, vehicles are required to carry GPS devices [11] or using cellular system technology [12] to report their travel velocities. They must report their sensing velocities and locations to a centralized processing unit to perform congestion detection and prediction. However, using stationary video cameras has the drawback on the limited coverage areas on the highway. Fuzzy logic [13] and hidden Markov Chain [14] based solutions has been proposed, which require history data to predict the congestions. These solutions require the history of traffic on each road segment and the dissemination of congestion information requires additional communication channels, e.g., large display board or radio channels.
Figure 1: Example of shock waves. Figure is plotted using trajectories from the data set provided by Federal Highway Administration (FHWA)’s Next Generation Simulation (NGSIM) program : I80 - set2 C lane2. Each line represents a vehicle’s travel velocity in the space-time domain. road constructions, and accidents usually create upstream shock waves, and thus cause congestions. In this research, our presentation of protocols, congestion detection and prediction models is based on vehicle merges and accidental events. We propose a Hello protocol for each vehicle to discover and maintain a vehicle sequence on the same lane. The Hello protocol allows us to detect shock waves due to vehicle merges. Using the presented shock-wave detection and propagation procedures, a following vehicle can detect congestions incurred by continuous multiple merges, and predict the congestion duration and length. Our approach is novel in that we explore the spontaneous responses of vehicles to road traffic scenarios such as merges, which have been identified as the major causes of highway congestion. Our solution is also effective in that it only requires vehicles to communicate with the neighboring vehicles within its wireless communication range without relying on a centralized system for congestion detection and prediction. The rest of the paper is arranged as follows: in Section 2, related work is presented; the communication model and basis of shock wave theory are presented in Section 3; Section 4 describes the Hello protocol; Section 5 address how to detect shock waves and propagate wave information; In Section 6, we present how to compute the congestion length and time based on received wave packets; The protocol evaluations is presented in Section 7; Finally, we conclude our work and discuss new research directions in Section 8.
3.
SYSTEM AND MODELS
We present the vehicular communication model, shock wave model, and security considerations in this section.
3.1
Vehicle Communication, Timing, and Sensing Capabilities
Although Global Positioning System (GPS) devices are commonly used these days, we do not use GPS devices in our protocols because current GPS devices usually produce large errors. For example, current civilian GPS position fixes are typically accurate to about 15m errors [15]). We do notice that Differential GPS, despite being pricey and not commercially available yet, can achieve accuracy of about 1.5-2 m. This level of accuracy will enable many lane-based vehicle-to-vehicle applications in the future, however we do not consider in this paper. We assume that time does not need to be synchronized among vehicles. However, each vehicle must be able to accurately compute the time delay from measuring distance or velocities to sending the measured values in a data packet. In this way, the packet receivers can select their correct measurements within the correct time interval. For example, if a vehicle i sends a distance measure d(i, i − 1) with time lapse Di , the immediate upstream vehicle i + 1 can compute the distance d(i + 1, i − 1) = d(i, i − 1) + dt (i + 1, i), where t = Di /∆t represents the distance measure back to t time slots. This approach requires each vehicle to take measures for every ∆t, and it allows vehicles to synchronize their measures when ∆t is sufficiently small. Using this approach, in our described protocols and measuring models, vehicles can synchronize their velocity and distance measures even if the time is not universally synchronized. This is because the RF propagation delay is generally negligible. Thus, the error introduced by our approach is mainly due to the transmission delay. For example, the message size is restricted within 100 bytes in our solution. For a given 6 Mbps communication link, the transmission delay is about 1.67×10⁻⁵ seconds. Thus, the distance measure error is about 0.00037 meters when the vehicle moving velocity is 80km/s. This illustration is pessimistic since the velocity of a congestion scenario
2. RELATED WORK Cassidy and Rudjanakanoknad [2] conducted an empirical study to observe the causes of a reduction in discharge rate when a recurrent merge bottleneck activates on a highway. They observed that when the inflow from an on-ramp was sufficiently large (e.g., during the rush hour), the accumulation in the highway shoulder (rightmost) lane immediately upstream of the merge increased. When the accumulation reached a “critical” level, vehicles in the shoulder lane maneuvered toward faster, left lanes in attempts to increase their travel speeds, causing traffic breakdown in left lanes and decreasing the overall discharge rate through the bottleneck. Many traffic models have been proposed to describe traffic flows. Lighthill and Whitham [5, 6] developed a traffic flow theory using the first-order continuum model of traffic flow. Richards [7] developed a similar theory of traffic flow by deriving an empirical relation between density and
12
x
is usually far less than 80km/hr. This level of errors does not significantly impact our measurement results (the distance measurement error is restricted by 0.5 meters using our protocols). Rear Directional Antenna
(qd, kd) x1 vd i-1
Front Directional Antenna
T=f2 R=f1
L
Rear Radar
vu
i
T=f1 R=f2 Front Radar
x2
i+1 i+2
w
(qu, ku)
t
T
Figure 2: Directional antennas, distance radar, and their working zones.
t2
t1
Figure 3: Flow conservation law and shock wave theory in time-space domain.
In [16], the authors showed the advantages of using directional antennas over omni-directional antennas on transceivers for vehicles. Our protocols assume that vehicles are equipped with two directional antennas: one facing forward direction and one facing backward direction, which is illustrated in Figure 2. The front transmitter is tuned to the frequency f1 and the receiver is tuned to the frequency f2 ; on the contrary, the rear transmitter is tuned to the frequency f2 and the receiver is tuned to the frequency f1 . Using directional antennas is the key of our approach for vehicles to detect a message: whether it is sent from leading vehicles or from following vehicles. This information will be used by each vehicle to build a correct vehicle sequence for Kinematic wave detection. The signal transmission distance depends on the type of devices utilized. For example a DSRC [17] transmitter can send a signal up to 1,000m [18]. We also assume that vehicles are equipped with distance detectors at the front and back. For example, the millimeter wave radar can detect a vehicle on the same straight lane [19]. The radar measures the distance to the vehicle ahead within 120m and the azimuth angle of 16 degrees. Combining a vehicles traveling speed and yaw rate with distance, relative speed, and angular data detected by the radar, the vehicle in the same lane ahead can be identified. Existing millimeter wave radar can restrict the detection error about 0.5m [20], which is suitable for our proposed wave detection protocol.
where, kd and ku are densities at downstream and upstream of the shockwave w, respectively; qd and qu are corresponding flows. w represents transitions or disruptions in flow propagation in space, a.k.a., Kinematic shock waves. In Figure 3, the wave w represents a congestion scenario, where flows reduce speed from vu to vd towards the upstream. Since a vehicle uses radar technologies to measure the velocities of its leading and following vehicles, it can measure the inter-vehicle distance. Thus, we can formulate the following micro flow and density functions as the views of vehicle i at space-time point (x, t) as follows: k(x, t) = q(x, t) =
|N | , L ∑ 1 vl , L
(2) (3)
l∈N
where N is the set of vehicles in segment L, and vl (l ∈ |N |) is the instant velocity of vehicle l in the segment. For a micro view, usually |N | equals to 3, including vehicles i and its front and back vehicles i − 1 and i + 1, respectively, on the same lane.
3.3
Architecture of Shock Wave Protocols
3.2 Shock Wave Model Shock Wave Protocols
The traffic flow model describes traffic streams at an aggregated level in analogy with fluid dynamics that can be modeled using traffic density and flow as shown in Figure 3.
Shock Wave Detection and Propagation
Vehicle Sequence Detection and Maintenance Hello Protocol
In the LWR Kinematic wave theory [21, 7], the conservation law of traffic flow can be expressed as:
Sequence Initialization
∂k(x, t) ∂q(k(x, t)) + = 0, ∂t ∂x where k is the density (number of vehicles per unit distance) and q is the flow (number of vehicles passing a given point in unit time) at the space-time point (x, t) on a roadway. The conservation law of traffic flow is: the total number of vehicles in segment L at t1 and vehicles entering x1 during T equals to the total number of vehicles in segment L at t2 and vehicles exiting x2 during T . Based on the conservation law of traffic flow, the velocity of shock wave can be formulated as follows: ∆q qd − qu = , (1) w= kd − ku ∆k
Wave Detection Sequence Maintenace
Unknown Vehicle Status Check
Wave Information Propagation
Congestion Prediction
Figure 4: Architecture of shock wave protocols. As shown in Figure 4, the shock wave protocols include two phases: (1) vehicle sequence detection and maintenance, and (2) shock-wave detection and propagation. The first phase is achieved through our presented Hello protocol. The Hello protocol includes three sub-protocols: Sequence Initialization Protocol, Sequence Detection and Maintenance Protocol, and Check Unknown Vehicle Status Protocol. Using these sub-protocols, the Hello protocol can achieve two goals: (i) identifying the immediate front and back vehicles
13
Algorithm 1 InitializeSequence 1: Vehicle i broadcasts a Type-0 Hello
Table 1: Hello Packet Format Packet fields T ype
Description
Packet through both directional antennas. If vehicle j receives the Hello request, it needs to send a Type-1 Hello response 2: Set findVehicleFlag=1; 3: Wait a time interval ∆t to receive Hello response packets; 4: for all Received HPj do 5: if Packet received from front transceiver and CheckUnknownVehicleStatus(j) == “Vehicle in the same lane” then 6: Add the vehicle id j and its details to the front of position i in the table Fi ; 7: |Fi |+ = 1; 8: |Seq(i)|+ = 1; 9: Update Seq(i) with entries from Seq(j) 10: Set findVehicleFlag=1; 11: else if CheckUnknownVehicleStatus(j) == “Vehicle in the same lane” then 12: Add the vehicle id j and its details to the rear of position i in the table Bi ; 13: |Bi |+ = 1; 14: |Seq(i)|+ = 1; 15: Update Seq(i) with entries from Seq(j) 16: Set findVehicleFlag=1; 17: else 18: findVehicleFlag=0; 19: end if 20: end for 21: if findVehicleFlag==1 then 22: Enter SequenceDetectionMaintenance procedure; 23: else 24: Restart the InitialSequence Procedure; 25: end if
Type 0
1
Type of packet, a 1-bit number. 0: Hello Request Packet, 1: Hello Reply Packet. IDi The source vehicle ID, e.g., i. It can x x be randomly chosen, however it must be consistent during the communications. IDj The destination vehicle ID. It can be x/u x a ID j or set to unknown. Seq(i) The sequence of vehicles maintained x/u x/u by i, Seq(i) = {Fi , Bi }, Fi is the front vehicle list and Bi is the rear vehicle list. Lane-pref j The lane preference measures the vex/u x/u hicle j on the same lane of i. It ranges from 0 to 1. d(i, i − 1) Distance between the vehicle i and x x its immediate front vehicle i − 1. d(i, i + 1) Distance between the vehicle i and x x its immediate rear vehicle i + 1. V el(i) Instant velocity of i measured by i. x x V eli (j) Instant velocity of vehicle j measured x x by vehicle i Di The time measuring lapse of d(i, i + x x 1), d(i, i − 1), V el(i), and V eli (j). x: a deterministic value; u: unknown; x/u: either deterministic or unknown.
and (ii) maintaining the sequence of vehicles in the same lane. The second phase is shock-wave detection and propagation, which is based on the vehicle sequence derived from the first phase. It contains two processes: shock-wave detection and wave information dissemination. Based on the detected shock waves, each vehicle can detect congestions and estimate the congestion length and time. The Hello protocol, wave detection and propagation, and congestion detection will be described in Sections 4, 5, and 6, respectively.
packet and Type-1 Hello response packet. By default, every vehicle sends a Type-1 packet periodically. On special occasions such as Hello initialization, dramatic measurement changes of inter-vehicle distance and velocities, a Type-0 request packet will be sent.
4.2
Vehicle Sequence Initialization
Initially, vehicles do not have any knowledge of vehicle sequence on the same lane, and they can only measure the velocities and distances of the front and the rear vehicles. Let i be a vehicle traveling on a road. Let Bi be a set of vehicles following the vehicle i and let Fi be a set of vehicles in front of the vehicle i. Initially Bi and Fi are empty sets. The InitializeSequence protocol is presented in Protocol 1, where vehicle i initiates a Type-0 Hello request packet to its front and rear neighbors. Vehicles receiving these packets, say for instance, vehicle j, will send Type-1 Hello response packet HPj to i. For every packet received by i, it performs the CheckUnknownVehicleStatus protocol, which is presented in Protocol 2, to determine whether the replying vehicle j is in the same lane or not. Furthermore, if there is any sequence information in the packet sent by j, i updates its own maintained sequence table SequenceT able(i) with this information (which will be described in Section 4.3). Once the vehicle has finished processing all its received Hello response packets and determined its front and back vehicles, it switches to the SequenceDetectionMaintenance protocol. The CheckUnknownVehicleStatus procedure determines the status of a new vehicle j encountered by i. V el(i) and V el(j) are the actual velocities of vehicle i and j, respectively; and V elj (i) and V eli (j) are the velocity of i measured by j and the velocity of j measured by i, respectively. In this procedure, a neighboring vehicle j associates a confidence factor Lane − prefj , which is up to a predefined value counterThreshold, for vehicle i to determine how confident j is in
3.4 Security and Privacy Considerations Our protocols require that each vehicle broadcasts its IDs, measured velocities, inter-vehicle distance, and corresponding time lapse of measurements. To provide pseudonymity and data verifications in vehicular networks have been studied extensively in current literature. Due to page limits, this paper assumes that all vehicles are honest speakers and we do not address related security and privacy issues.
4.
HELLO PROTOCOL In our presented communication model, vehicles need to send their IDs and velocity and space measurements of their neighboring vehicles. One of research challenges is how to identify vehicles detected by front and back radars with the corresponding received IDs transmitted from arbitrary vehicles. Hello protocol is designed to help a vehicle to detect and monitor other vehicles on the same lane. As described in Figure 4, Hello protocol is formed by three sub-protocols. We discuss each of the sub protocols in details.
4.1
Hello Packet The Hello packets are periodically sent by vehicles using front and back transmitters. In case of encountering a road event such as a merge, the Hello procedure can be triggered. The packet format and explanations are presented in Table 1. Each packet field is illustrated in the table. There are two types of Hello packets - Type-0 Hello request
14
Algorithm 2 CheckUnknownVehicleStatus
ing its sequence measure to its front and rear vehicles; if a Hello packet is received from a non-adjacent vehicle j, i needs to update its sequence table; or if a Hello packet is received from an adjacent vehicle j, it needs to check the velocity and distance using CheckUnknownVehicleStatus protocol, and then updates SequenceT able(i); or it removes j from its SequenceT able(i) if the previous two conditions do not match.
Require: HPj with Type-1 of unknown vehicle 1: if V eli (j) ≈ V el(j) AND V elj (i) ≈ V el(i) AND d(j, i) ≈ d(i, j) then 2: Set counter = 0; 3: Set Lane − prej = counterT1hreshold ; 4: while counter ≤ counterT hreshold do 5: Send a Type-0 Hello packet to j; 6: Start waitT imer and set its expiration time to ∆t; 7: if At j, V elj (i) ≈ V el(i) AND V eli (j) ≈ V el(j) AND d(i, j) ≈ d(j, i) then 8: Vehicle j sets Lane − prefi + = counterT1hreshold ; 9: Vehicle j sends a Type-1 Hello response packet; 10: else 11: Vehicle j sets Lane − prefi − = counterT1hreshold ; 12: Vehicle j does not send the Type-1 Hello Packet; 13: end if 14: if i receives a Type-1 HPj from j before waitT imer expires AND V eli (j) ≈ V el(j) AND V elj (i) ≈ V el(i) AND d(j, i) ≈ d(i, j) then 15: Vehicle i updates Lane − prefj + = counterT1hreshold ; 16: else 17: Vehicle i updates Lane − prefj − = counterT1hreshold ; 18: end if 19: counter+ = 1; 20: end while 21: if Lane − prefj ≥ threshold then 22: Vehicle i returns status “Vehicle j in lane confirmed”; 23: Vehicle i sends a notification to stop the checking procedure and vehicle j can decide its sequence; 24: else 25: Vehicle i returns status “‘Vehicle j in another lane”; 26: end if 27: else 28: Return Status “Vehicle j in another lane”; 29: end if
4.3
Sequence Tables Format and Updates
Each vehicle, such as i, needs to maintain the vehicle list Seq(i), and the inter-vehicle distances derived from Hello packets using Protocols 1-3. If the inter-vehicle distance changes suddenly and the change is over a threshold, e.g., 0.5 ∼ 1 meter (most of existing distance measurement devices have a measuring error that is about 0.5 meters), a T ype-1 Hello packet will be triggered. Other vehicles can update their SequenceT able(i) accordingly to maintain the most recent distance and velocity measurements. In this way, i can compute and estimate the most recent intervehicle distance and velocity for any one in Seq(i).
5.
SHOCK-WAVE DETECTION AND PROPAGATION
In this section, we describe how to detect shock-wave, and the dissemination of wave packets in vehicular networks.
5.1
Types of Shock Waves
Based on studies in [4], shock waves are usually caused by road events such as vehicle merges, diverges, traffic controls (such as road constructions), and accidents. Among these road events, our research focuses on the congestions caused by vehicle merges and accidents (or constructions), which commonly happen on highways.
the same lane. i examines the velocities and distances from HPj with its own measured velocities and distances. If it finds the values to be similar, within a given error limit, it goes into a loop requesting more packets from j for a specific time period ∆t; if it finds the measured values to be largely different, it reduces the Lane − prefj value. At the same time, j will also perform the same procedure to evaluate its Lane − prefi value. At the end of the loop, if Lane − prefj crosses a threshold, i decides that j is in the same lane. It then sends a notification to j to stop the procedure and updates its sequence table SequenceT able(i) to include j in the right sequence.
i
i+1 j+2
Algorithm 3 SequenceDetectionMaintenance
j+2
Require: A Type-0 Hello packet is sent periodically or is triggered by dramatic changes (i.e., over a certain threshold) of inter-vehicle distance to front or rear vehicles, or a Type-1 packet HPj is received. i performs the follows: 1: if j presents in SequenceT able(i) AND j is not adjacent to i then 2: Performs an update on SequenceT able(i) to include j; 3: Creates a Type-1 Hello packet HPi ; 4: Broadcasts HPi to Fi and Bi ; 5: else if j presents in SequenceT able(i) AND j is adjacent to i AND CheckUnknownVehicleStatus(j)== “vehicle j in the same lane” then 6: Performs an update on SequenceT able(i); 7: Sends HPi to Fi and Bi ; 8: else 9: Removes j from SequenceT able(i); 10: end if
i-1 j
j+1
j+1 i+1
j i
i-1
Figure 5: Examples of continuous shock waves. In a road system, we can classify shock waves in two groups: (a) occasional waves, and (b) continuous waves. As shown in Figure 5, continuous waves are created by a sequence of wave sources, e.g., a long sequence of vehicles merging into the road through a ramp or blocked lane. On the other hand, occasional waves usually do not create long congestions.
5.2
The SequenceDetectionMaintenance protocol is to maintain the vehicle sequence, which is shown in Protocol 3. The logic of SequenceDetectionMaintenance protocol is illustrated as follows: vehicle i sends a Type-0 packet includ-
Shock Wave Detection
By sensing sudden changes of distance and velocity of the leading or following vehicle, a vehicle can detect a merge or diverge event. Using the CheckUnknownVehicleStatus
15
(iii) triggers the Hello procedure to maintain a new vehicle sequence.
protocol, the vehicle can monitor the adjacent vehicles’ velocities and distances during a sequence of time intervals to exclude scenarios such as vehicles travel on curves and cause sudden distance changes when sensing other vehicles on different lanes, or vehicles merge in a lane and then leave the lane quickly. Thus, detecting the start of a shock wave depends on measures of merging vehicles into a lane for a relatively longer time period, which is set by the parameter counterT hreshold × ∆t in the CheckUnknownVehicleStatus protocol. To compute the speed of a shock wave, we utilize formulas (1), (2), and (3), and then derive the following results: q(td ) − q(tu ) k(td ) − k(tu ) 1 ∑ 1 ∑ vd (l) − vu (l) Lu Ld
The procedure (iii) has been described in Section 4. The procedure (i) is straightforward and the distance measure must not include the new merged vehicle j, which makes the measure only contain the pre-merging state of the road system. For the procedure (ii), we first need to describe the wave packet format shown as follows:
Packet fields wID
w=
l∈Nd
=
l∈Nu
|Nd | |Nu | − Ld Lu
0,
,
IDi F − bit B − bit V alu
|Nd | |Nu | − ̸= 0; Ld Lu
V ald w Du : Dd : wID list: h:
otherwise. (4)
In (4), td and tu represent the measurements at downstream and upstream, respectively. Based on the shock waves presented in Figure 3, we use V alu = ⟨Lu , Nu , vu (l)[l ∈ Nu ], Du ⟩ to represent the upstream values and V ald = ⟨Ld , Nd , vd (l)[l ∈ Nd ], Dd ⟩ to represent the upstream (with subscript u) and downstream (with subscript d) measures by vehicle i with measure-transmission delay Du and Dd , respectively. V alu is the measure before detecting a shock wave and V ald is the measure after detecting the shockwave. Ld and Lu are corresponding to the distance measurements between i − 1 and i + 1 for downstream and upstream, respectively. The number of vehicles |Nu | or |Nd | equals to the number of vehicles within the neighboring vicinity on the same lane, which can be 1, 2, or 3 including the vehicle i itself. Finally, the vehicle i can detect the Stable Flow State velocity before (i.e., vu (l) where l ∈ Nu ) and after (i.e., vd (l) where l ∈ Nd ) detecting the shock wave. We will describe the concept of Stable Flow State in Section 5.3.2.
Shock Wave Packet Description A unique number selected by the leading vehicle at the wave head. Sending vehicle ID i. Front merge indicator: 1, true; 0, false. Back merge indicator: 1, true; 0, false. Upstream values ⟨Lu , Nu , vu (l)⟩, l can be i − 1 , i, or i + 1. Downstream values ⟨Ld , Nd , vd (l)⟩, l can be i − 1 , i, or i + 1. Wave velocity computed using (4). The measure-transmission delay of V alu . The measure-transmission delay of V ald . A list of merged wave IDs. Vehicle sequence hop count to the wave initiating vehicle: initial value is 0, increased by 1 for each hop.
In the wave packet, wID is chosen by the leading vehicle at the wave head (see Figure 5). F − Bit and B − bit are used to identify the merge positions: front or/and back of vehicle i. In order to inform the following vehicles as soon as the leading vehicle detects a merge, the wave packet can leave the following field empty: V ald , w, and Dd . These values can be measured and sent latterly through a separate wave packet. Finally, the wID list contains a list of merged waves. This wave list can help the following vehicles to compute the wave velocity accurately when multiple waves occurred simultaneously, and then create single shock wave effect. The detailed wave packet generation and propagation will be addressed in Section 5.4.
5.3.2
How to decide the ending time of wave detection (td )
As shown in Figure 3, the shock wave propagation separates movements of vehicles from a Stable Flow State qu to another Stable Flow State qd . The measurements of leading and following vehicles’ velocities can be used to identify a Stable Flow State. We notice that using velocity as the flow state measurement metric is a better choice than using intervehicle distance. This is because vehicle drivers usually have different experience of safe driving distance. However, the relative moving velocity in the car following model is usually stable when vehicles entering a Stable Flow State. To identify a Stable Flow State, we use the following two metrics for the measuring vehicle i:
5.3 Handling Shock Waves Using (4) to compute the shock wave speed, we need to address several critical implementation issues for a vehicle to decide: (1) how to detect the starting time of a shock wave tu , (2) how to decide the ending time of the wave td , and (c) how to handle multiple simultaneous merges and/or leaves. We address each of these issues in the rest of this subsection.
5.3.1 How to detect the starting time of a shock wave (t u ) In Figure 5, we present two common shock-wave creation scenarios for congestion creations in highways, where both scenarios are caused by vehicle merges. In both scenarios, a vehicle i can sense velocity and distance changes of adjacent vehicles due to merging vehicle j’s interruption. During the merge, i needs to perform the following actions:
vˆu/d = α|vi (i − 1) − v(i)| + (1 − α)|v(i) − vi (i + 1)|,
(5)
where the subscript u/d means that the measurement is for upstream or down stream, α is a scalar in the range of [0, 1]. If the leading vehicle is not present, α = 0 and if the rear vehicle is not present α = 1. If both leading and rear vehicles are present, α is greater than 0.5 based on our experiments, which means we consider more on the measurements with respect to the leading vehicle. This is because the following vehicle needs a little more time to entering the stable state.
(i) measures the values V alu = ⟨Lu , Nu , vu (l)[l ∈ Nu ], Du ⟩, where Lu equals to the distance from i − 1 to i + 1; (ii) sends a wave packet to Bi ; and
16
To decide if the traffic flow is in a stable state, we use the following decision metric: |ˆ vu/d (i − 1) − vˆu/d (i)| ≤ vˆT .
(i) shock waves have not determined their wave speed; (ii) the initial locations of shock waves are within H hops.
(6)
The second scenario in Figure 6 describes a variation of the first scenario, in which the following vehicle detects the merge of w1 first, and then it receives a second wave initiation packet of w2 from the leading vehicle. In this case, the following vehicle can still follow the wave merge condition and generates a new updated wave initiation packet w′ 2 that merges w1 and w2. When the wave generation locations are far from each other, we can enforce that the wave merges can only happen within H hops based on the information maintained in the vehicle sequence table. Usually, we can set H ≤ 3, which means the wave merges only happen in a close vicinity.
In (6), vˆu/d (i − 1) can be computed using the information stored in the SequenceT able(i), which is described in Section 4.3. Satisfying the inequality condition (6), we call the vehicle i is in a Stable Flow State. Once (6) is satisfied, i can compute the corresponding V ald and then compute shock wave w. To compute w, the distance Ld is computed based on the distance between vehicles i − 1 and i + 1, which is computed between new vehicles merged into the lane for downstream measurements.
5.3.3 How to handling multiple simultaneous merges and/or leaves
5.4
When there are multiple vehicles merged into the same lane within a relatively short time period (i.e., the time period is less than w/d, where d is the distance between two merged vehicles), we should consider the multiple merges a single merge. This means that the overall effect is equivalent to a single merge. Multiple merges can be naturally handled using the Stable Flow State condition (6), which is used to determine the wave detection ending time td . This is because multiple merges in a short time period and within a small space will transfer the traffic flow into an instable flow state. In the following context, we present an illustrative example for wave merges, which is shown in Figure 6. Combined wave initiation packets
w2 wave head
w1 wave head w1,t1
w2,t2
Traffic direction Combined wave initiation packets
w1 wave head
w’2,t3 w1,t1
Propagation of Wave Packets
A wave packet is propagated using broadcasting, which is propagated to direct communication neighbors using directional antennas. A wave packet receiver processes the received wave packets, generates a new wave packet by updating new measured values, updates the vehicle sequence hop count h, and then broadcasts it to the upstream vehicles. As we have already presented: once a merge is detected, the initiation wave packet must be sent immediately by the leading vehicle at the wave head, where the initiation wave packet may only contain information of WID , IDi , F − bit, B − bit, V alu , and Du . The initiation wave packet can help the following vehicles to differentiate multiple waves originated from different wave sources. Moreover, the initial wave packet can also help vehicles to merge multiple waves to one if these waves occur simultaneously, and thus create a single shock wave effect. The second phase of wave propagation process is straightforward. Due to the physical nature of a congestion shock wave is propagated from its wave head towards the upstream vehicles, we can simply requires each vehicle to compute the wave speed using (4) to derive a local wave speed wi′ . If wi′ is negligible, usually less than 0.5m/s, the vehicle i can stop the wave computation by sending a wave elimination message (i.e., the wave speed is set to 0) to the upstream vehicles. Otherwise, the vehicle needs to incorporate the wave computations from downstream vehicles and compute the arithmetic average of the wave speed as follows:
w2 wave head w2,t2 Traffic direction
Figure 6: Illustration of wave merges. In the first scenario, the leading vehicle initiates a wave packet w1, which does not include the wave speed, when it detects a merge at time t1. The following vehicle also detects a merge at time t2 before it receives the wave packet containing wave speed of w1 from the leading vehicle. Then, the following vehicle needs to merge w1 and w2, and includes the wave w1’s ID in the w2’s packet. In this way, the upstream vehicles who may have already received the initiation packet of w1 can update their wave packet list accordingly. In the figure, the absolute values of t1 and t2 cannot be computed. This is because we do not assume a time synchronized mechanism among vehicles. However, wave merges can be easily determined by checking if the following vehicle detects the new wave w2 before receiving a wave packet from the leading vehicle with wave speed of w1, and downstream values V ald . This decision can be naturally handled by using the approach to determine the wave ending td presented in the inequality condition (6). Thus, we can address the wave merge condition as follows: If the system does not reach a Stable Flow State, we can always combine shock waves based on the following two conditions:
wi =
w′ h ( i + wi−1 ), h+1 h
(7)
where h is the vehicle sequence hop count from the wave head, and wi−1 is the wave computed from the leading vehicle i − 1.
6.
CONGESTION PREDICTION
In this Section, we present how to use the proposed protocols to predict traffic congestions including congestion time and distance. Newell proposed a simplified Kinematic wave theory in [8, 9], which has become the standard tools for analysis of highway traffic, especially queue formation and propagation and bottleneck analysis. This theory enabled approximation of differential equations of fluid-dynamic theory with negligible loss of accuracy and also avoids mathematical nuisances with the use of triangular fundamental diagram. As shown
17
x
q
j
Bottleneck (BN)
q max
A
vf (x2,t2)
B vf C
C
A
k D kop
kC
wave packet
vC A
kj k
uncongested congested (a)
∆tl Traffic flow
Congestion
vC zone
B
(x1,t1)
d(i,j)
q BN D
Practically, a vehicle can periodically plot the triangular using the flow-density triangular curve to track its congestion state. In Figure 7 (b), we present a bottleneck scenario to illustrate our approach. Assume that i receives a wave speed packet sent by j with time lapse D = ∆tl , where i and j may not be adjacent vehicles. i can estimate the distance d(i, j) from its maintained SequenceT able(i). We can compute ∆tl = Du + (Dd − Du )/2 = (Du + Dd )/2, where Du and Dd are measurements of delay in the received wave packets. Now, we present how vehicle i estimates the travel time (∆td ) to the congested zone, the time estimation to travel through the congested zone (∆tr ), the travel distance to the congested zone (x1 ), and the travel distance within the congested zone (x2 − x1 ).
i
D
w
vf ∆td
t
∆tr
(b)
Figure 7: (a) Newell’s triangular model. (b) Congestion detection and prediction using shock wave model. Notations: A, B, C, and D are four flows and density scenarios; qmax is the maximum flow; vf is the mean free flow speed; kop is the optimal density; kj is the jam density (where flow is almost zero); w is the velocity (negative) moving against the flow during congestion, i.e., shock wave; d(i, j) is the distance between i and j at when j transmits a wave packet; ∆tl is the time lapse from the originating the wave packet to receiving the wave packet by i, ∆td is wave travel time from j to i, and ∆tr is the time interval for i traveling within the congested zone.
x1
=
d(i, j) , vˆu − w w(∆tl + ∆td ) , vˆd d(i, j) − w∆td ,
x2 − x1
=
d(i, j) + w∆tl .
∆td
=
∆tr
=
(10) (11) (12) (13)
In (10), vˆu is the speed measured by i using (5); in (11), vˆd can take the speed value from received wave packets. To improve the accuracy of estimates, the vehicle can take the average value of (10)-(13) when receiving multiple wave packets.
in Figure 7 (a), it depicts the triangular model of Newell’s flow model, where the points (A, B, C, and D) on the diagram describe four different traffic conditions (or “steady states”), where the notations of symbols are provided in the caption of Figure 7. In the optimal scenario, vehicles can travel on a highway by the speed of vf with density of kop . The density zone [0, kop ] with mean speed vf is called uncongested zone. On a highway, it is easy for a vehicle to recognize if it travels within the uncongested zone by simply monitoring if the vehicle travels within the speed limits without detecting shock waves from far downstream vehicles (the short-live waves caused by occasional merges can be eliminated by wave elimination messages). The speed limit information can be broadcasted by roadside units when the vehicle entering a road segment. In the figure, along the triangle, if the density pass kop , the traffic enters the congested zone, where the traffic flow decreases and density increases. Thus, although C and D have the same flow rate, their densities are different. In our model, entering congestion zone can be detected by a vehicle i using the following congestion indicators:
7.
PERFORMANCE EVALUATION
2. The density function that is computed using intervehicle distance of vehicles in its front vehicle sequence list up to j, Fi (j): ∑ 1 ˆ= k d(l, l − 1); (8) |Fi (j)|
In our performance studies, we use two simulation packages, Simulation of Urban Mobility (SUMO) [22] to simulate the vehicular mobility on highways and Network Simulator-2 (NS-2) to simulate the Hello protocol and the wave detection and propagation protocol. The Hello message is encapsulated in a MAC packet. In our simulation, we use 802.11 MAC protocol. The performance evaluation can be used to represent three different traffic congestion scenarios - (i) Road Merge Scenario: merging of two roads into one road. (ii) Accident Scenario: a two-lane road, and an accident on a part of one lane, so that vehicles on that lane divert to another lane. (iii) Freeway with Incoming Ramp: a freeway with an incoming ramp. We simulate two different settings with corresponding free travel velocity and congested travel velocity: (a) 30m/s (72mi/h) and 2m/s (4.8mi/h), and (b) 30m/s (72mi/h) and 15m/s (36mi/h), within 30 meters. Scenario (a) represents a fast velocity reduction, while scenario (b) represents a slow velocity reduction. Based on the simulation setup, we compute the values to be used in determining wave detection parameters, such as α. We also compute the wave propagation speed, congestion distance and length, etc. We will compare the results derived based on the proposed protocols and formulas with the actual values derived from the simulation trace files.
3. The flow rate is computed using (5):
7.1
1. The detection of shock waves initiated by j.
l∈Fi (j)
ˆ qˆ = vˆu/d k;
Determine Stable Flow State
In our proposed wave detection protocol, determining the stable flow state is the key issue for a vehicle to compute the wave speed. As given in (5), we introduce α to weight the velocity difference measures from the front and back vehicles. Using (6), a vehicle can determine the transition from one stable flow state to another.
(9)
Although, the values computed using (5) and (8) are estimated values due to time lapse of distance and velocity measures, they are good indicators for congestion detection.
18
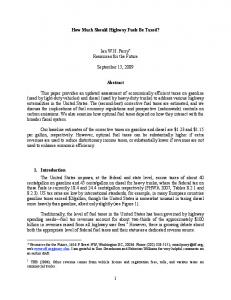
Figure 8: α and stable flow states for maximum velocity=30m/s and minimum velocity=15m/s. In Fig. 8 (upper graph), we monitor four vehicles moving velocities when they traveling into a congested area using the simulation setting (a. It shows that the velocity of each vehicle is reduced from 30m/s to 15m/s when it entering the congested area. We must note that using (5), for vehicle i, the velocity measurements of i − 2, i − 1, i, and i + 1 are required. Based on the velocity changing curve in Fig. 8 (upper graph), the transition spans about 9 seconds from t = 83 to t = 91. In Fig. 8 (lower graph), we present the threshold computations of using (6) with different values of factor α (from 0.1 to 0.9). It shows that the curve is smooth when α is approximate to 0.5. This plot can help us to determine the best threshold value used in (6). For example, if we set α = 0.5, we can set the threshold vˆT = 1m/s. However, the threshold value for α = 0.9 will far below 1m/s since the lowest point of α = 0.9 curve between the transition time interval is lower than 0.5m/s.
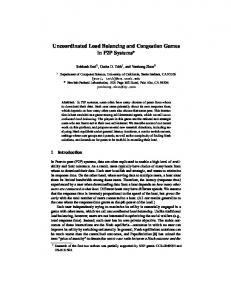
Figure 9: (Upper) Trajectories of vehicles in timespace domain, where velocity is reduced from 30m/s to 2m/s in a 30-meter congested zone. (Lower) Trajectories of vehicles in time-space domain, where velocity is reduced from 30m/s to 15m/s in a 30-meter congested zone.
7.2 Shock Wave Velocity In Fig. 9 (a) and (b), we plot the trajectories of vehicles in time-space domain for testing scenarios (a) and (b), respectively. We notice that the shock wave propagates faster towards the upstream direction for testing scenario (a) than that of testing scenario (b). In scenario (b), the wave velocity cannot be easily visualized, where the velocity reduction happens at 900 meters. The presented results confirm the spontaneous behaviors of vehicles traveling on highways, i.e., if the velocity of the leading vehicle reduces faster (30m/s to 2m/s vs 30m/s to 15m/s), the following vehicle will respond quicker to the velocity change of the leading vehicle. As the result, the shock wave travels faster towards the upstream direction. In Fig. 10, we present the wave velocities of detected by seven vehicles using (4) vs. the actual shock wave velocities of these vehicles on the road when vehicles’ velocity is dropped from 30m/s to 2m/s. The results show that our approach is a good estimation of actual shock wave velocity.
Figure 10: Wave velocity measurements. odic transmissions of Hello packets and wave packet propagation. Based on the presented procedure of Hello protocol and wave packet propagation, the communication overhead of Hello procedure is O(|Seq(i)|) for detecting the vehicle sequence on the same lane when i sends a Hello request, i.e., the communication overhead is linearly proportional to the length of vehicle sequence maintained by i. The number of transmitted packets includes both the Hello request and corresponding responses. The communication overhead of wave propagation is O(B) when the wave head vehicle i generate a wave packet where B is the number of vehicles following the vehicle i on the same lane, who detect the same wave and each of them generates a new wave update packet.
7.3 Congestion Prediction In Fig. 11, we plot the congestion predictions of a randomly select vehicle comparing with actual congestion values. For this vehicle, it computes the congestion prediction values using the Equations (10) - (13). We have verified other vehicles and observed that they all exhibit the similar properties, which prove the correctness of our solution.
8.
CONCLUSION AND FUTURE WORK
We present a novel congestion detection and prediction approach using Kinematic shock waves. Our approach does not rely on a centralized traffic monitoring entire transportation system to observe and predict traffic congestions. In-
7.4 Communication Overhead The major communication overhead is caused by the peri-
19
[9] ——, “A simplified theory of kinematic waves in highway traffic, Part II: Queueing at freeway bottlenecks,” Transportation Research Part B Methodological, vol. 27, pp. 289–289, 1993. [10] United States Government Accountability Office (GAO), Highway Congestion: Intelligent Transportation Systems’ Promise for Managing Congestion Falls Short, and Dot Could Better Facilitate Their Strategic Use. DIANE Publishing, 2005. [11] J. Rybicki, B. Scheuermann, M. Koegel, and M. Mauve, “PeerTIS: a peer-to-peer traffic information system,” in Proceedings of the sixth ACM international workshop on VehiculAr InterNETworking. ACM, 2009, pp. 23–32. [12] W. Pattara-atikom, R. Peachavanish, and R. Luckana, “Estimating road traffic congestion using cell dwell time with simple threshold and fuzzy logic techniques,” in Proceedings of the IEEE Intelligent Transportation Systems Conference, 2007, pp. 956–961. [13] P. Pongpaibool, P. Tangamchit, K. Noodwong, and K. NECTEC, “Evaluation of road traffic congestion using fuzzy techniques,” in Proceedings of IEEE Region 10 Conference (TENCON), 2007, pp. 1–4. [14] F. Porikli and X. Li, “Traffic congestion estimation using HMM models without vehicle tracking,” in Proceedings of IEEE Intelligent Vehicles Symposium, 2004, pp. 188–193. [15] “Gps wikipedia,” Available at http: //en.wikipedia.org/wiki/Global Positioning System# Error sources and analysis. [16] C. Chigan, R. Bandaru, and J. Li, “RPB-MACn: A Relative Position Based Collision-free MAC Nucleus for Vehicular Ad Hoc Networks,” in Proceedings of IEEE Globecom, 2006. [17] C. Cseh, “Architecture of the dedicated short-range communications (DSRC) protocol,” IEEE Vehicular Technology Conference (VTC), vol. 3, pp. 2095–2099 vol.3, May 1998. [18] J. Yin, T. ElBatt, G. Yeung, B. Ryu, S. Habermas, H. Krishnan, and T. Talty, “Performance evaluation of safety applications over DSRC vehicular ad hoc networks,” in Proceedings of the 1st ACM international workshop on Vehicular ad hoc networks. ACM, 2004, pp. 1–9. [19] K. Takano, T. Monji, H. Kondo, and E. Otsuka, “Environment Recognition Technologies for Supporting Safe Driving,” Hitachi Review, vol. 53, no. 4, p. 217, 2004. [20] T. Yamawaki, S. ichi Yamano, Y. Katogi, T. Tamura, and Y. Ohira, “Millimeter-Wave Obstacle detection Radar,” Fujitsu Ten Technical Report, NO 15, Tech. Rep., 2000. [21] M. Lighthill and G. Whitham, “On kinematic waves. II. A theory of traffic flow on long crowded roads,” Proceedings of the Royal Society of London. Series A, Mathematical and Physical Sciences, pp. 317–345, 1955. [22] “SUMO - Simulation of Urban MObility,” http://sumo.sourceforge.net/.
Figure 11: Congestion measures using Equations (10) - (13) vs actual values. stead, our approach relies on local observations of vehicles on the road. This is very useful for the scenarios where congestions happen in rural area due to constructions or accidents. Our performance evaluation shows that the proposed approach is accurate and communication efficient. Besides the protocol design, we will investigate other traffic patterns, such as stop-and-go traffic oscillations and device corresponding wave detection models for congestion prediction. Moreover, we will explore the possible integration of the hello message within the beacon message (802.11p) to reduce the communication overhead. Furthermore, we will apply our research using real traffic trace to demonstrate its correctness. Finally, security issues of the proposed research need to be carefully studied in the future.
Acknowledgement The authors would like to thank anonymous reviewers comments. A special thank to Dr. Tamer ElBatt for his valuable suggestions. The presented work is supported by ONR-YIP award.
9. REFERENCES [1] News story, “Virginia: Traffic Cameras Fail to Reduce Congestion,” http://www.thenewspaper.com/news/10/1012.asp. [2] M. Cassidy and J. Rudjanakanoknad, “Increasing the capacity of an isolated merge by metering its on-ramp,” Transportation Research Part B, vol. 39, no. 10, pp. 896–913, 2005. [3] R. Bertini and M. Leal, “Empirical study of traffic features at a freeway lane drop,” Journal of Transportation Engineering, vol. 131, p. 397, 2005. [4] S. Ahn and M. Cassidy, “Freeway Traffic Oscillations and Vehicle Lane-Change Maneuvers,” in Proceedings of the 17th International Symposium on Traffic and Transportation Theory, 2007, pp. 691–710. [5] M. Lighthill and G. Whitham, “On kinematic waves. I. Flood movement in long rivers,” Proceedings of the Royal Society of London. Series A, Mathematical and Physical Sciences, pp. 281–316, 1955. [6] ——, “On kinematic waves. II. A theory of traffic flow on long crowded roads,” Proceedings of the Royal Society of London. Series A, Mathematical and Physical Sciences, pp. 317–345, 1955. [7] P. Richards, “Shock waves on the highway,” Operations research, pp. 42–51, 1956. [8] G. Newell, “A simplified theory of kinematic waves in highway traffic, Part I: General theory,” Transportation Research Part B Methodological, vol. 27, pp. 281–281, 1993.
20