We have used Hall sensor arrays to measure the ..... harmonic measurement by the lock-in amplifier Fourier transforms the sharp instantaneous. Jc(x, t) of Fig.
arXiv:cond-mat/9912157v1 [cond-mat.supr-con] 9 Dec 1999
Dynamic instabilities and memory effects in vortex matter
Y. Paltiel∗ , E. Zeldov∗,† , Y. N. Myasoedov∗ , H. Shtrikman∗ , S. Bhattacharya‡,§ , M. J. Higgins‡ , Z. L. Xiao¶ , E. Y. Andrei¶ , P. L. Gammel† , and D. J. Bishop†
∗ Department
of Condensed Matter Physics, The Weizmann Institute of Science, Rehovot 76100, Israel
† Bell ‡ NEC
Laboratories, Lucent Technologies, Murray Hill, New Jersey 07974, USA
Research Institute, 4 Independence Way, Princeton, New Jersey 08540, USA § Tata
¶ Department
Institute of Fundamental Research, Mumbai-400005, India
of Physics and Astronomy, Rutgers University, Piscataway, New Jersey 08855, USA
1
Understanding the nature of flow is essential for the resolution of a wide class of phenomena in condensed matter physics, ranging from dynamic friction, through pattern formation in sand dunes, to the pinning of charge density waves. The flux line lattice in type II superconductors serves as a unique model system with tunable dynamic properties. Indeed, recent studies have shown a number of puzzling phenomena including: (i) low frequency noise1–5 , (ii) slow voltage oscillations3,6 , (iii) history dependent dynamic response7–12 , (iv) memory of the direction, amplitude, duration, and even the frequency of the previously applied current13,14 , (v) high vortex mobility for ac current with no apparent vortex motion at dc current13,15,16 , and (vi) strong suppression of an ac response by small dc bias13 . Taken together, these phenomena are incompatible with the current understanding of vortex dynamics. By investigating the current distribution across single crystals of 2H-NbSe2 we reveal a generic mechanism that accounts for these observations in terms of a competition between the injection of a disordered vortex phase at the sample edges, and the dynamic annealing of this metastable disorder by the transport current. For an ac current, only narrow regions near the edges are in the disordered phase, while for dc bias, most of the sample is filled by the pinned disorder, preventing vortex motion. The resulting spatial profile of disorder acts as an active memory of the previous history. In
conventional
superconductors
like
NbSe2
the
anomalous
phenomena
are
found1,2,7–11,13–15 in the vicinity of the ‘peak effect’ where the critical current Ic increases sharply below the upper critical field Hc2 , as described in Fig. 1a. The peak effect marks a structural transformation1,2,7–11,17 of the vortex lattice: Below the peak region an ordered phase (OP) is present, which is dominated by the elastic energy of the lattice and is, therefore, weakly pinned. On approaching the peak region, however, the increased softening of the lattice causes a transition into a disordered vortex phase (DP), which accommodates better to the pinning landscape, resulting in a sharp increase in Ic . In high-temperature superconductors like Bi2 Sr2 CaCu2 O8 , this situation is equivalent to the second magnetiza2
tion peak18 , where the ordered Bragg-glass phase is believed to transform into a disordered solid19–21 . Figure 1a shows the Ic measured at various frequencies. On the high temperature side of the peak effect Ic is frequency independent; in this region the DP is thermodynamically stable. In contrast, on the low temperature side, a significant frequency dependence is observed13,15 ; in this region all the unusual vortex response phenomena appear1,2,7–11,13–15 . As described below, a dynamic coexistence of the OP and a metastable DP is established in this region in the presence of an applied current. We first outline the proposed mechanism, and then present the experimental evidence. The first important ingredient of the proposed model is the observation that in NbSe2 the DP can be readily supercooled to below the peak effect by field cooling, where it remains metastable, since the thermal fluctuations are negligible8–11 . This supercooled DP is pinned more strongly and displays a significantly larger critical current Jcdis as compared to Jcord of the stable OP. An externally applied current in excess of Jcdis serves as an effective temperature and ‘anneals’ the metastable DP as observed by transport8 , magnetic response10 , decoration22 , and SANS experiments23 on NbSe2 . The second ingredient of the model is the presence of substantial surface barriers24 , as observed recently25 in NbSe2 . Consider a steady state flow of an OP in the presence of a transport current. In the standard platelet strip geometry, in a perpendicular field B, vortices penetrate from one edge of the sample and exit at the opposite edge. In the absence of a surface barrier, vortex penetration does not require any extra force. As a result, the vortices penetrate close to their proper vortex lattice locations, as dictated by the elastic forces of the lattice. In the presence of a surface barrier, however, a large force is required for vortex penetration and exit, and hence much of the applied current flows at the edges in order to provide the necessary driving force25–28 . The surface barrier is known to be very sensitive to surface imperfections. Therefore, the penetrating vortices are injected predominantly at the weakest points of the barrier, thus destroying the local order and forming a metastable DP near the edge, which drifts into the sample with the flow of the entire lattice. (Note that steps on the surface or extended defects in inhomogeneous samples could also act as 3
injection points of the DP). The applied current, therefore, has two effects: the current that flows at the edges causes ‘contamination’ by injecting a DP, while the current that flows in the bulk acts as an annealing mechanism. The observed dynamic instabilities and memory phenomena arise from the fine balance between these two competing processes. The annealing process is sensitive to the exact location on the H − T phase diagram. Below the peak effect, the DP is highly unstable and therefore its relaxation time τr in the presence of a driving force is very short. As a result, it anneals rapidly over a characteristic ‘healing’ length Lr = vτr , where v is the vortex lattice drift velocity. The corresponding profile of the local critical current Jc (x) should therefore decay from Jcdis to Jcord over the characteristic length scale Lr , as illustrated by the dotted line in Fig. 1b. Note that Lr and τr are generally current dependent and decrease dramatically at elevated currents8 . On the other hand, near the peak effect the free energies of the DP and OP are comparable and therefore the ‘life time’ of the disordered phase τr and the corresponding Lr are very large. As a result, the front of the DP, given by xd (t), progressively penetrates into the bulk as shown by the solid line in Fig. 1b, until the entire sample is contaminated. In this situation the experimental, steady state dc critical current Icdc does not reflect an equilibrium RW property, but rather a dynamic coexistence of two phases. It is given by Icdc = d 0 Jc (x)dx ≃ dLr Jcdis + d(W − Lr )Jcord for Lr < W , and Icdc ≃ Icdis = dW Jcdis for Lr ≫ W , where d and W are the thickness and width of the sample (neglecting, for simplicity, the surface barrier edge currents, and assuming, for example, an exponential decay of Jc (x) in Fig. 1b). The ac response of the system should be distinctly different since the contamination process occurs only near the edges, where the disordered lattice periodically penetrates and exits the sample. For a square wave Iac of period Tac = 1/f , by the end of the positive half cycle the DP occupies the left edge to a depth of xac d , as illustrated by the solid curve in Fig. 1b. During the negative half cycle the DP on the left exits the sample, while a DP on the right edge penetrates, until at t = Tac a mirror-image profile is obtained, as shown by the dashed line. Assuming xac d < W < Lr , the effective Ic observed by ac transport measurement dis ac ord is given by Icac ≃ dxac d Jc + d(W − xd )Jc . Thus, an ac current necessarily contaminates
4
the sample less than a dc current of the same amplitude, and therefore Icac ≤ Icdc always, as ac seen in Fig. 1a. In addition, since xac d decreases with frequency, Ic should decrease with f
explaining the frequency dependence of Icac in Fig. 1a. Furthermore, and most importantly, at sufficiently high frequency Icac should approach the true Ic of the stable phase. The steep increase of the 881 Hz Icac data in Fig. 1a (open circles) therefore indicates that the OP transforms sharply into the DP at the peak effect. In contrast, the smooth behavior of Icdc reflects rather the dynamic coexistence of the two phases in which Lr gradually increases and diverges upon approaching the peak effect from below. From Fig. 1a we can evaluate Lr and τr . For example, at T=5.1K, Icdc ≃ 50 mA is about half way between Icord ≃ 5 mA and the extrapolated Icdis ≃ 100 mA, which means that Lr ≃ 0.5W = 170µm. The Icdc was measured at a voltage criterion of 1 µV, which translates into vortex velocity of v ≃ 4 × 10⁻³ m/sec, and hence τr = Lr /v ≃ 4 × 10⁻² sec. This value is well within the range of the relaxation times measured previously8 by applying a current step to the field-cooled matastable DP. We now provide a direct experimental manifestation of the key aspect of the model, which is the spatial variation of the disorder and Jc (x), and of the transport current distribution that traces this Jc (x) (see Fig. 1b). We have used Hall sensor arrays to measure the ac transport current self-induced field25–27 Bac (x), which is then directly inverted into the current density distribution Jac (x) using the Biot-Savart law, as described previously25 (see inset to Fig 1a). Figure 2 shows the corresponding current profiles Jac (x) measured at different frequencies. At high f , the DP with the enhanced Jc is present only in narrow regions near the edges (481 Hz data). As the frequency is reduced, xac d grows and correspondingly the enhanced Jac (x) flows in wider regions near the edges. Note that our measurement procedure (see Fig. 2) provides the time averaged local amplitude of Jac (x), which is much smoother as compared to the sharp instantaneous profiles in Fig. 1b. We confirm the above finding independently by measuring the corresponding ac resistance of the sample Rac (f ) as shown in Fig. 3a. At high frequencies most of the sample is in the low pinning OP and therefore R is large. As f is decreased, progressively wider regions 5
near the edges become contaminated with the more strongly pinned DP and thus Rac (f ) decreases. If the applied Iac is larger than Icdc , a finite R will be measured at all frequencies, however, if Icac ≤ Iac ≤ Icdc (see Fig. 1a) the measured R will vanish as f → 0, as observed in Fig. 3a. This explains the surprising phenomenon of finite vortex response to ac current, while for dc drive the vortex motion is absent13,15,16 . From Rac (f ) one can directly calculate the width of the disordered regions by noting that xac d equals the distance the entire lattice is displaced during half an ac period, xac d (f ) = v/2f = R(f )Iac /2f LB, where L is the voltage contact separation. The open circles in Fig. 3b show xac d obtained from Rac (f ), while the open squares show the xac d derived directly from the Jac (x) profiles of Fig. 2. The good correspondence between the two independent evaluations of xac d demonstrates the self-consistency of the model. Next we address the extreme sensitivity of the ac response to a small dc bias13 , as shown in Fig. 4a, where Rac is presented as a function of a superposed Idc . A dc bias of only 10 to 20% of Iac suppresses Rac by orders of magnitude. This behavior is a natural consequence of the described mechanism since the dc bias contaminates the sample very similarly to the pure dc case, except that Lr is now renormalized as following. For Idc ≪ Iac , the vortices move back and forth during the ac cycle, with a forward displacement being larger by about 2Idc /Iac . Therefore, a vortex that enters through the sample edge and reaches a position x, accumulates a much longer total displacement path of xIac /Idc . Since the annealing process of the DP depends on the total displacement regardless of the direction, the lattice at this f ≃ Lr Idc /Iac . location is thus annealed substantially, as if the effective Lr is reduced to Lef r
Thus, at very small biases, the DP is present only within xac d from the edges, as in the absence of a bias, where the disordered vortices exit and re-penetrate every cycle. Vortices that drift deeper into the bulk under the influence of Idc are practically fully annealed due f to the very short Lef r . As a result in Fig. 4a the initial decrease of Rac up to Idc ≃ 2
mA is relatively small. The corresponding Jac (x) in Fig. 4b at Idc = 1.7 mA shows narrow contaminated regions near the edges, very similar to the zero bias case in Fig. 2. However, f as Idc is increased, Lef grows and the bulk of the sample becomes contaminated by the r
6
penetrating DP, leading to a dramatic drop of Rac . In this situation, Jac (x) at Idc = 5.7 mA shows a wide region of DP at the left edge. When Idc is inverted to -5.7 mA, a similar situation is observed, but now the vortices and hence the DP penetrate from the right edge, as expected. The revealed mechanism readily explains a wide range of additional reported phenomena: (i) The history of the previously applied current is encoded in the spatial profile of the lattice disorder, which is preserved while the current is switched off due to negligible thermal relaxation. Upon reapplying the current, the vortex system will display a memory of all the parameters of the previously applied current including its direction, duration, amplitude, and frequency, as observed experimentally13,14 . (ii) Application of a current step I < Icdc to a sample in the OP, results in a transient response which decays to zero since the DP is able to penetrate only a limited distance. The resulting new Ic of the sample is given by the condition that Ic = I, as derived by fast transport measurements14,15 . Such transient phenomena, would also display characteristic times shorter or comparable to the vortex transit time across the sample, in agreement with observations13,14 . (iii) The competition between the contamination and annealing processes is expected to result in local instabilities causing the reported noise enhancement below the peak effect1,2 (see also Fig. 4a). (iv) Related phenomena should be observed in high-temperature superconductors in the vicinity of the peak effect associated with the melting transition, or near the second magnetization peak, consistent with experiments3–6,12,16 . (v) In high-temperature superconductors there is an additional consideration of thermal activation of vortices over the surface barriers, which may explain the reported slow voltage oscillations3–6 . If the thermal activation rate is higher or comparable to the driving rate, the slowly injected lattice will be ordered in contrast to the DP injected at higher drives. Thus, at a given applied current, if the bulk of the sample is in the OP, much of the current flows on the edges, rapidly injecting a DP through the surface barrier. Once the bulk gets contaminated, the resulting slower vortex motion causes again injection of an OP. This feedback mechanism can explain the voltage oscillations3,6 in YBa2 Cu3 O7 and similar narrow band noise4,5 in YBa2 Cu3 O7 and Bi2 Sr2 CaCu2 O8 with 7
characteristic frequencies comparable to the inverse transit time. (vi) Finally, the described phenomena should be absent in the Corbino disk geometry where vortices do not cross the sample edges. Our studies of NbSe2 in this geometry confirm this prediction, as will be published elsewhere.
8
REFERENCES 1
Marley, A. C., Higgins, M. J. & Bhattacharya, S. Flux flow noise and dynamical transitions in a flux line lattice. Phys. Rev. Lett. 74, 3029-3032 (1995).
2
Merithew, R. D. et al. Persistent metastable states in vortex flow at the peak effect in NbSe2 . Phys. Rev. Lett. 77, 3197-3199 (1996).
3
Kwok, W. K. et al. Dynamic instabilities in the vortex lattice of YBa2 Cu3 O7 . Physica C 293, 111-117 (1997).
4
D’Anna, G. et al. Vortex-motion-induced voltage noise in YBa2 Cu3 O7 single crystals. Phys. Rev. Lett. 75, 3521-3524 (1995).
5
Tsuboi, T., Hanaguri, T. & Maeda, A. Local density fluctuations of moving vortices in the solid and liquid phases in Bi2 Sr2 CaCu2 O8 . Phys. Rev. Lett. 80, 4550-4553 (1998).
6
Gordeev, S. N. et al. Current-induced organization of vortex motion in type-II superconductors. Nature 385, 324-326 (1997).
7
Bhattacharya, S. & Higgins, M. J. Flux-flow fingerprint of disorder: melting versus tearing of a flux-line lattice. Phys. Rev. B 52, 64-67 (1995).
8
Henderson, W. et al. Metastability and glassy behavior of a driven flux-line lattice. Phys. Rev. Lett. 77, 2077-2080 (1996).
9
Banerjee, S. S. et al. Anomalous peak effect in CeRu2 and 2H-NbSe2 : Fracturing of a flux line lattice. Phys. Rev. B 58, 995-999 (1999).
10
Banerjee, S. S. et al. Metastability and switching in the vortex state of 2H-NbSe2 . Appl. Phys. Lett. 74, 126-128 (1999).
11
For earlier studies see Wordenweber, R., Kes, P. H. & Tsuei, C. C. Peak and history effect in two-dimensional collective flux pinning. Phys. Rev. B 33, 3172-3180 (1986).
9
12
Kokkaliaris, S. et al. Onset of plasticity and hardening of the hysteretic response in the vortex system of YBa2 Cu3 O7−δ . Phys. Rev. Lett. 82, 5116-5119 (1999).
13
Henderson, W., Andrei, E. Y. & Higgins, M. J. Plastic motion of a vortex lattice driven by alternating current. Phys. Rev. Lett. 81, 2352-2355 (1998).
14
Xiao, Z. L., Andrei, E. Y. & Higgins, M. J. Flow induced organization and memory of a vortex lattice. Phys. Rev. Lett. 83, 1664-1667 (1999).
15
Andrei, E. Y. et al. Current driven organization of magnetic vortices. to appear in J. de Physique IV 9, (1999).
16
Metlushko, V. et al. Driven vortex states and relaxation in single crystal YBa2 Cu3 O7 . cond-mat/9804121. (1999).
17
Gammel, P. L. et al., Structure and correlation of a flux line lattice in crystalline Nb through peak effect. Phys. Rev. Lett. 80, 833-836 (1998).
18
Khaykovich, B. et al. Vortex-lattice phase transitions in Bi2 Sr2 CaCu2 O8 crystals with different oxygen stoichiometry. Phys. Rev. Lett. 76, 2555-2558 (1996).
19
Giamarchi, T. & Le Doussal, P. Elastic theory of pinned flux lattices. Phys. Rev. Lett. 72, 1530-1533 (1994).
20
Ertas, D. & Nelson, D. R. Irreversibility, mechanical entanglement and thermal melting in superconducting vortex crystal with point impurities. Physica C 272, 79-85 (1996).
21
Vinokur, V. et al., Lindemann criterion and vortex-matter phase transitions in hightemperature superconductors. Physica C 295, 209-217 (1998).
22
Pardo, F. et al., Topological defects in the flux-line lattice and their relationship to the critical current of a type-II superconductor. Phys. Rev. Lett. 78, 4633-4636 (1996).
23
Yaron, U. et al. Structural evidence for a two-step process in the depinning of the superconducting flux-line lattice. Nature 376, 753-755 (1995). 10
24
Bean, C. P. & Livingston, J. D. Surface barrier in type-II superconductors. Phys. Rev. Lett. 12, 14-16 (1964).
25
Paltiel, Y. et al. Surface barrier dominated transport in NbSe2 . Phys. Rev. B 58, R14763R14766 (1998).
26
Fuchs, D. T. et al. Transport properties governed by surface barriers in Bi2 Sr2 CaCu2 O8 . Nature 391, 373-376 (1998).
27
Fuchs, D. T. et al. Possible new vortex matter phases in Bi2 Sr2 CaCu2 O8 . Phys. Rev. Lett. 80, 4971-4974 (1998).
28
Burlachkov, L., Koshelev, A. E. & Vinokur, V. M. Transport properties of hightemperature superconductors: surface vs. bulk effect. Phys. Rev. B 54, 6750-6757 (1996).
11
ACKNOWLEDGEMENTS We acknowledge helpful discussions with P. B. Littlewood. The work at WIS was supported by the Israel Science Foundation - Center of Excellence Program, by the US-Israel Binational Science Foundation (BSF), and by Alhadeff Research Award. EYA acknowledges support from NSF.
12
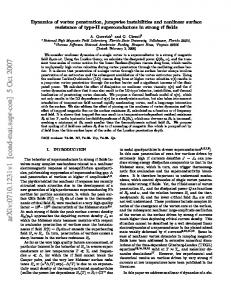
FIGURE CAPTIONS Fig. 1. The experimental setup (inset), the critical current vs. temperature in the vicinity of the peak effect (a), and (b) a schematic plot of the dynamic coexistence of the ordered phase (OP) with a metastable disordered phase (DP). Experimental. Several Fe (200 ppm) doped single crystals of 2H-NbSe2 were investigated. Here we report data on crystal A of 2.6 × 0.34 × 0.05 mm3 and Tc = 6.0K, and crystal B of 2.4 × 0.29 × 0.02 mm3 with Tc = 6.05K. Four electrical contacts were attached to the top surface for transport measurements, with the voltage contact separation of 0.6 ± 0.2 mm. The bottom surface of the crystal was attached to an array of 19 2DEG Hall sensors 10 × 10 µm2 each (inset). The vortex lattice was initially prepared in the OP by zero-field-cooling to a low temperature at which the DP is unstable, and then slowly heated to the desired temperature in the presence of a constant field Ha applied parallel to the c axis. (a) The peak effect in critical current Ic in NbSe2 crystal A vs. temperature, as measured with a dc drive, Icdc (�), and ac drive, Icac , at 181 (�) and 881 Hz ( ). The critical current was determined resistively using a voltage criterion of 1 µV. At low temperatures only the stable OP is present. On the lower temperature side of the peak effect a metastable DP coexists dynamically with the stable OP resulting in a frequency dependent Ic . On the high temperature side of the peak effect only the stable DP is present with no anomalous behavior. (b) Schematic plot of the local critical current density Jc (x) across a crystal of width W . Jcdis and Jcord are the values of the critical current density in the fully disordered and in the OP, respectively. For Lr ≪ W the DP relaxes rapidly into OP resulting in the dotted Jc (x) in the steady state dc flow. For Lr > W the DP penetrates to a depth xd (t) following the application of dc current at t = 0 (solid curve). For an ac current at t = Tac /2 the DP occupies the left edge to a depth of xac d (solid curve), and symmetrically the right edge at t = Tac (dashed curve). Fig. 2. Current density profiles Jac (x) in crystal B obtained by inversion of the selfinduced field measured by the Hall sensors. Shown are three frequencies f = 22 (•), 181 13
(�), and 481 Hz (�). A square wave ac current Iac was applied and the corresponding self induced magnetic field Bac (x) across the crystal was measured by the Hall sensors using a lock-in amplifier (see Fig. 1 inset). By using the Biot-Savart law the Bac (x) was directly inverted25 into the current density profiles Jac (x). The width xac d of the highly pinned DP near the edges grows with decreasing frequency as expected. The measured Jac (x) is the magnitude of the local current density averaged over the ac cycle period. As a result, Jac (x) reflects a time-averaged superposition of solid and dashed Jc (x, t) profiles in Fig. 1b, which are present separately during the positive and negative half-cycles. Close to the edges the high J is present most of the time, while close to xac d it is present only a small fraction of the ac period as the DP moves in and out of the sample. Therefore, the time-averaged Jac (x), decreases smoothly from the edge to xac d . A more detailed analysis shows that the firstharmonic measurement by the lock-in amplifier Fourier transforms the sharp instantaneous Jc (x, t) of Fig. 1b into the observed smooth Jcac (x) = Jcord +(Jcdis −Jcord )(1+cos(πx/xac d ))/2+ ac ac (Jcdis −Jcord )(1−cos(π(x+xac d −W )/xd ))/2. The second and third terms hold at 0 ≤ x ≤ xd
and W − xac d ≤ x ≤ W , respectively, and are zero otherwise. Fig. 3. Frequency dependence of the resistance Rac (f ) and of the width of the disordered regions xac d in crystal B. (a) At high frequencies Rac is large since most of the sample is in the weakly pinned OP. As the frequency is decreased the disordered regions increase and Rac drops sharply, when xac d reaches values close to the sample width. In the limit of zero f the resistance is zero since the applied current is lower than Icdc . (b) The corresponding width of the DP near the edges xac d derived from the Rac (f ) data ( ) and from the Jac (x) current profiles of Fig. 2 (�). As expected, xac d increases monotonically with decreasing frequency. The drop of the xac d data ( ) at very low frequencies is an artifact. At such frequencies the instantaneous vortex motion is present mainly at the onset of the square wave Iac pulses, and decays towards zero during the pulse13 . In this situation the first-harmonic Rac measurement by the lock-in amplifier underestimates the integrated vortex displacement. In addition to the frequency dependence, xac d also changes significantly by varying the amplitude of the ac current Iac . Here Iac =10 mA was chosen such that xac d becomes comparable to the sample 14
width W at low frequencies. Fig. 4. Measured resistance Rac at Iac = 20 mA as a function of dc bias Idc (a) and the corresponding distribution (b) of the ac current Jac (x) in crystal A. (a) At low bias Idc . f 2 mA only the regions near the edges are contaminated by the DP since Lef is very short, r
resulting in only a moderate decrease of Rac . For Idc & 2 mA the contamination becomes substantial and the significant decrease of Rac is accompanied by enhanced noise due to the local instabilities during the competing contamination and annealing processes. At still larger dc bias most of the sample becomes contaminated and Rac drops below our noise level. The corresponding Jac (x) profiles in (b) show that for positive Idc = +5.7 mA (•) a substantial part of the sample is contaminated from the left edge where the vortices enter into the crystal, and similarly from the right edge for negative bias Idc = −5.7 mA (�).
15
Stable Coexistence of OP OP and metastable DP
Ic [mA]
Hdc 1
Ha=0.4T
60
19
Iac
40
dc
Ic
ac
Ic
20 0
J
Stable DP
(a)
80
Hc2
4.8
5
5.2 T [K]
5.4
5.6
(b)
dis c
L >W r
DP
DP
Jc(x)
OP L