NUSOD 2013
Dynamic Modeling of Slow Light in Tensile-Strained Semiconductor Optical Amplifiers Michael J. Connelly Optical Communications Research Group, Dept. Electronic and Computer Engineering, University of Limerick, Limerick, Ireland. E-mail:
[email protected]. Abstract- The slow light effect in semiconductor optical amplifiers has many potential applications in microwave photonics such as phase shifting and filtering. Models are needed to predict the slow light effect in SOAs and its dependence on the bias current, wavelength, power and modulation index. In this paper we predict the slow light characteristics of a tensile-strained SOA by using a detailed time-domain model, that includes full band-structure based calculations of the SOA gain and bimolecular recombination coefficients, a detailed carrier density rate equation and travelling-wave equations for the amplitude modulated signal and spontaneous emission. The slow light parameters of interest include the beat signal phase shift and amplitude response. The model predictions show good agreement with experimental trends reported in the literature. I.
INTRODUCTION
*
There is an increasing interest in exploiting the possibility of controlling the group velocity of light [1]. Slow light occurs when a propagating pulse is substantially slowed down by the interaction with the medium in which the propagation takes place. The use of slow light has potentially important applications in optical buffering [2] and delay lines [3] and in microwave photonic applications such as tunable phase shifters [4]. In an SOA the principle mechanism causing the slow light effect is coherent population oscillations (CPOs), whereby beating between two lightwaves leads to carrier density oscillations at the beat frequency. This in turn leads to a change in the group index and so the beat signal at the SOA output is phase shifted relative to the SOA input beat signal. Most slow light models, while they give reasonably good predictions, use a linearized theory which assumes that the carrier density oscillations are small, use simple gain coefficient models and also ignore amplified spontaneous emission [5] . Furthermore such models usually only apply to a single wavelength; the use of a different wavelength requires the model parameters to be adjusted to enable agreement between experiment and theory. In this paper we modify a wideband steady-state model of a tensile-strained SOA [6], to develop a dynamic model that can be used to predict slow light amplification in such an SOA. The use of tensile stain in the SOA active region can be used to obtain low-polarization dependence gain, by adjusting the relative TE and TM gain coefficients to compensate for their different confinement factors. The tensile-strained SOA used in the simulation is a commercially available device (from Kamelian) [6]. * This research was supported by Science Foundation Ireland Investigator Grant 09/IN.1/I2641.
978-1-4673-6310-5/13/$31.00 ©2013 IEEE
II.
THEORY
In most slow light experiments the input signal to the SOA is generated by sinusoidal amplitude modulation of a lightwave carrier, resulting in a double-sideband unsuppressed carrier signal, so the envelope of the input optical field to the SOA is given by
E (t ) = Pc [1 + m cos(2π f mt )] , where and
(1)
Pc is the carrier power, m is the modulation index
f m is the modulating (beat) frequency. This is the form of
the SOA input signal we assume here. The dynamics of the SOA are governed by the interaction between the injected signal, amplified spontaneous emission and the carrier density. In the model the relevant dynamics occur on time scales much greater than the SOA transit time so the signal fields and the ASE power can be assumed to propagate instantaneously across the SOA length. The time changing nature of the signal and ASE is essentially determined by the carrier density n rate equation [6],
dn( z , t ) ηI Γ = − R ( n) − g c E 2 ( z, t ) dt eV dW ( z ) Ns
(2)
Γg k N k± ( z , t ) −∑ k =0 dW ( z ) This includes the current injection efficiency η , bimolecular recombination and Auger recombination (R(n) term) and carrier depletion due to the amplified signal and the ASE.
N k± (z ) is the forward/backward propagating ASE photon rate
of the k-th spectral slice. The model uses 40 spectral slices spanning a wavelength range of 300 nm centred at 1550 nm. (2) is solved using the modified Euler method finite difference technique with 128 time steps per modulation period. For the frequency range considered, the time step is always substantially less than the maximum value of the carrier recombination time encountered; which ensures the algorithm stability. At each step size the signal and ASE spatial distributions in (2) are obtained by numerical integration of their spatial differential equations [6]. The signal gain and ASE gain coefficients g c and g k and bimolecular recombination
for the dynamically changing carrier density are obtained by
69
NUSOD 2013 role of carrier density, and slow light." Opt. Express, vol. 18, pp. 685-693, 2010. [6] M.J. Connelly, “Wide-band steady-state numerical model and parameter extraction of a tensile-strained bulk semiconductor optical amplifier,” IEEE J. Quantum Electron., vol. 43, pp. 47-56, 2007.
interpolation from previously calculated coefficients, based on a full band-structure model. The output optical field is the amplified input field with an induced phase shift between the signal input and output beat components (at the beat frequency). There will also be some second harmonic distortion. In the model this distortion is removed by a lowpass filter, which makes the phase shift estimation more accurate. The SOA slow light transfer function is defined as the ratio of the output to input beat signal optical powers (equivalent to the ratio of the beat signals when detected by an ideal photodetector) in the frequency domain. III.
SIMULATIONS
In the simulations the input signal is TM polarised and the SOA structural and material parameters used are given in [6]. In Fig.1 a typical dependency of the beat signal gain and phase shift on the bias current is shown for an input carrier power of 0 dB, for a small modulation index. The SOA modelled optical gain characteristics for this scenario are shown in Fig. 3(a). At high bias currents the beat signal gain is substantially higher than the optical carrier gain especially at high frequencies. This is because the presence of CPOs leads to coupling of energy from the carrier to the sidebands. In Fig.2 a typical dependency of the beat signal gain and phase shift on the input carrier power is shown for a small modulation index. The power dependency of the optical gain is shown in Fig. 3(b). Increasing the input power (and thereby the average saturation level) decreases the beat signal gain. From Fig.1 and 2 it is evident that the phase shift can be tuned by controlling the current and input power. The shapes of the characteristics shown in Figs. 1 and 2 are very similar to experimental data reported in [5], which was obtained for a quantum-well SOA. In conclusion, the model is a useful tool for predicting SOA slow light properties for a wide range of input signal powers, modulation frequency and wavelength and includes a full description of the SOA geometry, material properties and ASE. The inclusion of the latter will make it possible to investigate the noise properties of the phase shifted beat signal, a topic which is currently under investigation.
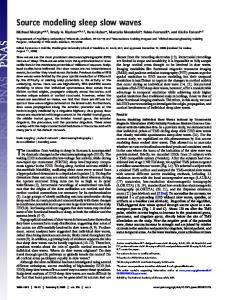
Fig. 1. SOA beat-signal gain and phase shift versus frequency for different bias currents. The signal wavelength, input carrier power and modulation index are 1550 nm, 0 dBm and 0.05 respectively. The SOA bias currents are 50, 75, 100, 150, 200 and 250 mA.
Fig. 2. Beat-signal gain and phase shift versus frequency for different input powers. The signal wavelength, SOA bias current and modulation index are 1550 nm, 200 mA and 0.05 respectively. The input carrier powers are -15, -10, -5, 0, 5 and 10 dBm. The unsaturated carrier optical power gain is 23 dB.
REFERENCES [1] S. Sales, W. Xue, J. Mork and I. Gasulla, “Slow and Fast Light Effects and Their Applications to Microwave Photonics Using Semiconductor Optical Amplifiers," IEEE Trans. Microw. Theory and Tech., vol. 58, pp. 30223038, 2010. [2] W. Xue, S. Sales, J. CapmanY and J. Mørk, "Microwave phase shifter with controllable power response based on slow- and fast-light effects in semiconductor optical amplifiers," Opt. Lett., vol. 34, pp. 929-931, 2009. [3] A. E. Willner, B. Zhang, L. Zhang, L. Yan, and I. Fazal, “Optical signal processing using tunable delay elements based on slow light,” IEEE J. Sel. Topics Quantum Electron., vol. 14, pp. 691–705, 2008. [4] R. S. Tucker, K. Pei-Cheng, and C. J. Chang-Hasnain, “Slow-light optical buffers: Capabilities and fundamental limitations,” J. Lightw. Technol., vol. 23, pp. 4046–4066, 2005. [5] P. Berger, M. Alouini, J. Bourderionnet, F. Bretenaker and D. Dolfi, "Dynamic saturation in semiconductor optical amplifiers: accurate model,
70
Fig. 3. SOA optical carrier gain characteristics for the settings of (a) Fig. 1 and (b) Fig. 2.