Consequently, the force applied to a rock bolt element is not related to the input energy ... GAP221 Project developed the first rig for testing support system tests.
MINERALS AND ENERGY RESEARCH INSTITUTE OF WESTERN AUSTRALIA (MERIWA)
REPORT NO. 249
DYNAMIC TESTING OF GROUND SUPPORT SYSTEMS PHASE 1 Results of research carried out as part of MERIWA Project No. M349 at the W.A. School of Mines, Curtin University of Technology, Kalgoorlie
by
E Villaescusa, A Thompson and J Player
March 2005
Distributed by: MERIWA Mineral House 100 Plain Street EAST PERTH WA 6004
© Crown copyright reserved ISBN: 1 920981 101
To which all enquiries should be addressed
EXECUTIVE SUMMARY This project was initiated in response to the recognition that ground conditions are becoming increasingly more difficult as mines become deeper. One of the main technical problems faced by operators of underground mines in Western Australia, particularly those in the Yilgarn Craton, is mining-induced seismicity and the related rockbursts caused by high in situ and mining-induced stresses. It is necessary to know the dynamic response characteristics of the reinforcement and support systems that will be required for design of effective ground support schemes. Prior to this project, there was no facility in Australia capable of performing the dynamic tests required to provide the design data. In addition, the test facilities used overseas were thought not to simulate the loadings expected from rockbursts and therefore would not provide the required data. A new loading concept involving momentum transfer was conceived by the principal researcher Professor Ernesto Villaescusa. A prototype was designed and constructed and tests performed to demonstrate the validity of this loading concept prior to developing the proposal for the conduct of this research project. The project, prior to commencement, was divided into two main phases: • Phase One was to design, build and commission the test facility and instrumentation and to test rock reinforcement systems comprising various elements, internal fixtures, external fixtures and face restraint. • Phase Two was anticipated to undertake any modifications required to the test equipment and instrumentation and to perform tests on fully-integrated ground support schemes comprising reinforcement systems and surface support systems used by the Western Australian mines. The final outcome of the overall project was to determine the energy absorption capacity of both the individual systems and the fully-integrated ground support schemes. The four specific tasks for Phase One were: 1.
Design a dynamic test unit, using the principle of momentum transfer in order to provide repeatable and low cost tests to simulate rockburst events.
2.
Construction of the test facility, capable of undertaking tests of reinforcement systems and face restraint.
3.
Development of instrumentation for the rock reinforcing systems and face restraint.
4.
Simulated rock burst event testing by dynamic / impact loading of reinforcing systems.
-i-
Phase One of MERIWA Project M349 commenced in June 2002. The achievements since that time have been: • The WASM Dynamic Test Facility has been designed and constructed. • The state-of-the art instrumentation and monitoring system has been designed, purchased and commissioned. • Over 20 specimens involving more than 80 tests have been performed and monitored during commissioning of the test facility. In addition, the following tasks, that were not specifically defined within the original proposal but evolved to be essential components of the project, were undertaken and completed: • Development of computer software, based on theoretical consideration of the mechanics involved in the test facility, for the analysis of different specimen configurations. • Development of computer software for the efficient analysis of the large quantity of data collected during tests. An objective of Phase One that has not yet been completed is the establishment of a database of different reinforcement system responses to dynamic loading. The most recent tests are currently being analysed. These test results will form the basis of a database of reinforcement system responses and will be documented in an addendum to this report. This report documents the outcomes from Phase One of the project. It is worth recording that these outcomes were delayed to a large extent due to the part time availability during 2003 of the two research engineers, Dr Alan Thompson and Mr John Player. The current situation is that both Alan Thompson and John Player are full-time at the WA School of Mines and based in Kalgoorlie.
-ii-
CONTENTS 1
INTRODUCTION.................................................................................................................................1
2
PROJECT OBJECTIVES, SCOPE OF WORK AND TASKS ........................................................2
3
IN SITU BEHAVIOUR OF GROUND SUPPORT SCHEMES .......................................................3 3.1 LOAD TRANSFER CONCEPT FOR REINFORCEMENT AND SUPPORT SYSTEMS ........3 3.2 REINFORCEMENT SYSTEM LOAD TRANSFER ..................................................................5 3.3 SUPPORT SYSTEM LOAD TRANSFER..................................................................................6 3.4 REINFORCEMENT AND SUPPORT INTERACTION ............................................................6 3.5 LOADING RATES......................................................................................................................7 3.5.1 Static .................................................................................................................................7 3.5.2 Dynamic Loads in Underground Mining..........................................................................7 3.5.3 Energy Release .................................................................................................................9 3.6 MEASUREMENT OF REINFORCEMENT RESPONSE........................................................11 3.7 MEASUREMENT OF SUPPORT RESPONSE........................................................................11
4
TESTING FACILITIES.....................................................................................................................12 4.1 LABORATORY SIMULATIONS ............................................................................................12 4.1.1 Specimen Configuration and Modes of Loading ............................................................12 4.1.1.1 Steel Pipes ....................................................................................................... 12 4.1.1.2 Axial ................................................................................................................ 12 4.1.1.3 Combined Axial and Shear.............................................................................. 12 4.1.2 Rates of Loading.............................................................................................................12 4.1.2.1 Static/Pseudo-Static Loading........................................................................... 12 4.1.2.2 Transient/Vibration/Cyclic .............................................................................. 13 4.1.2.3 Rapid Loading ................................................................................................. 13 4.1.2.4 Dynamic Impact .............................................................................................. 13 4.1.2.5 Multiple Loading Cycles ................................................................................. 14 4.2 DYNAMIC TEST FACILITIES – MINING APPLICATIONS................................................15 4.2.1 Background.....................................................................................................................15 4.3 CSIR TERRATEK.....................................................................................................................16 4.3.1 Limitations of the Terratek .............................................................................................18 4.3.2 Positive aspects of the Terratek ......................................................................................22 4.4 CSIR DROP TEST FACILITIES ..............................................................................................22 4.4.1 Reinforcing Element Testing from Drop Test Impact CSIR ..........................................23 4.4.1.1 Positive aspects in the Facility......................................................................... 24 4.4.1.2 Limitations of the Facility ............................................................................... 24 4.4.1.3 Stiffness and energy split methodology........................................................... 25 4.4.1.4 Application of impact load .............................................................................. 25 4.4.2 Ground Support Scheme Drop Testing CSIR.................................................................26 4.4.2.1 Limitations of the Facility ............................................................................... 26 4.4.2.2 Positive Aspects of the Test Facility ............................................................... 28 4.4.2.3 Update to the CSIR Drop Test Facility for Support Elements......................... 29 4.5 OTHER DROP TEST FACILITIES..........................................................................................30 4.5.1 GRC Support Element Test Facility ...............................................................................30 4.5.1.1 Positive Aspects of GRC Support Element Test Facility ................................ 31 4.5.1.2 Limitations of GRC support element test facility ............................................ 31 4.5.1.3 Comparison of Support Element Tests ............................................................ 33 4.5.2 Laurentian University, Face Plate and Reinforcing Element Test Unit..........................33 4.5.2.1 Positive Aspects of the Facility ....................................................................... 33 4.5.2.2 Limitations of Facility ..................................................................................... 33 4.5.3 Noranda Technology Centre Drop Unit..........................................................................35 4.5.4 Swedish Test Facility......................................................................................................35 4.6 Summary....................................................................................................................................35
-iii-
5
CONCEPT OF TEST FACILITY BASED ON MOMENTUM TRANSFER ...............................36 5.1 PROTOTYPE ............................................................................................................................36 5.2 HOW MOMENTUM TRANSFER RELATES TO “REALITY” .............................................37
6
WASM DYNAMIC TESTING FACILITY DESIGN AND CONSTRUCTION...........................39 6.1 DESIGN FACTORS..................................................................................................................39 6.1.1 Simulation of Rock Burst Event by Dynamic Loading ..................................................40 6.1.2 Energy Input, Size and Scale ..........................................................................................40 6.1.3 Drop Beam Size..............................................................................................................40 6.1.4 Buffers and Energy Dissipation......................................................................................40 6.1.5 Integration of ‘Ejected Rock’ .........................................................................................41 6.1.6 Relative Acceleration, Velocity and Displacement ........................................................43 6.1.7 Bolt Length and Support Area........................................................................................43 6.1.8 Borehole Simulation .......................................................................................................43 6.2 CONSTRUCTION OF TEST FACILITY AND ACQUISITION OF EQUIPMENT...............45 6.2.1 Foundations and Building...............................................................................................45 6.2.2 Guide Rails .....................................................................................................................47 6.2.3 Drop Beam......................................................................................................................47 6.2.4 Release Mechanism ........................................................................................................47 6.2.5 Impact Buffers ................................................................................................................48
7
SIMULATION OF THE WASM DYNAMIC TEST FACILITY...................................................49 7.1 METHODS OF SIMULATION ................................................................................................49 7.1.1 Approach 1 – Momentum...............................................................................................49 7.1.2 Approach 2 - Newton’s Second Law..............................................................................50 7.1.3 Approach 3 – Energy......................................................................................................50 7.1.4 Summary.........................................................................................................................50 7.2 COMPONENTS ........................................................................................................................50 7.2.1 Reinforcement System....................................................................................................50 7.2.2 Collar Zone.....................................................................................................................51 7.2.3 Anchor Zone...................................................................................................................51 7.3 REINFORCEMENT LOAD TRANSFER MECHANISMS .....................................................52 7.4 DESCRIPTION OF THE TEST PROCEDURE........................................................................55 7.5 COMPONENTS ........................................................................................................................56 7.5.1 Reinforcement System....................................................................................................56 7.5.2 Loading Mass .................................................................................................................57 7.5.3 Beam...............................................................................................................................57 7.5.4 Buffers ............................................................................................................................57 7.5.5 Impact Surface Response................................................................................................58 7.6 COMPONENT INTERACTIONS.............................................................................................59 7.7 METHOD OF SOLUTION .......................................................................................................59 7.8 INSTRUMENTATION AND MONITORING SYSTEM ........................................................62 7.9 DATA ACQUISITION..............................................................................................................62 7.10 SENSORS..................................................................................................................................64 7.10.1 Accelerometers ...............................................................................................................64 7.10.2 Load Cells.......................................................................................................................65 7.10.3 Ultrasonic Motion Sensor ...............................................................................................66 7.10.4 Linear Potentiometer ......................................................................................................67 7.10.5 Laser Break and Triggering ............................................................................................68 7.10.6 Physical Measurements ..................................................................................................68 7.10.7 Strain Gauge ...................................................................................................................69 7.11 CAMERA RECORDING ..........................................................................................................70
8
SUMMARY OF TESTING ................................................................................................................74
9
DATA ANALYSIS PROCEDURE ....................................................................................................80 9.1 TESTING DATA.......................................................................................................................80
-iv-
9.2 9.3 9.4
9.5 9.6
ANALYSIS OF VIDEO RECORDING DATA ........................................................................82 FILTERING OF RAW DATA ..................................................................................................82 KALMAN FILTER FOR MULTIPLE VARIABLES...............................................................84 9.4.1 State Variables................................................................................................................85 9.4.2 Vector of measurements .................................................................................................85 9.4.3 Matrix of partial derivatives ...........................................................................................85 9.4.4 Propagation matrix .........................................................................................................86 9.4.5 Process noise matrix .......................................................................................................86 9.4.6 Covariance matrix...........................................................................................................86 9.4.7 Measurement noise matrix..............................................................................................86 9.4.8 Summary.........................................................................................................................87 DEMONSTRATION OF KALMAN FILTER ..........................................................................87 ENGINEERING CALCULATIONS.........................................................................................89 9.6.1 Forces and displacements ...............................................................................................89 9.6.2 Momentum .....................................................................................................................90 9.6.3 Energy ............................................................................................................................90
10
COMPARISON OF EXPERIMENT WITH THEORY ..................................................................91 10.1 TEST DESCRIPTION ...............................................................................................................91 10.2 ASSESSMENT OF TEST DATA AND SIMULATION ........................................................102
11
IN SITU SIMULATION...................................................................................................................102
12
ASSESSMENT OF THE WASM TEST FACILITY .....................................................................102
13
CONCLUDING REMARKS............................................................................................................105
14
ACKNOWLEDGEMENTS..............................................................................................................105
15
REFERENCES..................................................................................................................................105
16
BIBLIOGRAPHY .............................................................................................................................109
APPENDIX ....................................................................................................................................................1 TERMINOLOGY..........................................................................................................................................1
-v-
LIST OF FIGURES Figure 1
Reinforcement load transfer from unstable rock to stable rock
3
Figure 2.
Load transfer from surface support to surrounding reinforcement systems.
4
Figure 3.
Load transfer between surface support and the surrounding rock surface.
4
Figure 4.
The components of a reinforcement system.
5
Figure 5.
Schematic showing the different load force distributions within each of the three classes of reinforcement systems.
11
Figure 6.
Terratek hydraulic dynamic test facility
17
Figure 7.
Terratek bolt sample lengths (provided by CSIR without adjustment).
18
Figure 8.
Example of a force-time response curve obtained using the Terratek.
20
Figure 9.
Computer simulation of the Terratek test for the yielding reinforcement element.
20
Figure 10. Computer simulation of the force-time response for the yielding reinforcement element anchor.
21
Figure 11. Computer simulation of the force-displacement response for the yielding reinforcement element anchor.
21
Figure 12. Mass drop onto swing beam to load reinforcement element.
23
Figure 13. Drop Mass for Ground Support Scheme Testing
27
Figure 14. GRC Shotcrete Test Facility - Creighton Mine
30
Figure 15. Laurentian University Drop Unit.
34
Figure 16. WASM Prototype dynamic loading of ground support scheme.
37
Figure 17. Schematic representation of the behaviour of rock when subjected to seismic loading.
38
Figure 18. Schematic of load transfer rings and integration with the steel pipe.
42
Figure 19. Base Plate, Surface Hardware and Instrumentation
42
Figure 20
46
Detail of the foundation block, with tie-down bolts for buffers and guide rails.
Figure 21. Building construction.
46
-vi-
Figure 22. Photograph showing guide rails, drop beam and release mechanism.
47
Figure 23. Section of Oleo buffer, from www.oleo.co.uk.
48
Figure 24. Schematic of new testing facility showing the major components and their arrangement.
51
Figure 25. Schematic of load transfer mechanisms for a reinforcement system in the WASM Dynamic Test Facility.
52
Figure 26. Displacements and deformations of components and reinforcement system in the WASM Dynamic Test Facility.
54
Figure 27. Force-displacement response of a yielding reinforcement system.
57
Figure 28. Static response curves for a buffer.
58
Figure 29. Theoretical force-displacement response of a buffer subjected to an impact energy of 50kJ
Figure 30
from a mass of 1 tonne.
58
Schematic of instrumentation and data acquisition
63
Figure 31. Shock Accelerometer and surface hardware.
65
Figure 32. Load cell for measuring force at the collar.
65
Figure 33. Set of load cells for measuring anchor force.
66
Figure 34. Ultrasonic measuring buffer compression and accelerometer on beam above buffer.
67
Figure 35. Laser break trigger of instrumentation.
68
Figure 36. Measuring anchor of bolt displacement.
69
Figure 37. Measurement of separation at the simulated discontinuity at each test.
69
Figure 38. Strain gauge locations on drop beam.
70
Figure 39. Representation of the geometry used to correct the displacement-time data obtained by the video camera.
72
Figure 40. Constructed WASM test facility.
73
Figure 41. Accelerometer loading on the beam above the buffer.
78
Figure 42. Load cell response to dynamic load.
79
-vii-
Figure 43. Buffer displacement and shock accelerometer
79
Figure 44.
Unfiltered acceleration-time plot from the accelerometer on the beam above the buffer.
81
Figure 45.
Unfiltered force-time plot from the collar load cell.
81
Figure 46.
Unfiltered displacement-time plot from the motion sensor.
81
Figure 47.
Displacement-time plot for the loading mass derived from the video recording.
82
Figure 48.
Beam acceleration-time plot corresponding to Figure 43 after filtering out frequencies above 100Hz.
83
Figure 49. Collar force (PEP)-time plot corresponding to Figure 44 after filtering out frequencies above 150Hz. - anchor force (PA) also shown as dashed line for comparison. Figure 50.
83
Filtered displacement, velocity and acceleration derived by Kalman filter from data shown in Figure 45.
88
Figure 51. Buffer displacement-time response after analysis of test data.
93
Figure 52. Simulated buffer displacement-time response.
93
Figure 53. Buffer velocity-time response after analysis of test data.
94
Figure 54. Simulated buffer velocity-time response.
94
Figure 55. Buffer acceleration-time response after analysis of test data.
95
Figure 56. Simulated buffer acceleration-time response.
95
Figure 57. Reinforcement displacement-time response after analysis of test data.
96
Figure 58. Simulated reinforcement displacement-time response.
96
Figure 59. Reinforcement velocity-time response after analysis of test data.
97
Figure 60. Simulated reinforcement velocity-time response.
97
Figure 61. Reinforcement acceleration-time response after analysis of test data.
98
Figure 62. Simulated reinforcement acceleration-time response.
98
Figure 63. Measured reinforcement force-time response after filtering of test data – collar force shown as continuous line and anchor force shown as dashed line.
-viii-
99
Figure 64. Simulated reinforcement force-time response.
99
Figure 65. Reinforcement force-displacement response after analysis of test data.
100
Figure 66. Simulated reinforcement force-displacement response.
100
Figure 67. Energy-time responses of the various components after analysis of test data.
101
Figure 68. Simulated energy-time responses of the various components.
101
-ix-
LIST OF TABLES Table 1.
Effective Pipe Stiffness
44
Table 2.
Summary of commissioning test program
75
-x-
1
INTRODUCTION
The purpose of rock support and reinforcement is to maintain excavations safe and open for their intended lifespan. The effectiveness of a chosen ground support scheme directly impacts the safety of personnel and equipment, and the economics of ore extraction. The types of support and reinforcement systems required in a particular application and their effectiveness depend on several factors such as the geometry of the excavation, the strength of the rock mass, the stresses present in the rock, blasting practices, weathering and corrosion processes and the response of the rock mass to mining. Ground conditions are becoming increasingly difficult as the mines in Western Australia are getting deeper (Li et al., 1999). Mining-induced seismicity and the related rockbursts are two of the main technical problems faced by underground mines in Western Australia, particularly those that are operating in the Yilgarn Craton. These mines need improved understanding of seismic mechanisms and risk mitigation processes. Several applied research projects have been completed or are in progress. These projects involve collaboration between industry and university researchers. A need exists to be able to design and implement measures that protect the work force and mining equipment from rockbursts. This can be achieved by the use of: • dimensioning excavations and scheduling their extraction to minimise high stress. • reinforcement and support systems that are capable of surviving rockburst loadings. • micro-seismic monitoring and interpretation to improve local understanding of the rock mass response to mining. • exclusion zone and no-entry periods. The design of an appropriate extraction geometry and sequence is the primary method to mitigate the effects of mine seismicity in Western Australian mines. The ground support scheme is the main method to mitigate the effects of rockbursts. Consequently, an understanding of the dynamic energy absorption capabilities of reinforcement and support systems is an essential component for the design of complete ground support schemes to maintain rock mass integrity following a rockburst. This report provides: • A statement of the primary objectives and the scope of work and tasks that evolved during the project. • A review of the mechanics of reinforcement and support response to rock mass deformation. • A critical review of existing dynamic testing facilities.
-1-
• An account of the design, construction and commissioning of the WASM Dynamic Test Facility. • The development of software to simulate dynamic tests of reinforcement systems. • The design, implementation and commissioning of a state-of-the-art instrumentation and monitoring system. • The development of software to analyse the results obtained from dynamic tests of reinforcement systems. • An example of the results obtained from the simulation and analysis of a dynamic test on a reinforcement system. • A summary of the current status of the WASM Dynamic Test Facility.
2
PROJECT OBJECTIVES, SCOPE OF WORK AND TASKS
Three main objectives were identified in the original research project proposal: • To establish a permanent dynamic testing facility in Kalgoorlie, WA. • To establish databases of measured dynamic responses for different types of reinforcement and support systems. • To establish guidelines for expected energy absorption of various types of reinforcement and support systems. The ultimate aim was: • To establish criteria for selection of ground support schemes based on rock mass characteristics and expected energies associated with seismic loadings. It was identified prior to the commencement of the project that these overall objectives would need to be divided into two phases. The Phase One objectives became: • To design, build and commission the test facility and instrumentation and to test rock reinforcement systems comprising various elements, internal fixtures, external fixtures and face restraint. And the Phase Two objectives would then be: • To undertake any modifications required to the test equipment and instrumentation and perform tests on fully-integrated ground support schemes comprising reinforcement systems and surface support systems as currently used, or could potentially be used, by the Western Australian mines. The final outcome of the project is to determine the energy absorption capacity of both the individual systems and the fully-integrated ground support schemes.
-2-
To complete Phase One the following four specific tasks were identified: 1.
Design a dynamic test unit, using the principle of momentum transfer in order to provide repeatable and low cost tests to simulate rockburst events.
2.
Construction of the test facility, capable of undertaking tests of reinforcement systems and face restraint.
3.
Development of instrumentation for the rock reinforcing systems and face restraint.
4.
Simulated rock burst event testing by dynamic / impact loading of the reinforcing systems.
3
IN SITU BEHAVIOUR OF GROUND SUPPORT SCHEMES
In order to properly design testing facilities and associated procedures it is first necessary to understand the in situ interaction between ground support schemes and the rock mass. An important aspect of the ground support scheme response is the amount of rock mass deformation and the rate at which it occurs.
3.1
LOAD
TRANSFER
CONCEPT
FOR
REINFORCEMENT
AND
SUPPORT SYSTEMS The load transfer concept for reinforcement and support systems involves considering the response of these systems to rock movement. In the case of a reinforcement system, it is assumed that the reinforcement transfers force across a distinct interface or zone between unstable and stable rock as shown in Figure 1.
Excavation
Figure 1
Unstable Surface Region
Stable Interior Region
Reinforcement load transfer from unstable rock to stable rock
-3-
In the case of support, it is assumed that the support transfers force to points of restraint such as rock bolts or cable bolts (Figure 2) or zones of restraint provided by adhesion between the support system and the rock surface (Figure 3). In this report, only the load transfer within reinforcement systems will be examined in more detail
Unstable Block
Figure 2.
Restraint
Mesh, Strap or Sprayed Layer or Coating
Restraint
Load transfer from surface support to surrounding reinforcement systems.
Unstable Block
Adhesion Required
Adhesion Required
Sprayed Layer or Coating
Figure 3.
Load transfer between surface support and the surrounding rock surface.
-4-
3.2
REINFORCEMENT SYSTEM LOAD TRANSFER
A reinforcement system can be considered to consist of 4 components as shown in Figure 4; namely: 0.
The rock.
1.
The element.
2.
The internal fixture.
3.
The external fixture.
Figure 4.
The components of a reinforcement system.
The response of the reinforcement system to rock loading involves several modes of load transfer between the various components. The modes of load transfer between the element and rock lead to a simple classification system described by Windsor and Thompson (1996). This classification system resulted in only three basic classes of reinforcement systems; namely: 1.
Continuously Mechanically Coupled (CMC) Systems.
2.
Continuously Frictionally Coupled (CFC) Systems.
3.
Discretely Mechanically or Frictionally Coupled (DMFC) Systems.
It can be easily demonstrated that all commercial reinforcement systems can be considered to fit within one of these three classes.
-5-
3.3
SUPPORT SYSTEM LOAD TRANSFER
It is not intended to examine the support system load transfer in detail other than to indicate that support systems and their modes of action may be very different. The obvious difference is the areal coverage and accordingly support systems can be classified as: • Point Support (i.e. plates) • Strip Support (i.e. flat, profiled or mesh straps) • Areal Support (i.e. mesh sheets and rolls, shotcrete and sprayed coatings/TSLs) There are a number of measures that may be used to assess differences between the various support systems, particularly within each of the three classes (based on areal coverage). Some measures (other than areal coverage) which are important in terms of maintaining the integrity of the rock are: • Increasing the strength of discontinuities at the boundaries of unstable rock. • Reaction in terms of both immediacy and stiffness to transverse loading. • Membrane action in tension in terms of both strength and stiffness. • Membrane action in compression in terms of both strength and stiffness. • Toughness in response to transverse loading and in plane distortion (shear). • Time dependent creep and relaxation associated with the different materials. Membrane action results from loading within the plane (extension and compression) while transverse loading causes shear and bending. Areal support systems which are restrained by reinforcement will involve both transverse loading and membrane action.
3.4
REINFORCEMENT AND SUPPORT INTERACTION
It was indicated in Section 3.1 that one of the main mechanisms of load transfer from unstable rock to stable rock requires the support system to be restrained by the reinforcement system. If this interaction at the collar of the reinforcement system fails, then the ground support scheme will not be effective in retaining the unstable rock. It is this interaction that will be investigated in Phase Two of this project.
-6-
3.5
LOADING RATES
3.5.1
Static
In most applications of reinforcement, the loading can be considered to be static and due to gravity and stress. The loading may change with time as excavations are created and induce stress changes and rock mass deformation. The properties of the reinforcement system may also change with time due to creep of materials and corrosion. The response of reinforcement systems to static loading is reasonably well established and design of adequate reinforcement and support can be performed with some degree of confidence. 3.5.2
Dynamic Loads in Underground Mining
Design of reinforcement and support cannot be performed with any certainty for seismic and rockburst loadings as the forces and displacements required to be sustained by the reinforcement and support systems have not been established. Some suggested values of the parameters required for design are presented and discussed. Seismic systems have been used for the last 15 years or so to measure the seismicity in mines. There is a large amount of data on the seismic signals but very little, if any, information related to the velocities of rock mass ejection associated with rockbursts and the forces and displacement induced in reinforcement and support systems. Generally, the assessment of particular reinforcement and support systems is based on the damage observed relative to the size of the seismic event and its relative proximity. Some of the suggestions made by various workers in the area of mine seismicity and ground support are: • Wagner (1982) discussed a static force capacity to withstand nearby seismic events with an allowance of 300mm for drive closure. • Roberts and Brummer (1988) consider seismic loading from a low frequency wave and developed this work further. • Jager et al. (1990) published damage mechanisms and the requirements for yielding rock bolts to control rockburst damage, this followed the development of the cone bolt. The experience based requirement was “to control reasonably severe rockburst deformations, tendons must have the capacity to absorb at least 25kJ of energy during the rockburst”. This is the requirement of the rock bolt and the surface support is additional. • Kaiser et al. (1996) and Stacey and Ortlepp (2002) developed ground support scheme criteria for seismic events. The criteria are based upon: • ground excitation velocity from far field Peak Particle Velocity (PPV) decay equations for seismic events,
-7-
• an assumption for the amplification of the PPV of the wave when it encounters an excavation, • and an assumption on the volume of ground to be ejected. Each group of authors uses different decay equations for calculation of PPV and different amplification factors at the excavation surface. Each group has developed their own dynamic test facilities to assess energy absorption capacity for reinforcement and support elements (without force-displacement curves) and hence each arrives at differing ground support requirements for similar rockburst events. Kaiser et al. (1996), using the results from work by Aki and Richards (1980), state that the far field PPV relations do not hold within one to two times the source radius, where the source radius is defined by equation 1 from Scholz (1990): r 30 =
7 M0 16Δσ
(1)
Where r0 is the source radius, M0 is the Moment in Nm and Δσ is the static stress drop in MPa Ortlepp (1992) provides six different mechanisms for rockbursting. Four of the mechanisms use excitation of the rock mass around a tunnel by a wave from a seismic event. They are laminar buckling, ejection, inertial displacement, and arch collapse. Two mechanisms are also given which are results of the induced stress about an excavation, strain burst and implosion. In these two cases the seismic event and rockburst would occur at or about the excavation surface, and would definitely be within the source radius. The first four cases may or may not occur within the source radius. Big Bell Gold Mine seismic data set has approximately 20,000 quality monitored seismic events over a three year period that resulted in 11 recorded rockbursts. Nine other rockbursts occurred at the mine but their trace (and source parameters) were either covered by a production blast or occurred prior to installation of the seismic system. Of the 11 monitored rockburst events, one event had the main damage location greater then two times the source radius, with shake down of unsupported rock from an excavation wall. Two other rockbursts had secondary damage of shake down from unsupported walls also at greater than twice the source radius. All other events had damage within two times the source radius predicted by Equation 1. These observations correspond with a conversation published by Jager (1992) where he quotes McGarr from work in South African gold mines: “After plotting the distance of the hypocenter of 80 seismic
-8-
events, which caused rockburst damage, from the area of damage and then calculating the source dimensions of the event, the author came to the conclusion that the majority of the severe rockbursts occur in the source region or near-field.” The actual formulae used to develop the peak ground velocity against cumulative damage were not given in Jager’s 1992 paper. These observations imply a more accurate understanding is required within or very near the seismic source radius of the following items: • whether PPV is the best way to assess ground motion within the source or very near to the source, • strain wave loading of the rock mass from the seismic energy release, • whether a difference exists between seismic waveforms and loading mechanisms from a very large far-field event compared with moderate very near-field event when they encounter an excavation. 3.5.3
Energy Release
A number of questions exist regarding seismic energy release and rock mass response: Question: How much energy is actually released by seismic events of different magnitudes and are the “usual” source parameters sufficient to describe this? Answer: Possibly, if using a combination of source parameters such as radiated seismic energy, seismic moment, stress drop, source radius, and apparent stress. Question: Is a magnitude scale an adequate description of an event particularly when there are a number of published formulas for the calculation of the same scale? Answer: Magnitude scales were highly relevant prior to the use of digital recording of seismic waves. Digital recording now enables data capture across the full wave frequency. Magnitude scales were developed for specific geographic regions, some have upper and lower limits of application, and others can only be applied in one direction. Question: How much of the seismic energy is dissipated by rock mass fractures created during the seismic event? Answer: McGarr et al. (1979) gave approximately 1% and McGarr (1999) estimates maximum seismic efficiency at 6%. The seismic efficiency is influenced by size of the stress drop, and the shear strength of the slip plane before and after the event. Waveform attenuation parameters also need to be applied. Question: How is the released excess seismic energy absorbed by the ground support scheme? Answer: This will be dependent on the load transfer mechanisms from the rock to the reinforcing and support elements and the dynamic force displacement curves of the elements.
-9-
Question: How are the dynamic forces transferred between the support and reinforcing elements? Answer: This is not sufficiently understood. The Western Australian School of Mines (WASM) dynamic test facility has been designed to provide answers to the latter two questions. The assessment of dynamic force displacement curves and the development of an energy absorption calculation methodology sets the WASM test facility apart from other mining dynamic test facilities. The facility was full detailed by Player et al. (2004) and Thompson et al. (2004).
- 10 -
3.6
MEASUREMENT OF REINFORCEMENT RESPONSE
The load transfer and distribution of force for reinforcement systems within each of the three classes differ greatly in their responses and abilities to sustain dynamic loading, Figure 5 shows conceptually the expected force distributions within each class. These conceptual force distributions can be used as the basis for analysis and to identify where to instrument reinforcement systems in both the field and in the laboratory (Thompson and Windsor, 1993).
CMC
CFC
DMFC
Figure 5.
Schematic showing the different load force distributions within each of the three classes of reinforcement systems.
3.7
MEASUREMENT OF SUPPORT RESPONSE
There are very few, if any, instances where support systems in mining applications have been instrumented and monitored. In civil engineering tunnels, measurements have been made in shotcrete arches and rings using embedded strain gauge cells. In Phase Two of the project, the measurement of support response will be investigated.
- 11 -
4
TESTING FACILITIES
4.1
LABORATORY SIMULATIONS
4.1.1
Specimen Configuration and Modes of Loading
4.1.1.1
Steel Pipes
The double embedment or split pipe has been established as the standard specimens for laboratory testing of continuously mechanically coupled reinforcement systems (Villaescusa et al., 1992). The element and grout are contained with steel pipes and force-displacement response at the interface between the two pipes is established. 4.1.1.2
Axial
Most laboratory tests are performed with axial loading to measure their force displacement response from which their stiffness and energy absorption can be derived. 4.1.1.3
Combined Axial and Shear
A few tests have been performed with combined axial and shear loading (e.g. Windsor and Thompson, 1993).
The results reported from these tests show significant differences in the force-displacement
responses of reinforcement systems. However, the tests are difficult to set up and perform and are not widely used. 4.1.2
Rates of Loading
There are various methods used to create different rates of load application to structures and elements of structures. These different rates of loading, and the various methods that have been used to generate them, are summarised in the following sections. 4.1.2.1
Static/Pseudo-Static Loading
Static/pseudo-static loading is the most common used to measure the response of materials. Within this category of loading, there are three types of tests: • Pseudo-static tests in which tensile or compressive loading is slowly increased. The deformational response is assumed to occur immediately and is measured simultaneously with the applied force to produce a force-displacement or stress-strain characteristic. • Creep tests in which the element is subjected to constant force and the deformation measured at various times after application of the force. The deformation increases with time and results in a displacement-time characteristic for the particular applied force. Materials that are susceptible to creep will generally exhibit higher rates of creep at high loads. Failure may occur at force levels
- 12 -
much lower than the strength measured in psuedo-static tests. A creep test requiring application of a large force over a long period of time is difficult to justify as it will generally involve the use of a universal testing machine. • Load relaxation tests in which the element is stretched or compressed and maintained in the deformed position while the force is monitored with time. For susceptible materials, the force decreases with time. The rate of force decrease is related to the creep rate of the material. The load relaxation test is generally preferred to a creep test as it does not necessarily require the use of a universal testing machine. 4.1.2.2
Transient/Vibration/Cyclic
These types of loadings involve application of force that varies with time during which the displacement response is measured. Examples of transient/vibration/cyclic loading methods are: • excitation of a structure on a shaker table, • out of balance loading within a large structure (Iskhakov and Ribakov, 2000), • vibration loading of a structure mounted on the ground (Lu et al., 2000), • vibrational loading of a structure / element underground ground from an explosive detonation (Ansell, 1999, Milev et al., 2001). The purpose of the first three types of tests is usually to determine the unstable, resonant frequency of response of the structure. 4.1.2.3
Rapid Loading
Rapid loading can be produced by a volumetric increase of expanding gases to load an element or structure (e.g. Smart and Schleyer ,2000)). This may produce a constant velocity with unknown input energy. 4.1.2.4
Dynamic Impact
An impulsive force may be produced by the impact of an element with known momentum with another element (generally stationary). For example: • direct impact of a mass onto an element, Hansen et al. (2003), Kaiser et al. (1996). • impact of the structure / element onto a fixed element, Ansell (2000). • impact of the structure / element onto a moveable element, eg military collision testing of loaded train wagons (Whitesands Test facility).
- 13 -
• impact of a mass on to a load transfer mechanism or energy dissipation element (Player et al. ,2004, Ishikowa et al. 2000). Direct impact appears to be the most common for civil, mining and military applications (excluding the modelling of earthquake loads on structures). Direct impact could use : • a free falling mass (Masuya et al., 2000). • a guided mass (Kishi et al., 2000). • a fired mass (missile / bullet penetration) (Whitesands Test Facility). • impact from a mass directly onto the test structure / element (Ando et al. ,2000) and in particular shotcrete panel tests (Kaiser et al., 1996). • impact from a mass onto a surface that spreads the load from the moving mass to the test structure / element (Ishikawa et al. ,2000, GAP221 Report, 1997 and GAP423 Report, 1998). • the structure or element to be tested is moving and impacts a movable or non-movable element, eg commercial and military vehicle crash simulations. 4.1.2.5
Multiple Loading Cycles
It is accepted that many materials may fail when subjected to multiple loadings. It is expected that ground support systems in seismically active mines will be subject to multiple events.
- 14 -
4.2
DYNAMIC TEST FACILITIES – MINING APPLICATIONS
4.2.1
Background
Dynamic force displacement curves should be used for the calculation of the energy absorbed or lost in the test structure / element and facility. This follows the established practice assessing force-displacement curves and load transfer in quality quasi-static performance testing of ground support elements. The WASM team examined the process of obtaining the required force displacement measurements during facility design. Comments will not be made on whether the other test rigs happen to be right or wrong; however, a lack of published energy balance equations from existing test facilities is evident. The facilities examined in terms of there advantages and limitations are; • CSIR Terratek (hydraulic loading) • CSIR Impact Testing (drop testing for a reinforcement element or support elements) • GRC Impact Testing (drop testing for reinforcement element or support elements) • NTC Impact Testing (drop testing for reinforcing element) • Swedish Impact Test • WASM Momentum Transfer The purpose of dynamic testing is to understand how a structure or an element behaves under rapid loading conditions. This is typically undertaken by building either a full scale or scaled model of the structure or element to be tested. The test process should replicate the conditions considered to be most important for the real life problem. Particular attention should be paid to load transfer to the element or structure, the design of instrumentation points and the methodology for calculating energy. The categories that differentiate the reviewed civil, military and mining test facilities are; • the scale of test (energy input, scaling of test elements), • unit being tested (an element of a structure, or the complete structure), • application of energy (vibrational loading, direct impact, shock wave / compressed gas), • instrumentation utilised for calculating energy, • repeatability of the test and procedure, • associated development of a computer model to compare expected responses to physical response, Thompson et al. (2004), Kishi et al. (2000), Ishikawa et al. (2000).
- 15 -
4.3
CSIR TERRATEK
The Terratek unit, shown in Figure 6, was built in the USA in 1978. It is now based at the CSIR centre in Johannesburg. The unit uses hydraulics to pull the collar of a shortened bolt or push the top end of a prop at a predetermined velocity. The unit is capable of dynamic operation up or down, loading bolts in tension or shear, or props in compression. When configured for bolts, the unit assesses the reinforcing element and anchor mechanism of the ground reinforcement system. The surface hardware that would be attached to the bolt cannot be included. The Terratek has the capacity to cause a rapid displacement for 200mm at a set velocity between 1.2m/s to 3m/s. The velocity is determined by the amount of restriction from the high to low pressure cylinders. The low pressure side is set at 40 tonnes and the high pressure is set at 160 tonnes. The Terratek is also capable of slow displacement pulling a bolt at 30mm / minute or 15mm / minute. There is a maximum piston displacement of 600mm, with 500mm displacement as the standard test criteria. The sample dimension and configuration for the Terratek testing apparatus are shown in Figure 7 (as provided by the CSIR).
- 16 -
Figure 6.
Terratek hydraulic dynamic test facility
- 17 -
TERRATEK SLOW AND DYNAMIC PULL TEST SAMPLE DIMENSIONS These length dimensions are based on the piston being at the bottom of its stroke (i.e. we can withdraw up to the full stroke maximum of 600mm) The pull collar attached to the encapsulation tube rests beneath twin I beams that locate in the machine frame. Withdrawing the piston pulls the tendon relative to the encapsulation tube OPTION ‘A’
OPTION ‘B’ 60mm thread length for adaptor
500 mm minimum
Pull collar welded to top with ID close to tendon size to prevent grout pull out
500 mm minimum
PULL SETUP
Washer collar welded to top with ID close to tendon size to prevent grout pull out
Pull collar 20 mm thick diameter 50 mm more than pipe OD 500 mm maximum
Welds at bottom
Load cell (400kN Max) Thread adaptor Test tendon ‘I’ Beams supports
1000 mm
500 mm maximum
From options A & B you could vary your bond length by up to an additional 500 mm The usual tube wall thickness is 5 to 6mm If however your yield mechanism relies heavily on the confinement supplied by the rock mass much thicker wall tube is required to prevent tube distortion influencing the test results by supplying insufficient confinement.
Piston rod
Pull collar Encapsulated tube (thick walled)
NOTE The 500 mm length of tendon above the top of the pull collar is a minimum figure that is required to be able to reach the load cell adaptor when the piston rod is in its fully extended position Lengths in excess of 500 mm are not a major problem it simple results in a loss of stroke length The 500 mm distance from the top of the pull collar is a maximum dimension limited by the available clearance below the I beams
Our current adaptors will take 16, 20 or 25mm threaded rod
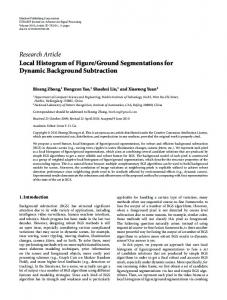
Figure 7. 4.3.1
Terratek bolt sample lengths (provided by CSIR without adjustment). Limitations of the Terratek
The limitations of the Terratek are assessed as: • applied velocity is independent of the load transfer capability of the reinforcing element being tested. Consequently, the force applied to a rock bolt element is not related to the input energy from the hydraulics of the Terratek. • the force applied to the element at the selected test velocity may exceed the force that a rockburst could apply to the element. • the method by which load is applied does not account for energy absorbed by the reinforcement system, which if effective, reduces the velocity of the ejected rock by doing work. • the unit can only test the rock bolt element and its anchor mechanism and not the rock reinforcement system.
- 18 -
• samples only taken at a single point. Readings for displacement, piston velocity, and force are taken at a rate of 1000 samples per second per channel. Sampling occurs at the load cell attached to the collar and there is no filtering of the data. The data is graphically presented, although electronic data is also available (visit by John Player in 2001). A typical force-time response obtained in the test facility for a yielding reinforcement element is shown in Figure 8. It is not clear how manufacturers and site engineers can interpret the data when presented in this form.
Of some concern was whether measuring the force applied at the “collar” of the bolt was
representative of the resisting force at the anchor.
To investigate the potential cause for the wild
fluctuations in the force with time, a computer program (briefly described in Section 13) was developed to simulate the Terratek testing method. The software was used to simulate the yielding reinforcement element and the results are given in Figure 9. The similarities in the forms of the collar force-time responses suggest that the simulation software may produce results that are representative of this test facility. If this is the case, then it is pertinent to examine the force-time and force-displacement responses predicted for the yielding anchor shown in Figure 10 and Figure 11, respectively. These predictions suggest that the force at the anchor in a test could be expected to be almost constant while the collar force fluctuates widely above and below this constant force. It is worth noting that for about 20 years no questions have been raised or comments offered as explanation of the widely varying collar forces produced by the Terratek and no “filtering” of data has ever been attempted. That having been raised does not imply that the Terratek results are invalid as the computer analysis confirms that the mean force will be representative of the actual anchor force.
- 19 -
300
250
Force (kN)
200
150
100
50
0 0
20
40
60
80
100
120
140
160
Time (ms)
Figure 8.
Example of a force-time response curve obtained using the Terratek.
Figure 9.
Computer simulation of the Terratek test for the yielding reinforcement element.
- 20 -
Figure 10. Computer simulation of the force-time response for the yielding reinforcement element anchor.
Figure 11. Computer simulation of the force-displacement response for the yielding reinforcement element anchor.
- 21 -
4.3.2
Positive aspects of the Terratek
The Terratek was the only hydraulic dynamic test facility reviewed and is considerably older then the other facilities. Without significant upgrades during the unit’s life, it still serves a useful purpose particularly in the testing of stope support props. The unit’s main advantages are: • cheap test costs, • fastest cycle time of any facility, • only facility capable of applying dynamic load in compression, tension or in shear by reconfiguring the set-up, and • can perform quasi-static test. It is suggested that the facility could be improved by: • Ability to perform double embedment length tests. • An instrumentation upgrade and improved analysis methodology applied with signal filtering, to allow more accurate calculation of energy absorption enhancing the value of the tests.
4.4
CSIR DROP TEST FACILITIES
Steffan Robertson and Kirsten Consultants (SRK) developed two drop test rigs for the testing of ground support and reinforcement elements in 1997 and 1998. Facilities were built through funding from the Safety in Mines Research Advisory Committee (SIMRAC) and reported in the Gold and Platinum-(GAP) Research Projects 221 and 423. These facilities used the principle of a moving mass impacting a stationary test structure or element. The drop test rigs are now based in Johannesburg at the CSIR. GAP221 Project developed the first rig for testing support system tests. It was later upgraded to include some level of instrumentation and to undertake ground support scheme tests. The facility and the results are described in GAP221 Project Report (1997), Ortlepp and Stacey, (1997), Ortlepp and Stacey (1998), and Ortlepp et al., (1999), and Ortlepp and Swart (2002). The second facility was specifically designed for testing reinforcing elements as part of GAP423 Project and is described in detail in GAP423 Project Report (1998), Stacey and Ortlepp, (1999), and Stacey and Ortlepp (2002).
- 22 -
4.4.1
Reinforcing Element Testing from Drop Test Impact CSIR
The facility constructed for the GAP423 project is shown in Figure 12. This figure is sourced from Stacey and Ortlepp (1999) (additional comments are annotated).
The facility had the capability to test
reinforcement elements and anchorage mechanism but testing did not always include appropriate surface hardware that would have to be included in a reinforcing system. The facility functions by using a free falling mass to impact a stationary “swing beam”. The impact force is translated to the outside of a thick wall pipe (that simulates borehole conditions) and head of the bolt being tested by the swing beam. Information on the facility was primarily sourced from the GAP Report 423 (1998). Of the 58 bolts tested and published in GAP 423 (1998), twelve of the bolts failed on the first impact The original GAP423 report (1998) was selected as the primary source compared with later reports, because it provides the most detailed information on the construction of the facility, test results and analysis process compared with later papers. The facility required further development after initial testing. It was considered too soft with significant energy absorption by the facility reducing the energy transferred to the bolt to an unacceptable level. Stiffening of the cross beam was reported to correct this.
Pivot bar 90mm diameter 1m long, plus its reported stiffness of 1400 MN/m. Load Cell could have been located here.
Lengths 0.6m to 2.4m 150mm high collar support, load cell could be here.
Assumption made that equal energy, one half of the impact energy distributed into the bolt and pivot bar. 0.6m test length
Possible load cell location
Figure 12. Mass drop onto swing beam to load reinforcement element.
- 23 -
“Swing Beam” 820kg, effective length 1m. Swings in a curve.
4.4.1.1
Positive aspects in the Facility
The facility has the following positive aspects: • appropriate use of thick-walled pipes to simulate rock mass confinement onto the borehole (that the rock bolt element is installed into) 63OD with 40ID or 93OD with 64ID, • simulated boreholes held in place by 150mm long clamps mounted in machined groves into the pipes above the frame and below the swing beam, • the load is applied to the outside of the pipe and would be a reasonable representation of the load applied by ejected rock to the borehole and grout within, but not the surface hardware, • the testing facility appears comparatively cheap to construct, • a reasonably high testing rate should be possible as the tests are relatively simply to set-up, • tests can be undertaken in double embedment configuration. 4.4.1.2
Limitations of the Facility
The major limitations of the facility are the processes by which load is transferred within the facility and the relative stiffness of its components (these are discussed in more detail in 4.4.1.3 and 4.5.1.4). Less significant limitations are: • minimal instrumentation and basic calculation methodology are used to assess the energy absorption capacity of the rock bolts, • no load cells are present to measure the load split between the pivot bar and test bolt. Hence the assumptions discussed in 4.4.1.3 would not be required, • load cells could have been located to record the anchor and collar forces; these locations are shown in Figure 12, • no strain gauges installed for the measurement of swing beam or support beam deflection and calculation of energy loss, • the beam does not load on the surface restraint. Bolt surface hardware is not described in detail in the report. The only application of load to the surface hardware came from either the bolt or from the outside of the steel pipe representing the borehole. Sometimes it was an overly hard surface hardware attachment to lock the toe and / or collar of the bolt. At other times it could have represented the actual plate. Failure was documented to have occurred at the toe plate or the collar plate in these tests.
- 24 -
4.4.1.3
Stiffness and energy split methodology
The GAP423 Report (1998) makes the assumption of an equal energy split into the test bolt and pivot bar. This was equated to half the kinetic energy of the drop mass at the instant of impact. By using load cells at the locations shown in Figure 12 this assumption would not have been necessary and the actual load transfer would have been possible to calculate. Testing the assumption was done by replacing the pivot bar (with a calculated stiffness of 1400MN/m) with the same bolt as that in the sample location. As both bolts were the same then it would be expected to have the same stiffness and hence behave similarly to the impact load by distributing load and displacement. The pivot bar and the sample bolt can only have equal stiffnesses if the stiffness of the sample is calculated over a short separation length, and that is then compared with the complete free length of the pivot bar stiffness (K) given by equation 2. K =
AE L
(2)
where E = elastic modulus of the pivot bar material A= area of the pivot bar L = free length of the bar For example, if E for steel is 206GPa, A of the cylinder pipe = 0.00636m2 (90mm diameter pipe) and L= 1.0m (from the pivot or load point to the anchor point), then K = 1310MN/m for the pivot bar. For a 20mm rock bolt and E=206GPa, then it has the same instantaneous stiffness only if L = 46mm. This assumes there is no debonding or stretching of the test bolt and the simulated bore hole behaves extremely stiffly in comparison to the short separation length. The split in energy distribution will change with time during the impact. The true energy split is dependent on the relative stiffness of each element (bolt and pivot bar) and how the load is initially attracted, and yielding of either the reinforcing element and / or its yielding mechanism within the borehole. 4.4.1.4
Application of impact load
Two main sources of variation in load application come from the combination of a swing beam and pivot bar, and potential non-uniformity in impact of the free moving mass onto the swing beam. The swing beam does not load the bolt in a pure axial mode as it includes a partial shear component. It is probable that this is of minor importance for low energy tests with small displacements but could be very
- 25 -
important for high energy tests with high displacements. Although the test may better represent the underground environment by including a partial shear component, there is no allowance in the calculations. If the Pivot bar is not both strong and stiff when compared with the test bolt, the rotation point can move out of the vertical axis as well as downwards. These factors introduce variation in the load applied to the sample. The coefficient of restitution at the impact surface of the free moving mass and swing beam will not be unity. Variation in the vertical component can arise from a non-uniform release, and non-controlled descent. There will also be an increase in potential energy if the mass remains in contact with the swing beam as the beam moves down. 4.4.2
Ground Support Scheme Drop Testing CSIR
The GAP221 report (1997) was the primary source for the review on the facility, and is the source for Figure 13. The facility used the impact of a free moving mass on to a load distribution system which then loads the support element to be examined - surface support system used in South African mining operations. The load distribution system consists of multiple layers of various sized cement blocks of unspecified strength. 4.4.2.1
Limitations of the Facility
The results achieved are sensitive to the load distribution device. Multiple block geometries in multiple layers increases the complexity of this device. A complex load distribution device introduces variation for repeat testing at the same facility and difficulty for other researchers that wish to use the same methodology but on different support elements. This is observed from increasing variability in the results at higher input energies. GAP221 Report (1997) leaves a number of critical points unanswered : • No measurement of force-displacement relationships and calculation of energy loss through the system. The GAP221 Report (1997) shows a non-linear relationship for the number of broken blocks and kinetic energy of the falling mass; the curve flattens with increasing energy input. This is probably related to the upper bricks not just being broken but pulverized. Breaking and pulverisation of the bricks will reduce the energy input into the support system but by differing amounts.
- 26 -
Are appropriate boundary conditions represented by securely tired off support elements to a frame. This could well be the case for continuous systems like chain link or wire rope.
Drop weight either 1048kg or 2706kg, maximum velocity, 8.5m/s at impact
The upper layers and lowest layer of blocks are restrained so that they can not spread. This is to maintain load transfer to the lower block and support element.
Deformation of the surface support was initially measured in 8 locations at the end of each test. Mesh was securely attached to the support frame to represent an “infinite” support system. Yieldable rock bolts (22mm cone) were selected, as they were not expected to fail
Load distribution pyramid Impact plate
Concrete blocks to simulate rock mass.
Pipe support for stays
Ground Anchors
Rock bolt on a 1m by 1m pattern Mesh and Fibrecrete on a 1.6m by 1.6m pattern.
Boundary condition stay ropes Cladding surface support mesh, etc.
Turnbuckle 5-10kN
Figure 13. Drop Mass for Ground Support Scheme Testing
• There is no account for inter-block reactions, and the inefficient nature of energy transmission through the blocks to the support system, in determining the capability of the support system. Capability of the support system is assessed by measuring the deflection at the centre point. Is this methodology sufficient to assess energy absorption by a support system with a highly variable load transfer device, where the load transfer device has a significant role in the amount of energy absorbed, or is it just sufficient to provide a relative ranking of support elements? • A second source of input energy not discussed is the increase in potential energy from the drop mass remaining on top of the concrete blocks and moving downwards. The large mass adds 2.6kJ of potential energy into the system for every 0.1m of displacement downwards after impact. The GAP221 Report (1997) does not discuss load transfer to the bolts in terms of the force applied, the displacement recorded or the requirement to re-install bolts. Stacey et al. 2002, state “Although yielding rock bolts (22mm cone bolts) were used in this set-up, they were not expected to yield during the test. This is due to the fact that they were deliberately over-designed so that they would
- 27 -
not need to be replaced during an extended series of tests involving more than 100 drops. In the tests, the bolts therefore did not contribute, by yielding, towards the energy absorbing capacity of the support system tested.” This was the case for kinetic impact energy between 3kJ and 70kJ. It is clear for the configurations tested there is a great difference in the relative stiffness and strength between the support and reinforcement system. GAP221 Report (1997) does not define the conditions of interlocking between the bolts and the blocks as the test was primarily designed to load the surface support element. Without this interaction it is not possible to apply tension to the bolt and concrete blocks of the load distribution device. The facility was updated and reported in a later paper (Ortlepp et al., 2002), where the 22mm Cone bolts were replaced by 16mm Cone bolts, that went through holes in the concrete blocks, allowing some load transfer if the bolts were tensioned. This is an improvement; but it does not adequately represent the portion of the bolt near to the collar. 4.4.2.2
Positive Aspects of the Test Facility
The positive aspects of the test facility include: • First facility developed for multiple tests on the one surface element, • Edge constraints to attempt simulation of large rolls of chain link wire, • Some degree of qualitative assessment of different support elements without any interaction with the reinforcing elements. The test configuration has a soft support system when compared with the reinforcement system and a large amount of fractured ground behind the support system may well be representative of some South African rockburst conditions. The test facility boundary conditions are probably configured for deep fracturing of the rock mass surrounding an excavation that is “pushed” into a soft surface support system with relatively “stiff” reinforcement elements. However, there may not be adequate connection of the support system to the reinforcing elements, hence they do not function together to control the damage from a rockburst. This could also represent South African ground support installations. However, the configuration of the test facility is not consistent with the writers’ observations in Australia where blocks are loading the reinforcing elements and the support elements or for that matter the observations of Ortlepp (1992) or Ortlepp (1997). Results were reported as consistent and repeatable, which suggests that the technique and tests may have some merit as a relative ranking for support systems; however, there was no attempt at calculating the actual energy absorption by the support element in part due to the complexity of the load distribution device, just documentation of the kinetic input energy. It is our opinion that the results from GAP221
- 28 -
Report (1997) and Stacey and Ortlepp (1999), should only be used as a relative ranking system between tests on different support elements because of the non-consistent energy loss in the concrete blocks and test frame. 4.4.2.3
Update to the CSIR Drop Test Facility for Support Elements
Ortlepp and Swart (2002) have started to address the limitations outlined above with the following statement, which provides definition of what they consider to be a rockburst event. “Considerable effort was devoted to determining the rationale on which the testing method was founded. It was decided that the distinguishing feature of rockburst damage, which is all-important in determining the testing method, is that large blocks of rock are reduced to much smaller fragments, effectively instantaneously, by the rockburst. The test set-up must therefore necessarily be based on the impulse thrusting of smallish elements of rock-like material against the containment fabric.” This statement contradicts previous extensive work in Ortlepp (1992, 1997) as well as work by Kaiser et al. (1996). Ortlepp (1992) discusses six different mechanisms of rockbursts; implosion, laminar buckling, strain burst, ejection, inertial displacement, and arch collapse. Four of these involve the movement of large blocks of ground loading the reinforcement elements, and are documented with photos and figures. Ortlepp (1997) provides photos and sketches of large slabs of rock ejected from the sides and backs of the drive, as well as complete drive closure with small particles. Where large blocks were displaced, it was not uncommon for bolts to remain. It is our opinion that most of these occurred because of inappropriate surface support element, and / or insufficient integration with the reinforcing elements. A poor selection of reinforcing element may not have allowed the rock mass to transfer load to the reinforcement system. Ortlepp and Swart (2002) attempt to integrate load cells and geophones to determine energy absorption, but do not find it possible to undertake the energy calculations. This is not unexpected, as the instrumentation was not a closed loop; only anchor forces are measured and not collar forces, or the forces in the control wires are measured. The actual monitoring instrumentation and filtering was not discussed in detail and may not have been appropriate to the task. Geophones on the support element may not provide reliable deceleration data of the element.
- 29 -
4.5
OTHER DROP TEST FACILITIES
Three other test facilities have been developed in Canada; two run by Laurentian University, Geomechanics Research Centre (GRC), publishers of the Canadian Rock Burst Handbook and one at the Noranda Technology Centre (NTC). Another facility has been developed in Sweden. These facilities are discussed in the following sections. 4.5.1
GRC Support Element Test Facility
A drop test facility for impact testing of the face restraint support systems constructed at Creighton Mine is shown in Figure 14. The comments in the section are based on Chapter Four in the Canadian Rockburst Support Handbook (Kaiser et al., 1996).
0.86m,
Pylons supporting the shotcrete panels, have a bolt 2 area of 0.72m from a 1.2m diamond pattern. The impact area is 0.28m2. The effective loading area of 2 1m is suggested from approximate crack growth.
No published load cell data. Were spherical seats used to assist in load transfer? What was the tension applied to the shotcrete panel? Base plates 127*127*9.5mm 19mm threaded bar.
Figure 14. GRC Shotcrete Test Facility - Creighton Mine
- 30 -
The facility uses direct impact of a free moving mass onto a support element, rather than a load distribution device as used by the CSIR facility. This is the primary reason why the GRC input energy was much lower than the CSIR support system test facility. The support system tested could be a panel of shotcrete, fibrecrete, or mesh plus shotcrete resting on support plates anchored to concrete pylons. The support plates sit on top of load cells, and could be tensioned from above, the tension allows some replication of the underground environment. The applied tensioned was not reported. Input energy for the tests was not clear. The unit was reported to have a maximum drop height of 4m (potential velocity 8.8m/s, kinetic energy=21.9kJ), but the maximum velocity is reported as 7.7m/s. The maximum reported kinetic energy at impact is 23kJ. This requires a velocity of 9m/s. and 7.7m/s only provides 16.7kJ. 4.5.1.1
Positive Aspects of GRC Support Element Test Facility
The following positive aspects about the GRC facility are noted: • A quick set-up time, simply involving changing panels between tests, should have been possible; • once the facility was established, testing of support elements should have been relatively cheap • element size was reasonable to represent edge conditions • the facility was well instrumented and should have given a more reliable assessment of the energy consumption when compared with South African facilities. • tension could have been applied to the support element to attempt simulation of underground conditions although the reinforcing system was not fully represented. 4.5.1.2
Limitations of GRC support element test facility
Limitations of the system involve the integration of the reinforcement element to support element and the energy absorption calculation process. • the facility tests the performance of the surface support element from a direct impact of a falling mass and not the interaction of the surface attachment to the reinforcing element. • flat plates controlling the support test element on top of the load cell were 127mm * 127mm * 9.5mm, (cable bolt plates) reported as suffering damage on occasions. The load cells only report loads of 30kN to 120kN.
- 31 -
To quote Kaiser et al. (1996) “The columns used to support the test panels were relatively stiff and dissipated little of the total impact energy.” This implies that most of the energy was lost in plastic deformation of the support element, before load could be transferred to the load cells or, alternatively, the instrumentation did not function correctly. The relative stiffness and strength of the support element compared with the pillars will determine the load transfer pickup by the load cells. It is apparent that the support elements will deform plastically. Therefore other means of calculating the energy absorbed should be undertaken. The energy was described in terms of the maximum impact energy rather than calculating the actual energy absorbed by the shotcrete combinations. The civil engineering application of Yield Line Theory for calculating the energy absorption in concrete and fibrecrete panels from a centre deflection point has a potential application in determining the dynamic energy absorption (Kennedy and Goodchild, 2003). Again, to quote form Kaiser et al. (1996): “For the impact tests, the area of shotcrete directly involved in absorbing the kinetic energy was about 1m2.” The allocation to simplify the impact energy so it can be directly related to Jager’s (1992) requirements for energy absorption per square metre for rockbursts needs to be carefully considered when the actual impact area of the falling mass was only 0.28m2. Jager’s minimum requirements for a scheme was 25kJ/m2, but he stated that 50 kJ/m2 was a better specification in cases where the yielding elements are expected to withstand at least 25kJ/m2. The square metre by Kaiser et al. (1996) was defined from the approximate area of the fracture growth after the impact. This assumption would only hold for a limited set of conditions – changing the actual impact area, the bolt spacing, or the test element would all be expected to change the crack growth. Perhaps a more appropriate solution would have been to report the actual area of the crack growth from each test rather than assuming a uniform square metre. Of course the assessment of crack growth is only practical with plastic deforming materials or easily assessed plastic deformation. There is no consideration for the elastic deformation or flexing and recovery that the support element mesh would have. The application of numerous high capacity strain gauges to assess the area of deflection or three-dimensional analysis of the deformation surface would have provided a higher degree of numeric accuracy. The bolt spacing at 0.72m2 is actually quite tight, and may be applicable for Canadian operations but would be significantly closer spaced than the bolt geometry used in Australian operations.
- 32 -
4.5.1.3
Comparison of Support Element Tests
The load transfer mechanism, boundary conditions and mounting of the support element of the GRC facility at Creighton Mine and CSIR drop test facility are significantly different.
No quantitative
comparison of results should be undertaken between the two facilities. It is also likely that a qualitative comparison will not be possible. 4.5.2
Laurentian University, Face Plate and Reinforcing Element Test Unit
A test apparatus developed at Laurentian University is shown in Figure 15. The figure and following discussion are based on the paper from Yi and Kaiser (1994). The facility used a scaled version and full scale bolts. Practitioners need to decide if the loading mechanism of a free mass impacting a stationary plate really does simulate what happens in a rockburst in a mine. 4.5.2.1
Positive Aspects of the Facility
The positive aspects of this facility are: • Appears cheap to construct, • Cheap and fast to run test on various systems The beneficial assessment from the use of the rubber plates in reducing the stress transfer by softening the reinforcement system has good practical application. Australian examples of the application are described by Li et al. (2002) and Player (2004). 4.5.2.2
Limitations of Facility
The limitations of the facility are ; • Installation of the reinforcing element is not considered apart from a point anchor and an open hole. However the hole is not simulated. • The drop height and drop mass were limited, and as such the facility could not break any of the tested bolts on the first attempt but rather multiple drops. The facility was designed to use tensioned bolts, although the installed tension was not reported.
- 33 -
Figure 15. Laurentian University Drop Unit.
- 34 -
4.5.3
Noranda Technology Centre Drop Unit.
This facility uses the same approach as the Laurentian University, dropping a free moving mass down the shaft of the bolt to impact on the surface plate. In this facility the bolts are full scale. However, the calculation approach advocated by Gaudreau (2004) attempts to use a closed form solution for a plastically deforming element. The calculation model is not accurate and can be clearly seen from the results that it does not represent the important first spike in load on the reinforcement element, particularly the Modified Cone Bolt. It is this spike in load which is responsible for breakage of threaded bars and cannot be simply ignored; as such it is not recommended to follow the analysis technique advocated for the calculation of energy absorbed in his model. It was not clear if the reinforcing unit can be tensioned. The ability to tension the surface plates against the bolt is a key item as this is the situation underground. All threaded bolts have an installed tension, and there would also be an additional tension from ground movement loading the plate. A computer program written by co-author Alan Thompson has shown that the theoretical response of reinforcement systems is affected by both the mechanisms of load transfer between the reinforcement element and the internal and external fixtures, the rock, and the force existing in the element when subjected to an impact loading. 4.5.4
Swedish Test Facility
This test facility was constructed and described as part of the research work by Ansell (1999). The facility was only used for tests on 6 bolts. The test configuration and its analysis techniques are inconsistent with what happens in reality. The approach of using a closed form solution for plastic deformation is also not considered to be validated. It is considered that data of limited value was achieved from the 6 drop tests.
4.6
Summary
An assessment of these test facilities in regard to a number of factors and, especially, in regard to the WASM Dynamic Test Facility will be presented in Section 12.
- 35 -
5
CONCEPT OF TEST FACILITY BASED ON MOMENTUM TRANSFER
The purpose of the tests performed in the WASM Dynamic Test Facility is to answer two main questions: • How is the released seismic energy absorbed by the ground support scheme or its elements? • How do the support and reinforcement elements transfer dynamic loads? The design of the facility required consideration of multiple key components and their interaction. These were; • Sufficient strength in the engineering design and physical dimensioning of the facility to withstand the impact loads during testing. • Whether the ground support scheme absorbs the energy or the energy input fails the scheme. • Determination of energy balance during the test from force displacement response curves. This required the design of instrumentation and monitoring points to provide multiple independent measurement methods of key parameters. • Knowledge of the energy consumed by elements in the ground support scheme and the test facility impact surface. • Calculation of the maximum input energy and the relative energy split between the simulated ejected block and the impact surface. The impact surface and the reinforcement system will have different relative loading stiffness, and these may influence the other’s response to dynamic loading.
5.1
PROTOTYPE
Figure 16 shows the prototype unit capable of multiple ground support schemes. The unit was composed of a drop box, release point, guides and impact legs. The prototype box would slide down the guides and the legs would hit an impact surface rapidly stopping the box. The impact brings the box to rest, but the free moving load of gravel (representing the rock mass) dynamically loads the wire mesh and bolts. This occurs because the gravel has momentum.
- 36 -
Release point Box Guides and legs
Figure 16. WASM Prototype dynamic loading of ground support scheme.
5.2
HOW MOMENTUM TRANSFER RELATES TO “REALITY”
The momentum transfer concept is considered to replicate a seismic event loading by examining the way energy travels through rock. The basic seismic source parameters Moment Energy and Radiated Energy are calculated as functions of the P and S waves. The waves have amplitude, frequency and a rate of travel. Seismic waves originate from an instability and travel through the rock mass. The instability (seismic source) will be located at a distance from the excavation greater than the fractured zone. As the waves approach the excavation, the stable rock that will remain behind after the event, the rock that will be ejected with the event, and the ground support scheme, are being ‘excited’ by the energy in the waves. This is shown schematically in Figure 17.
- 37 -
Ground control scheme Rock mass
Seismic wave amplitude frequency
Rock to be ejected
Drive
For an instant before ejection, the rock mass, the ground control scheme and block to be ejected / fragmented will all be excited, and then ejection commences
Figure 17. Schematic representation of the behaviour of rock when subjected to seismic loading. This is best represented by applying energy to our artificial rock mass and reinforcing element, by dropping them both together. A process of ejection then occurs of the already existing fractured ground, or freshly fractured ground due to the interaction of the energy waves and the distributed stress field about the excavation and the excavation itself : • amplification of the wave encountering the fractured zone around the drive. Spottiswood et al. (1988) suggest a factor of 2.5 increase in PPV from the incoming wave, GAP201 report lists various amplification factors from 1.8 to 10 for different mine sites. • reflection of the wave from the excavation surface, causing tensile failure in the rock mass and ejection. In both these cases a block will detach from the surrounding rock mass that is being excited by the P and S wave energy. The rate of detachment is likely to be related to the frequency of the waves rather than occurring instantaneously. The block is not instantaneously ejected from the surrounding ground, and actually has a velocity from the wave travelling in the rock mass prior to ejection. It is not appropriate to apply the load instantaneously, but rather very quickly. The loading is provided by the relative velocity between the collar and the anchor as discussed in Section 6.1.6.
- 38 -
The upper photos in Figure 16 show the results of a typical prototype test. The mesh supported by four corner bolts has deformed in the middle following impact. The lower photo in Figure 16 is prior to testing and shows an alternative scheme with one centre bolt. Regardless of the scale of the test unit, the system must work in a repeatable manner for consistency of energy transfer to the reinforcement and support system.
6
WASM DYNAMIC TESTING FACILITY DESIGN AND CONSTRUCTION
The intention was to design and construct a dynamic test facility to test reinforcement systems, support systems and complete ground support schemes used in Western Australia. The facility will be utilised by WASM, the mining community, and manufacturers of ground support scheme elements. The design and establishment of the dynamic test facility used a logical and engineering approach. This required a number of steps: • new idea for dynamic loading ground support systems. • develop prototype to test idea. • determine energy inputs and scale of tests, whether it was worthwhile building a quarter scale model or go to full scale. • conceptual design of the test facility. • project proposal and plans to obtain industry and government funding. • engineering design of test facility and its components; foundation block, building, guide mechanism, drop beam, buffers, release mechanism. • instrumentation requirements to determine the energy balance by monitoring all required forces, accelerations, displacements, strains and capture of the test on digital video. • calculation methodology requiring the filtering of instrumentation signals, and the assessment of force displacement curves to calculate energy absorbed by system elements.
The calculation
methodology is described in Section 9.
6.1
DESIGN FACTORS
A number of key design factors required simultaneous consideration, as a modification to one factor would influence another.
These in turn would influence the required instrumentation and calculation
methodology.
- 39 -
6.1.1
Simulation of Rock Burst Event by Dynamic Loading
A rock burst is simulated by creating dynamic loading of the components of the reinforcement systems, face restraint and surface support which comprise the ground support scheme. The concept of momentum transfer and loading was described in the previous section and demonstrated through the use of the small scale prototype tests. The momentum transfer could be to just the reinforcing system or the support system dependent on the components being tested. 6.1.2
Energy Input, Size and Scale
To remove any questions involved in scale-up issues and mechanics, and the problems in construction of half or quarter scale rock bolts, a decision was made early in the project that all testing should be done on full-scale rock bolts and surface support elements used (or that could be used) by the Western Australian mining industry. The kinetic energy applied at impact defines the maximum energy available. KineticEne rgy total = 12 mtotal
2 vimpact
(3)
The total dropped mass cannot exceed 4500kg and a maximum velocity of 10m/s. This equates to 225kJ. The weight of the simulated ejected rock loading a reinforcing system is of the order expected in a rockburst event. Yielding reinforcement systems (e.g. Cone bolts) have a typical installation of a 1.0m2 pattern, and depths of ejection are approximately one metre. Hence, a cubic metre is an appropriate base volume for consideration. The unit is capable of testing any 2.4m long reinforcing element with a maximum yieldable displacement of 0.8m. Longer elements can be tested depending on the required maximum yield to be assessed and configuration of the test. 6.1.3
Drop Beam Size
A consultancy firm specializing in dynamic load calculations through engineering structures was commissioned to specify the drop beam size, reinforcing flanges and webs. The criterion applied to the beam in dynamic loading conditions was 1mm centre deflection at the maximum load from a reinforcing element. The response of the buffers to the impact load was also included in the modelling of the test system. 6.1.4
Buffers and Energy Dissipation
While recognizing all dynamic test facilities have energy losses it is not adequate to report the maximum kinetic energy at the impact of a free moving body onto a stationary body. An understanding of the way the energy dissipates is achieved by undertaking an energy balance.
- 40 -
Equation 3 incorrectly assesses the energy that a reinforcing element is subjected to, as it also includes the energy taken out by the buffers. Thinking in terms of kinetic energy absorbed by the reinforcement system, Equation 3 can be modified to Equation 4. KineticEnergyabsorbed = 12 mejectedrock
v2
relative
(4)
The mass of the simulated ejected rock is represented by the steel rings and lower pipe length. The relative velocity is the difference between the simulated ejected rock and the simulated rock mass, as described in Section 6.1.6. Each major component of the system will have force-displacement curves, which must be calculated and or measured. These force-displacement curves provide the best descriptions of the energy absorbed. Correct buffer energy dissipation is calculated by the area under the force displacement curve. Buffer displacement is measured either directly from sensors or indirectly from double integration of the accelerometer on the drop beam. Load cells on top of the beam measure the force or it can be calculated by a full expansion of the force, mass and acceleration relationship as described in Section 9. Initial specification of the impact velocity on the buffers was 10m/s. The supplier later adjusted this to 6m/s.
To date, testing buffers at 7m/s without apparent buffer damage has been successful.
Commissioning tests indicate the buffers absorb between 40% and 50% of the total impact energy which also includes the energy of the beam. The energy absorbed by the reinforcement may be as high as 80% of the nominal energy of the mass prior to beam impact with the buffers. 6.1.5
Integration of ‘Ejected Rock’
It is important that the real life interaction between a rock mass and a borehole is correctly simulated, as detailed in Figure 18. Bolting of steel rings to the solid base plate on which the lower pipe segment rests results in a single mass. The reinforcing element protrudes through the base plate, and is tensioned with the appropriate surface hardware. The base plate with the end of the reinforcing element, with appropriate surface hardware, and instrumentation is shown in Figure 19.
- 41 -
Load Cells between Pipe Flange and Beam
Pipe Flange Not to scale diagram of the drop beam, reinforcing element, and the rock mass. The surface plates and instrumentation are shown in Figure 19
Beam
Reinforced Pipe Interface
50 kg circular steel plates Split Plate used for lifting mass above it
Solid base plate for instrumentation and surface hardware attachment
Ring welded to lower pipe
Figure 18. Schematic of load transfer rings and integration with the steel pipe.
Simulated Rock Loading (Steel Plates)
Rubber Plate
Deformed Rock Bolt Plates 10,000g shock Accelerometer Force ring replaced by a Load Cell
Figure 19. Base Plate, Surface Hardware and Instrumentation
- 42 -
6.1.6
Relative Acceleration, Velocity and Displacement
The maximum drop velocity is not the velocity that the simulated ejected mass will impose on the reinforcing system. The relative velocity occurs between the drop beam slowing down by the buffer action and the “ejected mass” loading the borehole and the surface restraint. The relative velocity prior to the impact will be zero, and will be zero again once the buffers have reached maximum compression for a particular energy input and the reinforcement system has been able to sustain the impact loading and associated energy. If the reinforcement system fails, then the mass will continue moving with both velocity and acceleration due to gravity. 6.1.7
Bolt Length and Support Area
The facility is capable of testing any 2.4m long reinforcing element with a maximum yieldable displacement of 800mm. Longer reinforcing elements can be tested but the length will depend on the required yield to be assessed. The initial testing program of reinforcing elements includes 22mm diameter Cone bolts, 20mm diameter thread bar, 15.2mm plain strand cable, Garford yielding cable bolt, and 46mm Split Set. Other bolts that may be tested include resin anchored rock bolts and Swellex bolts. The facility has the capacity to test ground support schemes with maximum surface area of 1.5m by 1.5m with four rock bolts on a 1.2m by 1.2m pattern. 6.1.8
Borehole Simulation
Appropriate borehole rock mass stiffness can be simulated by the use of thick wall piping (Hyett et al., 1992). For a “thick walled” pipe subjected to internal pressure (pi), it can be shown that the internal radial outwards deformation (ui) is given by
⎛ ⎞ ⎜ ⎟ 2 ⎜ ⎟ ( 1 + νr ) ⎟ u i ⎛ ri ⎞⎜ (1 − ν r ) ⎛⎜ ri ⎞⎟ =⎜ ⎟ + pi ⎜⎝ E r ⎟⎠⎜ ⎛ ⎛ ⎞2 ⎞ ⎜⎝ r o ⎟⎠ ⎛ ⎛ r ⎞2 ⎞ ⎟ r i ⎜ ⎟ ⎜1 − ⎜ i ⎟ ⎟ ⎟ ⎜ 1− ⎜ ⎟ ⎜ ⎟ ⎜ ⎟ ⎜ ⎜⎝ r o ⎟⎠ ⎟ ⎟ ⎜ r o⎠ ⎝ ⎝ ⎠ ⎝ ⎠⎠ ⎝ where
Er
=
Young’s modulus for confining material
νr
=
Poisson’s ratio for confining material
ri
=
internal radius of hole
ro
=
external diameter of confining material
- 43 -
(5)
To simulate an “infinite rock mass”, one can substitute ro = ∞ Then
ui ⎛ ri ⎞ = ⎜ ⎟(1 + νr ) pi ⎜⎝ E r ⎟⎠
(6)
Accordingly, equations 5 and 6 can be used to estimate the equivalent rock stiffnesses for different dimensions of the steel pipes used in laboratory tests. Table 1 shows the selected internal steel pipe diameter to equivalent underground applications, and equivalent rock mass stiffness.
Table 1.
Effective Pipe Stiffness
Bolt to Test
22mm Cone Bolt 20mm Thread Bar 15.2mm Plain Cable Yield Cable 46mm Split Set* Rock
Internal Pipe Diameter 45mm 45mm 76.3mm 76.3mm 82mm 45mm
Wall Thickness
9.3mm 7.8mm 12.8mm 12.8mm 9.2mm Infinite
Stiffness (MPa/mm)
Equiv Rock GPa
1389 1209 703 703 472 1174
80.6 70.2 69.2 69.2 49.9 65
* This is does not included the grout to simulate the rock mass. The grout has a 45mm hole, into which the Split Set is Jumbo driven.
- 44 -
6.2
CONSTRUCTION
OF
TEST
FACILITY
AND
ACQUISITION
OF
EQUIPMENT The test unit was built on land donated by Kalgoorlie Consolidated Gold Mines. The size of the facility is substantial, as it needs to replicate the energies involved in a rockburst. Undertaking the construction and commissioning of the dynamic test facility was planned to be in two phases. The first phase required; 1.
Design of a dynamic test facility and its components, using the WASM momentum transfer concept to provide repeatable tests to simulate a rockburst.
2.
Construction of the test facility, capable of undertaking tests of reinforcement systems and face restraint.
3.
Development of instrumentation for the rock reinforcement systems.
4.
Dynamic testing to simulate rockburst loading on rock reinforcement systems.
A second future phase will modify the test equipment and instrumentation to perform tests on integrated ground support schemes. The facility had a number of key components involved in the construction and acquisition stage; major foundation block, superstructure for environmental protection, guide rails for the drop beam and mass, the drop beam, buffers / impact surface, and the release mechanism. The construction sequence for the facility is detailed in the following sections. 6.2.1
Foundations and Building
The design of the major foundation block was to withstand a direct impact at maximum velocity and mass without failure or damage to the foundations. Realistically, repeated direct impact on the foundations would cause the foundation block to deteriorate. The foundation block is heavily reinforced with steel bars and panel fibres (Figure 20). The foundation block has an isolation layer from the remainder of the facility to minimise vibration loading of the test building. The test building is fifteen metres long by eight metres wide. The rear section of the building is 10m high and houses the drop crane and test pit (Figure 21).
- 45 -
Figure 20 Detail of the foundation block, with tie-down bolts for buffers and guide rails.
Crane beam
Foundation block
Figure 21. Building construction.
- 46 -
Guide rails
6.2.2
Guide Rails
The guide rails for the drop beam are six metres high. This allows a maximum impact velocity of 10m/s. This height also takes into account the height of the buffers and depth of the beam. The guide rails were designed to withstand any potential failure of the guide system at impact of the beam onto the buffers. The I-beam guide rails use a slider and shoe system similar to those used for lifts in multi-storey buildings. The guide rails, direct the beam during the free fall and control the beam at impact (Figure 21 and Figure 22). 6.2.3
Drop Beam
The drop beam was constructed from a 610UB101 steel section. Additional webbing was fitted at the impact point. Side, top and bottom panels in the middle of the beam were used to control bending from bolt loading. This strengthened the centre cut out for the simulated borehole. A thick-walled pipe was welded into the middle of the beam in order to accommodate the simulated borehole. End plates are welded onto the beam to attach the guide shoes. Both Figure 22 and Figure 40 show the drop beam. 6.2.4
Release Mechanism
A helicopter release hook was chosen for the release mechanism, for the following reasons; the release hook load carrying capacity, inherent safety in the aeronautical design, and ease of working with the beam and mass, and the ability to release the mass from a remote safe distance. The hook was combined with a shock absorber in order to substantially reduce any dynamic loading of the crane beam and building (Figure 22).
Guide rails for beam and box
Drop pit and trench
Helicopter release hook at the end of crane chain
Drop beam
Figure 22. Photograph showing guide rails, drop beam and release mechanism.
- 47 -
6.2.5
Impact Buffers
The choice of impact surface required the selection of an engineered and repeatable rapid deceleration of the drop beam at impact. The Oleo buffers provide this response. Direct impact onto the foundation block or into a sandbox does not provide this response. The principal of the Oleo buffer is driving an orifice over a metered pin in an oil filled well (Figure 23). Dissipation of the energy occurs through turbulent flow and heating of the oil. Normal applications of these buffers are rail rolling stock and aircraft landing gear. There is an expectation that changing the impact velocity, ‘ejected rock’ mass, and reinforcement system will load the buffers in subtly different ways. The relative stiffness and strength of the buffers compared with the reinforcement element is an influential process in the dynamic load transfer to the reinforcement system. It is possible to alter the “stiffness” of the buffer response by having a mass on top of the buffer. This occurs because the effective plunger mass will be larger and require a higher momentum to commence movement. It is also possible to use alternative impact systems.
gas plug
plunger
nitrogen
separator
plunger base orifice
oil metering pin
cylinder
Figure 23. Section of Oleo buffer, from www.oleo.co.uk.
- 48 -
7
SIMULATION OF THE WASM DYNAMIC TEST FACILITY
A theoretical simulation of the WASM Dynamic Test Facility was developed to aid in the interpretation of testing results.
The simulation provides an “independent” assessment of the component energy
distributions throughout the duration of a test. It will be seen later in the report, that the outputs form the theoretical predictions and the testing results can be compared directly.
7.1
METHODS OF SIMULATION
The analysis of the dynamic behaviour and interaction between components of a system may be approached using a number of apparently different methods. However, it can be shown that these methods are equivalent and the method most amenable to developing algorithms can be chosen and implemented as computer code. As an example, consider a mass (m) travelling with velocity (v). Assume that the block will be retarded by a constant force(FR). How long will it take (Δt) and how far will the mass travel (s) before coming to rest? The change in momentum (mΔV) is equal to the impulse of force. The impulse is equal to the retarding force (FR) multiplied by the duration (Δt) for which it acts. mΔV=FRΔt The retarding force causes a deceleration (a) given by a = FR/m The velocity after impact V = aΔt The energy (E) after impact is given by E = ½ mV2 7.1.1
Approach 1 – Momentum
Initial momentum is mV and the final momentum is zero Therefore change in momentum is mV. Time to arrest t = mV/FR Average velocity = ½ V (constant deceleration) Then s= ½ mV2/ FR
- 49 -
7.1.2
Approach 2 - Newton’s Second Law
Distance travelled is given by s= Vt + ½ at2 Where a is the deceleration given by a = -FR/m t = (0-V)/a = Vm/FR Then s = mV2/FR – ½ mV2/FR = ½ mV2/FR 7.1.3
Approach 3 – Energy
Work done by force = FR s Then s = E/ FR = ½ mV2/ FR 7.1.4
Summary
All three approaches give the identical result. Also, the result is independent of the initial acceleration when motion is retarded. It was decided that using Newton’s Second Law would provide the easiest solution.
7.2
COMPONENTS
Figure 24 shows a schematic of the major components of the WASM Dynamic Test Facility. These components can be simplified to three major components that represent the reinforced rock in an underground mining application; namely: • The Reinforcement System. • The Collar Zone. • The Anchor Zone. In the field, the latter two components correspond to a detached block of rock and stable rock, respectively. The test facility attempts to simulate the loading on the reinforcement system within and between these two zones. The following three sections describe each of these components in more detail. 7.2.1
Reinforcement System
All reinforcement systems are contained within two abutting steel pipes. The lower, collar pipe simulates the collar zone of the reinforcement system and the upper, anchor pipe simulates the anchor zone.
- 50 -
Flange welded to anchor pipe
Stiffened Deep Beam
Reinforcement Interface Flange welded to collar pipe
Loading mass comprising steel disks clamped to flange
Buffer
Buffer External Fixture
Plate
Figure 24. Schematic of new testing facility showing the major components and their arrangement.
7.2.2
Collar Zone
The collar zone consists of the collar pipe and a welded steel flange to which the loading mass (comprising a number of separate steel plates) is clamped. The reinforcement system plate is clamped between the loading mass and the external fixture. 7.2.3
Anchor Zone
The anchor zone comprises a deep, stiffened steel beam to which the anchor pipe is connected. The reinforcement system transfers load from the collar pipe to the anchor pipe. The anchor zone behaviour is directly affected by the beam impact surface. Initially, commercially available hydraulic buffers were selected to protect the concrete foundations during commissioning of the test facility. A number of methods are available to modify the behaviour of these buffers when greater experience has been obtained in using the new testing technique and facility. It is also possible to replace the buffers with other devices that have different responses to impact.
- 51 -
7.3
REINFORCEMENT LOAD TRANSFER MECHANISMS
In order to design the testing facility instrumentation and to simulate reinforcement testing, it was necessary to define the component interactions, load transfer mechanisms and forces shown in Figure 25.
½TEA
½PA
½TEA
½P
FR
A
½mAg
½mAg
½TA
½T PS
PS
mBg
mBg ½PJ
PB
½PJ
ANCHOR ZONE
PB
FRJ
COLLAR ZONE ½PJ
½PJ
½TC
½TC
½mCg
½PCP
½mCg
½PCP
FRC
½PEP
½PFP
½TEC
½TEC
Figure 25. Schematic of load transfer mechanisms for a reinforcement system in the WASM Dynamic Test Facility.
- 52 -
The symbols used in this figure represent: mA -
mass of beam.
mP -
mass of anchor pipe.
mC -
loading mass (including collar pipe).
mB -
mass of buffer piston.
FRA -
element force at a discrete internal fixture.
FRJ -
element force at the interface between anchor and collar zones.
FRC -
element force at the collar fixture.
TEA -
load transfer between element and wall of pipe (or borehole) at a discrete anchor.
B
TA
-
load transfer between element and wall of pipe (or borehole) in anchor zone.
TC
-
load transfer between element and wall of pipe (or borehole) in collar zone.
TEC -
PJ
load transfer between element and fixture. force transfer at the interface between the anchor and collar zones.
PCP -
force transfer between the collar zone and plate.
PEP -
force transfer between the fixture and the plate at the collar.
PA
-
force transfer between anchor pipe and beam.
PS
-
force transfer between the beam and the buffer.
-
internal buffer force.
PB B
Reinforcement system displacements and deformations that occur during testing are an important aspect of the analysis. The global displacements of the components and the internal reinforcement system displacements are shown schematically in Figure 26.
- 53 -
wRA uA
wRJA
wRJ
wRJC
uC
wRC wPC wRE uPL
wEP uRE
Figure 26. Displacements and deformations of components and reinforcement system in the WASM Dynamic Test Facility. In this figure, the symbols represent: uA
-
displacement of the beam (after impact assumed to be also the displacements of the upper pipe (uP) and the buffers (uB)). B
uC
-
displacement of collar pipe.
uPL
-
displacement of plate.
uRE
-
displacement of external fixture
wRA
-
displacement of reinforcement anchor/free end relative to anchor pipe.
wRJ
-
reinforcement displacement across interface.
wRJA -
displacement of reinforcement relative to anchor pipe at interface.
wRJC -
displacement of reinforcement relative to collar pipe at interface.
wRC
-
displacement of reinforcement relative to collar pipe at collar.
- 54 -
wRE
-
displacement of reinforcement relative to external fixture.
wEP
-
displacement of fixture relative to plate.
wPC
-
displacement of plate relative to collar pipe.
Note that for certain types of reinforcement systems, some of the load transfer mechanisms and displacement will not be relevant. For example, if a system does not have a discrete anchor, then FRA = 0 and the load transfer in the anchor zone is TA. On the other hand, for a bolt anchored by an expansion shell alone, TA = TC = 0. In other cases, there may be no plate and external fixture at the collar. The symbols shown in Figure 25 and Figure 26 and defined in this section are all used in the formulation of the simulation and analysis of reinforcement system response to dynamic loading. Some of the symbols are used in the captions to figures to indicate where measurements of displacements, accelerations and forces are made.
7.4
DESCRIPTION OF THE TEST PROCEDURE
In order to simulate the test facility, it is first necessary to qualitatively describe the mechanisms associated with various different phases in the test and to then attempt to model these using well-established computational models for the particular mechanism. The phases of the test can be summarised as follows: 1 The beam, reinforcement and loading mass assembly are lifted to a known height above the reference surface (uncompressed buffer piston). 2 The complete assembly is dropped. 3 The beam impacts on the buffer piston (the behaviour instantaneously is governed by the impact equation). That is, Impulse = Change in Momentum which mathematically is:
∫ F dt = mΔv
(7)
It is assumed during impact that the mass is the beam and upper pipe. 4 After impact, the beam will be moving more slowly and the buffer piston will be moving. Momentum will be conserved. However, there will be energy lost in the impact and the new velocities of the beam and buffer piston will depend on the notional coefficient of restitution (e) for the contacting surfaces. The coefficient of restitution is defined by:
e =−
(VAt − VBt ) (VA 0 − VB0 )
(8)
- 55 -
where VA is the velocity of the beam, VB is the velocity of the buffer piston, and the subscripts 0 and t B
are
these
velocities
before
and
immediately
after
impact,
respectively.
This equation, combined with the conservation of momentum equation: mAVA0 = mAVAt + mBVBt
(9)
B
enables the calculation of the velocities of the beam and buffer piston immediately after impact. It is possible that immediately after the initial impact, the piston will for a very short time move more quickly than the beam until the internal resistance slows the piston. 5 After the internal resistance slows the piston, it is assumed that the beam and buffer mass are in contact. The behaviour at the contact between the beam and buffer mass is controlled by the response of the thin, stiff rubber pad. This pad is used to eliminate metal to metal contact at this location and to minimise the noise sensed by the accelerometers during and following the impact. 6 As the beam slows, the relative velocity between the collar zone (being loaded by the mass) and anchor zone (being restrained by the beam and buffers) will increase from zero. 7 The relative velocity will result in relative displacement across the interface between the collar zone and the anchor zone and force will develop in the reinforcement system. 8 The force in the reinforcement system will now attempt to retard the loading mass and to accelerate the beam. The acceleration of the beam will be resisted by the buffers and the inertia of the beam.
7.5
COMPONENTS
As indicated previously, the dynamic testing facility can be assumed to consist of three major components: • The Reinforcement System. • The Collar Zone. • The Anchor Zone. For the purposes of analysis, the anchor zone is separated into the beam and the buffers. 7.5.1
Reinforcement System
For evaluation purposes, the reinforcement system response is defined by the force displacement at the interface between the anchor and collar zones. The segmental non-linear (“elasto-plastic”) response for a rock bolt with a yielding anchor is shown in Figure 27. This response curve is based on the results obtained for the test to be described in Section 4.
- 56 -
Figure 27. Force-displacement response of a yielding reinforcement system.
7.5.2
Loading Mass
The loading mass is assumed to be rigid and is coupled to the lower collar zone pipe. The loading mass also interacts with the external fixture of the reinforcement system. 7.5.3
Beam
The beam is assumed to be rigid and coupled to the upper anchor zone pipe of the reinforcement system. This has been confirmed in tests where the measured strains in the beam are extremely small. 7.5.4
Buffers
The buffers are designed to dissipate energy by high speed flow of hydraulic fluid through an orifice. For the particular type of buffer chosen, the orifice area decreases as the buffer compresses. This results in higher velocity of fluid flow and higher energy losses as the buffer compresses. The actual variation of orifice area and piston displacement and an approximate relationship (ignoring fluid compressibility) between pressure and velocity were obtained from the buffer supplier. The static (i.e. velocity =0) response of the buffer is shown in Figure 28 while the response to an impact of 1000kg at 10m/s (50kJ) is given in Figure 29.
- 57 -
350 Advance
300
Retract
Force (kN)
250 200 150 100 50 0 0
20
40 60 80 Displacement (mm)
100
120
Figure 28. Static response curves for a buffer.
800 700
Force (kN)
600 500 400 300 200 100 0 0
20
40 60 Displacement (mm)
80
100
Figure 29. Theoretical force-displacement response of a buffer subjected to an impact energy of 50kJ from a mass of 1 tonne. 7.5.5
Impact Surface Response
The impact surface between the buffer piston and the beam comprises a hard rubber pad, approximately 10mm thick. At this stage, it is assumed that the total pad compression is negligible compared with other component displacements.
- 58 -
7.6
COMPONENT INTERACTIONS
The forces acting on each component shown in the free body diagram (Figure 25) can be used in a time stepping analysis method to predict the behaviour of all the components during a simulated test. The equations of motion at each time step are: Buffer Mass:
mB &u&B = m B g + PS − PB
(10)
Beam:
mA &u&A = mA g + FRJ − PJ − 2 PS
(11)
Upper Pipe:
mP &u&P = mP g + FRJ − PA
(12)
Loading Mass:
mC &u&C = mC g − FRJ + PJ
(13)
The loading mass includes the mass of the collar zone pipe. In the test facility, there are load cells between the beam and the anchor zone pipe. The buffer mass is currently assumed to be the mass of the piston. It is possible to increase the buffer mass and to modify the buffer response at and subsequent to impact.
7.7
METHOD OF SOLUTION
In order to solve the generally non-linear response of the system after impact, there are several techniques that have been used or are being evaluated. These range from a simple finite difference application of Newton’s second law to Newmark’s method (e.g. Chopra 1995). The finite difference approach assumes that forces (and consequently accelerations) do not vary during the time increment. On the other hand, Newmark’s method assumes that the changes in acceleration ( Δ &u& t ) and velocity ( Δ u& t ) during a calculation time interval (Δt) may be expressed in terms of the change in displacement (Δut). The form of these relations are:
Δu t − u& t − &u&t Δ&u&t = β Δt 2β β (Δt )2
(14)
γΔu t γu& t ⎛ γ ⎞ Δu& t = βΔt − β + Δt⎜⎜1 − 2β ⎟⎟ &u&t ⎝ ⎠
(15)
where &u& t and u& t are, respectively, the acceleration and the velocity at the start of the time increment.
- 59 -
The differential form of the equation of motion for a mass (m) interacting with a spring with stiffness (k) and dashpot with damping coefficient (c) is: m Δ&u& t + c Δu& t + k Δu t = ΔP
(16)
where ΔP is the change of external force. Substituting from Equation 14 and Equation 15 into Equation 16 and re-arranging gives: ⎛ u& &u& ⎞ m⎜⎜ t + t ⎟⎟ + 2β ⎠ ⎝ βΔt Δu t = m β Δt
⎛ γu& t ⎛ γ ⎞ ⎞⎟ ⎟ &u& + Δt ⎜⎜1 − c⎜ ⎜ β 2β ⎟⎠ t ⎟ ⎝ ⎝ ⎠ cγ + + k 2 β Δt
(17)
( )
where
γ = 1/2
and
β = 1/4 constant acceleration
or
β
= 1/6 linear change of acceleration.
Further, equation 17 can be considered to be of the form Δut = ΔP′/K′, where ΔP′ is equivalent to an out-ofbalance force and K′ is equivalent to an instantaneous stiffness of response to movement at the start of the time increment. The simultaneous equations of motion (Equations 10 to 13) can be represented in matrix form as: ⎡ 2K 'B ⎢ ⎢− 2k ' S ⎢ ⎢ 0 ⎢ ⎢ 0 ⎣
'
− 2k S
0
'
− kA
'
KA '
'
'
− kA
KP
0
− kR
where K B ,
'
'
KA , K 'P
0 ⎤ ⎡ Δu B ⎤ ⎡2ΔP B⎤ ⎥⎢ ⎥ ⎥ ⎢ 0 ⎥ ⎢Δu A ⎥ ⎢ ΔPA ⎥ ⎥⎢ ⎥ ⎥ = ⎢ ' ⎥⎢ − k R ⎥ ⎢ Δu P ⎥⎥ ⎢⎢ ΔPP ⎥⎥ ' ⎥ K R ⎦ ⎢⎣ Δu P ⎥⎦ ⎢⎣ ΔPC ⎥⎦
(18)
'
and K C are the equivalent instantaneous stiffnesses for the buffer, beam, upper
pipe and loading mass, respectively, given by:
cS γ mB ' K B = (Δt )2 + k B + kS + β β Δt
(19)
2cS γ cA γ + mA ' K A = (Δt )2 + k A + 2k S + β β Δt β Δt
(20)
- 60 -
' KP =
cR γ + cA γ mP + k k R + A + 2 β (Δt ) β Δt β Δt
(21)
cR γ mC ' K C = (Δt )2 + k R + β β Δt
(22)
and kS, kC and kR are the instantaneous stiffnesses and cS, cC and cR are the damping coefficients of the buffer/ beam contact surface, anchor load cell and reinforcement system responses, respectively, given by: k 'S = k S +
cS γ βΔt
(23)
k'A = k A +
cA γ βΔt
(24)
' = kR kR +
cR γ β Δt
(25)
and ΔPB, ΔPA, ΔPP and ΔPC are the notional force changes for each component during the time increment B
given by: ⎛ u& Bt &u&Bt ⎞ cS γ (u& At − u& Bt ) + cR Δt ⎛⎜⎜1 − γ ⎞⎟⎟(&u&At − &u&Bt ) ΔPB = mB ⎜⎜ βΔt + 2βΔt ⎟⎟ − 2 ⎝
β
⎠
⎝
β⎠
(26)
γ ⎛ u& At &u&At ⎞ cA γ (u& Pt − u& At ) + 2cS (u& At − u& Bt ) ΔPA = mA ⎜⎜ βΔt + 2βΔt ⎟⎟ − ⎝
⎠
β
β
⎛ ⎛ γ ⎞ γ ⎞ + cA Δt ⎜⎜1 − ⎟⎟(&u&Ptt − &u&At ) − 2cS Δt ⎜⎜1 − ⎟⎟(&u&At − &u&Bt ) ⎝ 2β ⎠ ⎝ 2β ⎠
(27)
γ ⎛ u& Pt &u&Pt ⎞ cR γ (u& Ct − u& Pt ) + cA (u& Pt − u& At ) ΔPP = mP ⎜⎜ βΔt + 2βΔt ⎟⎟ − ⎝
⎠
β
β
⎛ ⎛ γ ⎞ γ ⎞ + cR Δt ⎜⎜1 − ⎟⎟(&u&Ct − &u&Pt ) − 2cA Δt ⎜⎜1 − ⎟⎟(&u&Pt − &u&At ) ⎝ 2β ⎠ ⎝ 2β ⎠ ⎛ u& Ct &u&Ct ⎞ cR γ (u& Ct − u& Pt ) + cR Δt ⎛⎜⎜1 − γ ⎞⎟⎟(&u&Ct − &u&Pt ) ΔPC = mC ⎜⎜ βΔt + 2βΔt ⎟⎟ + 2 ⎝
⎠
β
⎝
β⎠
(28)
(29)
The solution of Equation 18 by either Gaussian elimination or matrix inversion results in estimates of the incremental displacements that are added to the accumulated displacements for each of the components. Further, the changes in the velocities are calculated for each component using Equation 14 and are added to the velocities at the start of the time interval. The accelerations for each component at the end of the time step are calculated using the forces estimated at the end of the time step.
- 61 -
7.8
INSTRUMENTATION AND MONITORING SYSTEM
In order to undertake fundamental analysis of the mechanisms of load transfer, it was identified that test facility instrumentation was required to measure force, displacement, acceleration and strain of the: • reinforcement system (bolts, surface hardware, collar and anchor), • simulated ejected rock (the integrated steel rings and lower pipe length), • simulated rock mass (the drop beam and upper pipe length), and • buffers (the impact surface). Instrumentation was designed or selected to record force, displacement, acceleration and strain in small time increments. This allows solution of force displacement curves and the relative velocity between the ‘ejected rock’ and the ‘rock mass’. The design and selection of instrumentation and data acquisition system involved a number of key requirements; • integration of digital video with sensor data, • relatively high speed digital video capture, • high speed acquisition of data per sensor channel, • a large number of channels, • support strain gauge, integrated circuit protocol (ICP), and direct voltage output instrumentation, • software control of sensor data acquisition and digital video capture, Fundamental analysis of the mechanisms of load transfer in the test facility was used to identify where instrumentation would be required to measure forces and displacements of the reinforcement systems, face restraint and surface support during testing. Every required data source can be calculated from secondary data gathered by another instrument or by another means, in case of failure or damage to instrumentation components.
7.9
DATA ACQUISITION
A National Instruments PCI6071E data acquisition (DAQ) board controls the acquisition of data from all sensors. The card is configured for 32 differential input channels utilizing 12 bit sampling. With the current sensor requirements, the facility only requires 22 channels.
- 62 -
The DAQ channel sample rate is 25,000 samples per second per channel. Sampling occurs simultaneously on all channels. The sample rate determines the smallest time interval recorded, but the highest recordable frequency for cyclic analogue signals is half the sample rate (Nyquist Theorem in signal filtering). The underlying data acquisition software is from National Instruments, but the video control software is Midas from Xcitex. Midas software provides a front-end operating system for recording the tests. All data can be output to an Excel spreadsheet, displaying the sensor data along with point analysis of object locations from auto-tracking the video. A video file is also generated. Sensor data and video information are both time-coded and interlinked allowing combined assessment. The DAQ system has a two-second window for data and video with a trigger option for acquiring the data. Sensors and video are continuously acquiring information once powered, but a trigger signal is required to start the recording process. Instrumentation gathers two seconds of data during a test but analysis requires less than 0.6 seconds of data. The division of instrumentation channels provides for 8 strain gauge channels (filtered by a National Instruments SC2043SG board), and 12 ICP configured channels via a PCB Piezotronics 483A signal conditioner with BNC connections. The remaining 12 channels are DC voltage channels with BNC connections to the DAQ board.
Figure 30 shows a schematic of the DAQ boards, computer and
instrumentation.
Accelerometers, on beam, mass, and facility.
Video Screen for data visualization
SC2043SG
12channel 483A signal conditioning
2 strain gauge based load cell sets
5 strain gauges on drop beam
Laser break trigger
Separate 10V power supply for strain gauges
Ultrasonic device Potentiometer
PCI6071E DAQ card BNC connection board Redlake digital video
PCI card Motionscope
Figure 30 Schematic of instrumentation and data acquisition
- 63 -
7.10
SENSORS
The selection of a combination of permanent and temporary sensors, and the possibility for sensor damage requires a secondary means of acquiring or calculating crucial data. Figure 25 shows the load transfer diagram for all components and their interactions in a test. All commercial equipment was supplied with calibration factors, and calibration of purpose-built equipment was undertaken as part of the project. The quality of the measured data point is a function of the combined accuracy and precision of both the sensor and the DAQ board. 7.10.1
Accelerometers
All accelerometers are from PCB Piezotronics. Three 356A02 triaxial 500g units were selected. The units have an acquisition range of 1Hz to 5kHz, to which a mechanical filter has been fitted to protect the unit from high frequency and sensor saturation due to metal to metal contact. This reduces the upper range to approximately 2kHz. The sensors and board have a combined accuracy of 2.35m/s2 in their current configuration. A uniaxial shock accelerometer was also selected (the 350A13). The unit is electronically filtered and generates much cleaner signals. The sensor and board configuration has a range of 1Hz to 10kHz (+-1dB) with a combined error of 46.7m/s2, but with filtering it is possible to improve this to 9.0m/s2. Accelerometers are placed in key locations; including • on top of the drop beam above the buffer, • underneath the beam two thirds of the distance between the impact point with the buffer and the centre hole, • on the simulated rock mass (Figure 31).
Both the 10,000g shock accelerometer and a 500g
accelerometer are located here for side by side testing to understand the difference in sensor response.
- 64 -
Simulated ejected rock (steel plates)
Rubber plate
Deformed rock bolt plates 10,000g shock accelerometer
Force ring replaced by a load cell
Figure 31. Shock Accelerometer and surface hardware. 7.10.2
Load Cells
Collar force and the anchor force are recorded by purpose built 300kN load cells with spherical seats. A single load cell is used to measure the collar force (Figure 32) with a combined sensor and board error of 1.28kN (and 5.3kN during commissioning tests); this replaces a force ring (Figure 31) which proved to be inappropriate for the application. Simulated discontinuity lower pipe length with bolt, detail in Figure 25 and Figure 26.
Surface hardware and washer Nut
SC2043SG card
Load cell
Figure 32. Load cell for measuring force at the collar. Four load cells, wired in a full-bridge configuration, were used to measure the anchor force (Figure 33). The load cells are located between the backing plate for the simulated borehole and the top of the beam. The simulated borehole is bolted to the beam through the load cells. The load cells and DAQ board have a combined error of 3.53kN (and 14.1kN during commissioning tests).
- 65 -
Junction box to configure load cells in full bridge
SC2043SG card
Anchoring plate for thick wall pipe
Load cells (4 of)
Load cell pushed down into the beam, buffer’s push up against drop beam.
Drop beam
Simulated discontinuity
Upper length thick wall pipe, 1.5m, detail in Figure 25 and Figure 26.
Figure 33. Set of load cells for measuring anchor force. 7.10.3
Ultrasonic Motion Sensor
The ultrasonic motion sensor was selected in order to assess compression of the buffers during deceleration of the beam. The selection of the ultrasonic device was dependent on meeting the following criteria ; • no direct contact to beam, hence no damage to sensor. • ability to measure the maximum buffer compression of 104mm, • a DC voltage output compatible with the DAQ board range. A HydePark SM606A02 was selected for this purpose. However, the selected unit has a comparatively slow sample rate of 1.6milliseconds (ms). The digital over sampling technique used by the DAQ card provides a step function record of the buffer compression. This requires filtering as the buffer is a smooth travelling device. The ultrasonic unit has an accuracy of 0.69mm, with a board variation of 0.03mm. The sensor was mounted in a bracket on the side of the buffer as shown in Figure 34.
- 66 -
Guide rails
Accelerometer mounted to beam, records impact Drop beam contacts buffer, and comes into ultrasonic range
Piston moves into buffer, reaction force upwards
Ultrasonic probe records beam movement as the buffer is compressed and recovers, direct voltage output to DAQ.
Figure 34. Ultrasonic measuring buffer compression and accelerometer on beam above buffer.
7.10.4
Linear Potentiometer
Analysis of the results from indirect measurement of beam displacement with the ultrasonic probe mounted to the side of the buffer indicated difficulties in assessing the exact starting time of buffer compression. These difficulties were mainly attributed to the speed of travel of the beam relative to the slow sampling rate of the ultrasonic device (1.5milliseconds between samples). Also, saturation was observed to occur at the beginning of the measurement stage. This was possibly caused by air compression above the ultrasonic sensor head. Investigation of alternative direct measurement methods suggested linear potentiometers used to measure the compression of shock absorbers of racing cars could be a solution. A SLS190 linear potentiometer from Control Devices Australia was selected. This device was mounted onto the body of the buffer to measure directly the piston displacement. A constant voltage is supplied to the potentiometer and the output voltage is monitored directly and recorded by the data acquisition system. The potentiometer provides a significant improvement in data quality when compared with the ultrasonic unit. The potentiometer output varies continuously with piston displacement and is sampled at the monitoring system data acquisition rate of 25kHz (0.04milliseconds between readings); this represents a rate of about 38 times that of the ultrasonic sensor. The improved sensor response results in less processing of the raw data with only minor fluctuations in the raw output for the first 5ms of data and then high quality data afterwards.
- 67 -
7.10.5
Laser Break and Triggering
The drop beam moves through a laser beam starting the recording process. Breaking the laser beam sends a 5-volt pulse to the SC2043SG board (Figure 35). The data window closes 2 seconds after the trigger
SC2043SG Card
Drop Beam, Falling
signal and the trigger allowance. The trigger allowance can be set from plus 2 seconds to minus 2 seconds.
Laser Emitter
Power Supply
Laser Receiver
Buffer
Figure 35. Laser break trigger of instrumentation.
7.10.6
Physical Measurements
Physical measurements are taken before and after each test in order to confirm sensor measurement and provide an understanding of yield of the reinforcement system. Required measurements include; • toe of bolt displacement (Figure 36), • separation displacement at the discontinuity (Figure 37), • torque on nut, only undertaken during tensioning of the bolt prior to the first test, • surface plate deformation.
- 68 -
Distance to bolt measured down the hole drilled in the grout.
Anchoring Plate
Load Cells
Beam (see Figure 22
Bolt Grout
Figure 36. Measuring anchor of bolt displacement.
Upper separation for additional test, either yield mechanism or bolt stretch.
Upper pipe length to the anchoring plate
Centre separation from first test, represents the edge of the upper and lower pipe lengths on the bolt, measured with each test
Bottom separation, for additional test, generally bolt stretch
Lower pipe length including integrated mass and surface hardware
Figure 37. Measurement of separation at the simulated discontinuity at each test. 7.10.7
Strain Gauge
Strain gauges attached to the drop beam are used to determine compressive and tensile strains in the beam from the dynamic loads (Figure 38). Micro-Measurement EA-06-500BL-350 strain gauges were selected for this application. To improve the sensor sensitivity of the strain gauges and load cells, additional excitation voltage was required. Excitation voltage was recorded at each sample point and used for strain gauge based calculations. The results of the tests (as shown in Table 2) indicate that the beam behaved stiffly, as none of the input energy was lost through beam deflection.
- 69 -
Top 1/4
Bottom Centre Bottom 1/6 Bottom 1/4 Bottom 1/3
Figure 38. Strain gauge locations on drop beam.
7.11
CAMERA RECORDING
Digital video capture of the drop occurs at a rate of 250 frames per second. The digital video camera has a pixel resolution corresponding to 3.3mm of the viewing test area. Time coding of the video allows interlinking with sensor data. Higher sample rates (500 or 1000 frames per second) are possible, however there is a loss of frame area. The camera was mounted at 15° above the horizontal, which allows viewing of the plate and surface hardware during each test. Figure 40 shows the camera at the bottom of the trench, with the grid on the back wall of the pit used for scaling. The auto-tracking software can calculate displacements, accurate to approximately half of one pixel, 1.7mm. However, the analysis can only use points on the centre line of the drop. A geometric correction factor was developed to account for the camera mounting angle. The correction factor was derived by considering the geometry shown in Figure 39. In this figure: AD is the centreline plane of the drop beam and mass. C is the projected centre of the video “screen”. R is the bottom of the screen. L = distance from the video camera lens to C H = horizontal distance of the centreline from the lens. F = focal length distance from the lens to the video “screen” AB = dy = true distance change of a point on the centreline of a test specimen component.
- 70 -
A’B’ = dy’ = apparent distance recorded by the video. A”B”= dy” = actual distance recorded by the video θi = angle to point at time t θi+1 = angle to point at time t + δt, where δt = 1/(Number of frames per second) The true displacement dy is given by: dy = H
sin(θi − θi −1) cos(α + θi −1) cos(α + θi +1)
where ⎛ A' C ⎞ ⎛ A " C" ⎞ ⎟ = ar tan⎜ ⎟ θi = ar tan⎜ ⎝ L ⎠ ⎝ F ⎠ ⎛ B' C ⎞ ⎛ B" C" ⎞ ⎟ = ar tan⎜ ⎟ θi +1 = ar tan⎜ L ⎝ ⎠ ⎝ F ⎠
When velocities approach ½ pixel / frame rate comparatively large and unrealistic steps occur in the data. Therefore, in order to obtain a linear displacement versus time curve, the video captured displacement data requires smoothing. With knowledge of the acceleration and mass of objects components, it is possible to calculate force.
- 71 -
A dy
A’
dy’
y1’ B’
B
y2’ C
θi
Camera Plane
θ i+1 A’
R
αC − θR C’ αc
θR D H
F
L Plane of the Test
Figure 39. Representation of the geometry used to correct the displacement-time data obtained by the video camera.
- 72 -
Guide Rails
Release Hook, maximum capacity 4.5t, max height 6m.
Guide Rails for the drop beam
645kg Drop Beam (the rock which is not ejected)
Computer and Data Logger Cabinet 22 channels at 25,000 samples per second per channel
2.4m rock bolt in Steel Pipes, break at 1m
Simulated ejected Rock Mass
Buffer
Video grid for back up analysis
High Speed Digital Video Camera 250fps
Figure 40. Constructed WASM test facility.
- 73 -
8
SUMMARY OF TESTING
During the development and commissioning phase of the facility, 20 bolts have been dynamically tested using 80 drops. A summary of the tests carried out in establishing the facility and developing the instrumentation protocols and the analysis methodology are shown in Table 2. Bolts tested include: • Cone Bolts (22mm diameter bar), • Thread Bars (galvanized 20mm diameter), and • smooth bolts (cone bolt with the cone cut off). Ejected rock masses trialled; • 500kg (too light, drop beam is 645kg), • 1500kg (an improvement), and • 2000kg (a good starting test weight). Impact velocities trialled; • 3m/s, (this is the minimum velocity for the facility), • 5m/s, (this is the preferred starting impact velocity) • 6m/s (buffer’s re-rated impact velocity), and • 7m/s. Table 2 shows total displacements achieved from a series of dynamic tests conducted on various reinforcement systems.
Tests conducted as part of the commissioning of the facility assisted in
determining the conditions for sensor saturation and data loss.
- 74 -
Table 2.
Summary of commissioning test program
Bolt #
Type
Drops
Heights
Summary of Results
14
Smooth
9
100-400
287mm slip, concrete mass 500kg, cut out welds from simulated discontinuity and start noise isolation work
13
Smooth
3
400 3m/s
125mm slip, concrete mass, instrumentation learning process, noise isolation
13
Smooth
1
1000
325mm slip, steel rings replace concrete mass, instrumentation improvements
1
Thread Bar
3
1000
Stripped nut (was fully engaged), no load transfer ring on the outside of the borehole pipe
2
Thread Bar
21
10001850
Load transfer ring standardized for fully bonded bolts, 500kg steel mass, additional and change sensor locations, 190mm stretching / slip, consistent bolt changes with each drop, substantial work on strain gauge set-up
31
Cone
10
1800 6m/s
34
Cone
10
1800
500kg mass no load transfer ring, 108mm of total separation. 20ms loading time on the anchor force, increase strain gauge excitation voltage, consistent bolt changes with each drop
34
Cone
3
1800
500kg mass, change force ring for load cell at the collar. Similar forces recorded by collar and anchor load cells, and same time of peak occurrence, due to debonding and yield of the cone bolt.
34
Cone
3
1800
500kg mass, buffer compression device trailed to increase buffer stiffness, no gain in shock, but reduction in travel distance of buffer.
4
Thread Bar
1
1280 5m/s
38
Cone
3
1280
37
Cone
1
1275 5m/s
=
1500kg mass, 50ms of load at anchors at 180kN to 220kN, 48mm of separation. Approx 8.5 to 10.5kJ absorbed by bolt, rest into buffer of 19kJ input.
37
Cone
3
1835 6m/s
=
Continuation of testing, yield of the bolt, anchor force load curve is stiffening with each test, possibly due to work hardening of the bolt, 197mm of yield from the 3 tests.
=
=
=
500kg mass, load transfer ring, 104mm total slip and yield, buffer response assessed, consistent bolt change with each drop
1500kg mass, approximately 19kJ of total energy input, stripped nut (was not fully engaged) and pulled the lower pipe length off the grout around the bolt. Anchor and collar forces suggest 80kNrequired to cause borehole slip. All pipes to have additional friction by the use of shear pins installed through the wall of the pipe and into the grout. Buffer compression trail continued. 19kJ input per test, estimate 10kJ absorbed by the bolt yield per test. The shock recorded by the accelerometer on the mass is lower with the increase in mass. The yielding system can only apply force at a fixed maximum amount so it takes longer to slow the ejected rock. Loading time 70ms, 114mm of total separation from 3 tests. Buffer compression trial continued.
- 75 -
Table 2.
Summary of commissioning test program (continued).
Bolt #
Type
Drops
Heights
37
Cone
4
2500 7m/s
=
Continuation of testing, yield of the bolt, anchor force high for short time periods 50ms, on the 6th test there is cone slide with a duration of 130ms. 380mm of separation from the 5th to 7th drops, and then bolt fails on the 8th drop. End of trials with buffer compression.
42
Cone
4
1265 1845
-
1500kg mass. First drop at 5m/s rest at 6m/s. Load cells recording on collar and anchor, 155mm of total separation from the first three test, then stripped nut on the 4th test (was not fully engaged) Cone movement of 40mm and bolt stretch of 115mm recorded.
11
Thread Bar
3
1245 1845
-
60
Cone
3
61
Cone
4
56
Yieldi ng Cable Yieldi ng Cable Split Set
1
58 62
48 23
29
Summary of Results
2000kg mass, first test uneven and slower then ideal, 117mm of separation by the second test, bar pulled out of grout on the third tests. Tested bars are galvanized and have a rope thread on less than half the diameter of the bolt 1850 = 2000kg of mass, low strength grout mix with limestone to 6m/s improve slide capacity of the bolt. Excellent performance good sliding with minimal stretching of the steel as the anchor loads were generally of the order of 150-160kN. 950mm of displacement between the three drops. Double face plate and rubber plate 1850 = 2000kg of mass, low strength grout mix with limestone to 6m/s (3 improve slide capacity of the cone. Excellent performance, drops) stretching occurred when the cone caught on tabs into the 4th drop grout to stop grout sliding. Long duration of pull when clear at of tabs with up to 0.17s pull time of the cone coming through 1550mm. the grout, at 110-130kN. 1004mm of total yield from the 4 drops without failing the bolt. These tests performed just with a single dome plate and no rubber plate. 1835 2000kg of mass, low strength grout, snapped yield mechanism due to weld issues.
1
1835
2000kg of mass, low strength grout, snapped yield mechanism due to weld issues.
1
1835
Yieldi ng Cable Plain strand cable
1
1835
2
1850
Plain strand cable
1
1850
2000kg, only 1.0m of embedment above the simulate discontinuity. Static pull test showed the 2.4m Split Set had a pull capacity of 160kN. Split Set did very little energy absorption. 2000kg, preliminary design of cable only, failed on yield mechanism, this has already been fixed as the bolt was grouted 2 years ago. 2000kg, 1.5m of embedment above the simulated discontinuity. Cable yielded in the grout length with this embedment length. 141mm on the first drop and 290mm on the second drop. Matches static idea that plain strain cable requires 2.0m of embedment to cause the cable to break. 2000kg, 1.96m of embedment length above the simulated discontinuity. Broke the cable on the first drop. Good cup and cone fractures of the individual cable wires in the strand.
- 76 -
Table 2.
Summary of commissioning test program (continued).
27
Plain strand cable
1
1850
32
Cone bolt (high streng th)
4
18502600, 6m/s and 7m/s
22
Plain strand cable
1
1850
19
Plain strand cable
1
1850
2000kg, 1.96m of embedment length above the simulated discontinuity. Broke the cable on the first drop. Good cup and cone fractures of the individual cable wires in the strand. Repeat of test above to prove similarity in results and test methodology. 2000kg, 133kN of pretension. High surface tension resulted in very little bolt stretch but predominately cone slip. For the latter tests, when the tension is lost and end up with 0.01s between beam impact to oleos and mass connecting with surface hardware. There is quite different test result from these tests, very high load on the anchor cells up to 270kN, increased with each drop. Shows the importance of the correct loading mechanism, or developing a device to allow re-tensioning of the element that looses tension between each test. 2000kg, 1.96m of embedment. We have added the rubber plate, and let the bolt sit tensioned for 5 days. Bolt broke on first drop, but also resulted in partial slip of the cable and barrels and wedges. Energy absorption part way between the unplated cable with 1.5m of embedment and 1.96m of embedment. 2000kg, 1.96 of embedment, no face plate to assess load transfer from the cable. 0.62m at the collar of the bolt. Stripped with very low load transfer of approximately 50kN. Shows the importance of the plating a cable bolt in dynamic loading situations.
A substantial amount of work was required during the development and commissioning. The issues addressed were; • testing procedure and sequencing, • alignment of the guide rails for smooth drops, • quality requirements in test sample preparation • integration of the simulated ejected rock to the simulated borehole and the reinforcing element, • response of the buffers to dynamic loading and how to adjust that response, • stopping metal to metal contact to prevent instrumentation saturation, • instrumentation and DAQ configuration to obtain optimal results, • filtering and analysis techniques. This process is discussed in Section 9.
- 77 -
Example results are shown in Figure 41 to Figure 43. These are raw results prior to filtering. Section 9 presents analysis with the filters and examines the force displacement curves for the system. Figure 41 shows the response of a 500g accelerometer, without a mechanical filter, mounted on top of the beam above the buffer. The accelerometer was positioned to measure acceleration of the beam prior to impact with the buffer and deceleration after impact with the buffer. It is also used to interpret the acceleration of the buffer after beam impact. This is a clear example of the requirement to filter the results in order to obtain the “true” signal. Prior to impact the beam is descending under gravity and the sensor correctly records a signal of 1g. Accelerometer ac03z 400 300
Gravity
200 100 0 -100 -200
ac03z
-300 -400 -0.05
0
0.05
0.1
0.15
0.2
Seconds
Figure 41. Accelerometer loading on the beam above the buffer.
Figure 42 shows the response of the collar and anchor load cells. The results are for the second drop on a cone bolt. A loss of collar tension was experienced during the first test. This is a result of bar yielding and anchor displacement During the beam descent, the collar load cell recorded the weight of the simulated ejected rock, approximately 20kN. The load cells provide the best indication of the loading duration on the bolt. In this example, load duration is approximately 70ms, with a rise time of 5ms. The difference between the collar and anchor force is due to measurements of different masses (ejected rock versus ejected rock and upper pipe length) and deceleration mechanisms (reinforcement element versus buffer’s).
- 78 -
Load Cell Reults 250 200
kN
150
Anchor Load Collar Load
100 50 0 -50 -0.05
0
0.05
0.1
0.15
0.2
Seconds
Figure 42. Load cell response to dynamic load. Figure 43 shows the displacement of the buffer and the shock accelerometer on the simulated ejected rock. The results indicate that the ultrasonic record of buffer displacement requires filtering to smooth the data, and the difference in timing of beam impact on to the buffer as determined by the ultrasonic sensor and accelerometer needs to be improved to 0.1ms. The shock accelerometer has a greater error than the 500g accelerometers. However, it has inbuilt filtering and a larger range to prevent saturation. Less additional filtering is required to assess the true response. Oleo and Shock Accelerometer 100 80
mm and g
60 40 20 0 ac06z
-20
ul1 -40 -0.05
0
0.05
0.1
0.15
0.2
Seconds
Figure 43. Buffer displacement and shock accelerometer
- 79 -
9
DATA ANALYSIS PROCEDURE
In the previous section, some typical test results were given. An efficient data analysis procedure was required to integrate and interpret the large amount of data collected during each test. The data analysis methodology consists of three main stages: 1 Reviewing and selecting data for analysis. 2 Filtering of the selected data. 3 Analysis of the filtered data over the required time interval. This methodology has been incorporated into the software developed using Microsoft® Visual Basic, the same programming language used to develop the simulation software described and demonstrated in Section 3. The software consists of interactive user interfaces with the data displayed in charts that may be “windowed” and zoomed to review data. The results used to demonstrate the analysis procedure were obtained in a test similar to the one simulated earlier. The test involved a 22mm cone bolt installed in low strength cement grout, a loading mass of 2040kg, drop height 1850mm, impact velocity 6.02m/s and nominal impact energy associated with the mass of 37kJ.
9.1
TESTING DATA
Data were collected from ~-120ms to 700ms, where the datum (time = 0) is the time when the breaking of a laser beam causes data storage. The data excess to the requirements for analysis are ignored by selecting a time range window on a chart of the data. Unfiltered data obtained during the test are shown in: • Figure 44 (beam acceleration-time). • Figure 45 (collar force-time). • Figure 46 (beam/buffer displacement-time). In these and subsequent figures, the range of useful data ranges from approximately initial impact (at time ≈ 15milliseconds) and after the test has finished (time ≈ 180milliseconds).
- 80 -
Figure 44. Unfiltered acceleration-time plot from the accelerometer on the beam above the buffer.
Figure 45. Unfiltered force-time plot from the collar load cell.
Figure 46. Unfiltered displacement-time plot from the motion sensor.
- 81 -
9.2
ANALYSIS OF VIDEO RECORDING DATA
The software included with the video recording system allows selected points on the test specimen to be tracked with time. The raw data are corrected for distortion due to the vertical plane of the test being at an angle to the camera recording plane as shown in Figure 39, Section 7.11. Typically, a point on either the end of the reinforcement element or a point on the loading mass are tracked (see Figure 47). These data are synchronised with the other measurements and added to the data available for analysis.
Figure 47. Displacement-time plot for the loading mass derived from the video recording.
9.3
FILTERING OF RAW DATA
It was recognised from previous testing that filtering of these data would be required to interpret the results in a meaningful way. Initially, it was anticipated that frequency analysis using a Fast Fourier Transform (FFT) and Inverse Fast Fourier Transform (IFFT) for frequencies below a certain threshold would be used. This has been found to be valid for the accelerometers and load cells. For example, Figure 48 shows the data from the beam accelerometer filtered to eliminate all frequencies above 100Hz and inverted to reflect the correct sense of acceleration. Figure 49 shows the data from the collar and upper anchor pipe load cells filtered to eliminate all frequencies above 150Hz. The software has been written so that other, possibly better, filters may be easily implemented.
- 82 -
Figure 48. Beam acceleration-time plot corresponding to Figure 44 after filtering out frequencies above 100Hz.
Figure 49. Collar force (PEP)-time plot corresponding to Figure 45 after filtering out frequencies above 150Hz. - anchor force (PA) also shown as dashed line for comparison. Integrating the filtered acceleration-time data to obtain velocity-time and displacement-time data is found to give acceptable results. However, it was quickly recognised that, even after filtering, attempting to differentiate displacement-time data to obtain velocity-time data and to then differentiate the resulting velocity-time data to obtain acceleration-time data would not be possible. After an extensive review of techniques available for filtering time varying data, the Kalman filter was chosen as being most likely to satisfy the requirements for analysing the type of displacement data being obtained from the motion sensor and derived from the video recordings.
- 83 -
9.4
KALMAN FILTER FOR MULTIPLE VARIABLES
The Kalman filter is capable of taking displacement-time data and predicting the filtered displacement-time data as well as the velocity-time data and the acceleration time data. An added benefit of the Kalman filter is its ability to be able to incorporate additional information (e.g. acceleration-time data) from another sensor to improve the overall filtered response. A further incentive to adopt the Kalman filter was that it was available as a component of a software library (Newcastle Scientific 2002) compatible with Microsoft® Visual Basic. The Kalman filter is similar to a least squares fitting to data except that measurements can be incorporated into the fitting coefficients one at a time rather than all at once as with the standard least squares technique. The Kalman filter propagates and updates what are known as the state vector and covariance matrix. For the dynamic test facility, the state vector comprises the displacement, velocity and acceleration associated with a component of the system. The covariance matrix consists of terms associated with the errors in the measurements of the state vector variables. Input to the filter comprises: 1.
The vector of measurements (one, two or three of displacement, velocity and acceleration).
2.
The measurement noise matrix.
3.
The matrix of partial derivatives of the measurements with respect to the states.
4.
The propagation matrix for displacement, velocity and acceleration.
5.
The current covariance matrix.
6.
The process noise matrix.
The terminology and the formation of the various vectors and matrices are given in the following sections. The vectors and matrices have the following dimensions: NS = number of state variables (3) NM = number of measurements (1 or 2 – that is, displacement or acceleration)
- 84 -
9.4.1
State Variables
The vector of state variables [X] has length NS and is given by:
[X]T = [x where
x& &x&]
(30)
x = displacement x& = velocity &x& = acceleration
9.4.2
Vector of measurements
The vector of measurements [Z] has length NM. If measurements are made corresponding to all three state variables, then:
[Z]T = [z
z& &z&]
(31)
However, typically measurements are available for displacement alone, acceleration alone or displacement and acceleration. That is, no direct measurements of velocity are made.
9.4.3
Matrix of partial derivatives
The matrix [H] of partial derivatives of measurement variables with respect to the state variables has dimensions NM by NS. If the number of measurements corresponds to the number of state variables, [H] is given by: ⎡ ∂z ⎢ ∂x ⎢ [H]= ⎢ ∂z& ⎢ ∂x ⎢ ∂&z& ⎢ ∂x ⎣
∂z ∂x& ∂z& ∂x& ∂&z& ∂x&
∂z ⎤ ∂&x& ⎥ ⎥ ∂z& ⎥ ∂&x& ⎥ ∂&z& ⎥ ∂&x& ⎥⎦
(32)
For the analysis of data in this dynamic test facility, the following typical cases occur: • Measurement of displacement only:
[H ] = [1
0 0]
(33)
- 85 -
• Measurement of acceleration only:
[H ] = [0
0 1]
(34)
• Measurement of displacement and acceleration:
⎡1 0 0⎤ ⎥ ⎢⎣0 0 1⎥⎦
[H]= ⎢ 9.4.4
(35)
Propagation matrix
The NS by NS propagation matrix (Φ) is given by:
⎡ [Φ ]= ⎢⎢ ⎢ ⎣
9.4.5
1 0 0
Δt 1 0
2
0.5 Δt ⎤ ⎥ Δt ⎥ 1 ⎥⎦
(36)
Process noise matrix
The process noise matrix [Q] is NS by NS. Some experimentation is being used to estimate appropriate values for the components of this matrix.
9.4.6
Covariance matrix
The covariance matrix [P] is NS by NS. Again, some experimentation is being used to estimate appropriate values for its components.
9.4.7
Measurement noise matrix
The NM by NM measurement noise matrix [R] can be estimated by knowing the response characteristics for the particular sensor and how this might affect the precision of the measurement.
- 86 -
9.4.8
Summary
Mathematically, the operation of the Kalman filter may be described by the following 5 steps: 1 State Extrapolation – propagates the state vector to the time of the current measurement.
[X −]t = [Φ]t −1 [X +]t −1
(37)
2 Error Covariance Extrapolation – propagates the covariance matrix to the time of the current measurement and adds process noise.
[P −]t = [Φ]t −1 [P +]t −1 [Φ]Tt −1 + [Q] t −1
(38)
3 Kalman Filter Gain – is the gain weighting matrix given by:
[K]t = [P −]t [H]Tt [[H]t [P −]t [H]Tt + [R ]t]−1
(39)
4 Error Covariance Update
[P +]t = [ [I] − [K]t [H]t] [P −]t
(40)
5 State Vector Update – updates the state vector with the current measurement, weighted by the gain matrix.
[X +]t = [X −]t + [K ]t [ [Z]t − [H]t [X −]t]
(41)
In these equations, the “–“ and “+” signs in the vector [X] and matrix [P] indicate the initial and final estimated values, respectively.
9.5
DEMONSTRATION OF KALMAN FILTER
The data shown in Figure 46 was input to the Kalman filter routine together with the known (assumed) initial conditions for the beam (i.e. velocity = 6.02m/s and acceleration = 9.81m/s2). The filtered results for the displacement, velocity and acceleration variations with time for the beam are shown in Figure 50.
- 87 -
a.
b.
c.
Filtered displacement ( u A ) versus time.
Predicted velocity ( u& A ) versus time.
Predicted acceleration ( &u& A ) versus time.
Figure 50. Filtered displacement, velocity and acceleration derived by Kalman filter from data shown in Figure 46.
- 88 -
9.6
ENGINEERING CALCULATIONS
9.6.1
Forces and displacements
For the purposes of the calculations, the anchor zone components are lumped together. Following filtering of the data, it can be assumed that at any time the accelerations of the beam ( &u&A ) and the loading mass ( &u&C ) are known. The net force on the loading mass (FC) at any time is given by:
FC = mC &u&C = mC g − FRJ
(42)
Then
FRJ = mC (g − &u&C )
(43)
The net force on the beam (FA) at any time is given by:
FA = mA &u&A = mA g + FRJ − 2 (FB − mB g )
(44)
from which the buffer force may be estimated from
PB = (mA g + mC (g − &u&C ) + 2 mB g − mA &u&A ) / 2
(45)
Also, by integrating the measured accelerations, the velocities ( u& C and u& A ) are obtained. The displacement of the beam (uA) has been measured directly by the motion sensor and the mass displacement (uC) estimated from the video recording. The reinforcement displacement (uR) at the interface between the collar and anchor pipes is then given by: uR = uC - uA
(46)
At this stage in the analysis, the variations of all variables during the test have been estimated. Also note that in some instances there may be a direct measurement corresponding to the estimate. For example, the load cells give measurements approximating to FRJ. In general, the load cells will record different forces. The force measured by the anchor load cells includes the inertia force of the upper pipe (see Equation 12). The load cell at the collar measures the force between the reinforcement system plate and the loading mass. This collar force may be different from the reinforcement force at the interface due to load transfer from the reinforcement system to the pipe in the collar zone.
- 89 -
9.6.2
Momentum
The momentum of the components can be calculated at any time during the test. The changes in momentum can be assessed relative to the changes in external forces acting on the components. 9.6.3
Energy
The kinetic energy of the components of the system (beam and loading mass) and the energy absorbed by the reinforcement and buffers may be calculated at any time during the test and an “energy balance” calculation performed. The energy of the beam (EA) at any time is given by: EA = mA vA2 / 2
(47)
Similarly, the energy of the loading mass (EC) at any time is given by: EC = mC vC2 / 2
(48)
The energy absorbed by the reinforcement (ER) is given by: (49)
E R = ∫ FRJ dw RJ And the energy absorbed by the buffers (EB) is given by: B
(50)
E B = ∫ PB du B
In addition, using the buffer piston as a reference height, after impact it is assumed that additional kinetic energy is gained by loss of potential energy which in total is given by: EP = mA uA + mB uB + mP uB B
B
(51)
B
The net energy EN at any time is given by: EN = EA + EC + EP – ER - EB
(52)
B
For example, immediately before impact: EN = ½ mA v02 + ½ mC v02
(53)
where v0 is the velocity of impact If the reinforcement system does not fail and the loading mass is brought to rest, then EN should equal zero at the end of the test.
- 90 -
10
COMPARISON OF EXPERIMENT WITH THEORY
10.1
TEST DESCRIPTION
The simulation technique described in Section 7 has been implemented in software developed using Microsoft® Visual Basic. There is a main user interface which is divided into input specification and display of results. The input interface allows for specification of: • The reinforcement system (i.e. selection of type of reinforcement system with a pre-defined force displacement response such as shown in Figure 27, with or without pre-tension). Following specification, a summary is displayed of the key properties such as force, displacement and energy absorption capacities. • The loading mass (i.e. mass, height of drop, velocity of impact, nominal input energy). • The buffer configuration (i.e. piston normal or pre-compressed or additional mass added). • The anchor configuration (i.e. analysis of separate components or the upper pipe, beam and buffer combined). • Execution control (i.e. analysis type, time increment, number of iterations, total duration). For the demonstration analysis, the following input variables were used: • Reinforcement system response given in Figure 27, pretensioned to 50 kN. • Loading mass MC=2040kg. • Drop height 1850mm (impact velocity 6.02m/s). • Notional impact energy of loading mass 37kJ. • Beam mass MA=645kg and anchor pipe MP = 30kg. • Combined beam and anchor pipe. • Simple application of Newton’s second law with time increment of 10μs and total execution time of 160ms. Following execution, detailed and summary information is available for all components of the simulated test (i.e. buffers, beam, loading mass and reinforcement system). For ease of comparison, the following figures show the test result in the upper half of the page and the simulation prediction in the lower half.
- 91 -
The following pages show: • The buffer displacement, velocity and acceleration variations with time during the test. • The reinforcement displacement, velocity, acceleration and force variations with time. • The reinforcement force-displacement responses. • The component energy variations with time. For this particular illustrative example, it is easy to see that the reinforcement system is providing a uniform force resistance over a large range of displacement, as required for a reinforcement system to sustain high energy impacts.
- 92 -
Figure 51. Buffer displacement-time response after analysis of test data.
Figure 52. Simulated buffer displacement-time response.
- 93 -
Figure 53. Buffer velocity-time response after analysis of test data.
Figure 54. Simulated buffer velocity-time response.
- 94 -
Figure 55. Buffer acceleration-time response after analysis of test data.
Figure 56. Simulated buffer acceleration-time response.
- 95 -
Figure 57. Reinforcement displacement-time response after analysis of test data.
Figure 58. Simulated reinforcement displacement-time response.
- 96 -
Figure 59. Reinforcement velocity-time response after analysis of test data.
Figure 60. Simulated reinforcement velocity-time response.
- 97 -
Figure 61. Reinforcement acceleration-time response after analysis of test data.
Figure 62. Simulated reinforcement acceleration-time response.
- 98 -
Figure 63. Measured reinforcement force-time response after filtering of test data – collar force shown as continuous line and anchor force shown as dashed line.
Figure 64. Simulated reinforcement force-time response.
- 99 -
Figure 65. Reinforcement force-displacement response after analysis of test data.
Figure 66. Simulated reinforcement force-displacement response.
- 100 -
Figure 67. Energy-time responses of the various components after analysis of test data.
Figure 68. Simulated energy-time responses of the various components.
- 101 -
10.2
ASSESSMENT OF TEST DATA AND SIMULATION
The agreement between the analysed test data and the simulation software is remarkably good and provides assurance that the WASM Dynamic Test Facility will provide meaningful data for assessment of the energy absorption capabilities of different reinforcement systems and input for the design of reinforcement systems. The force-displacement response for the reinforcement system is given in Figure 65 and Figure 66. It is worth repeating that it is expected that the interface force (FRJ ~120kN) will lie between the measured upper anchor force (PA ~130kN) and collar force (PEP ~100kN) shown in Figure 63. Finally, the energy variations of the components and the overall testing system are shown in Figure 67 and Figure 68. An important feature of the energy-time charts is that the reinforcement energy absorption is in excess of 30kJ compared with the nominal mass energy of 37kJ at impact. It is also worth noting that additional energy (denoted in Figure 67 and Figure 68 as Input) is associated with vertical downward motion of the mass relative to the position of the buffer piston immediately prior to impact. This additional energy has to be absorbed by the reinforcement to bring the mass to rest. The energy absorbed by the reinforcement system represents ~90% of the notional loading mass energy at impact and the energy absorbed by the buffers is approximately twice that of the initial kinetic energy associated with the beam.
11
IN SITU SIMULATION
Work has commenced on the development of in situ simulation software.
The reinforcement and
surrounding rock are modelled as “lumped” masses. A time varying displacement impulse loading can be applied to the rock and the response of both the rock and reinforcement can be analysed. A similar technique forms the basis for interpretation of some of the non-destructive reinforcement testing equipment (e.g. GRANIT) and may also be used to simulate the Terratek test.
12
ASSESSMENT OF THE WASM TEST FACILITY
It is worth repeating that all test dynamic test facilities have energy losses. However, it is apparent that all other facilities are not dealing with the losses by simply reporting the maximum kinetic energy at impact of a free moving body on to a stationary body or, as with the Terratek testing, simply reporting the energy absorbed by the reinforcement without any consideration as to the energy input required to cause the 3m/s constant velocity of loading.
This is not adequate.
Energy balances must be undertaken and an
understanding achieved of where the input energy is dissipated. With the WASM Dynamic Test Facility unit the energy dissipation through the buffers is the area under the curve of force displacement response of the buffers. The buffer displacement is measured directly and can also be obtained indirectly from the double integration of the data from the accelerometer on the drop beam. The force is calculated by a full expansion of force = mass by acceleration relationship, for all components of the system. All energy calculations are obtained from the area under force-displacement
- 102 -
response curves. This provides solutions for energy at the collar, anchor and buffers, closing the energy loop and understanding the capabilities of the systems tested. Therefore, it is not essential that there be no energy losses as long as those losses are known. The literature review has shown that the WASM test configuration for the drop test is a novel method in the mining community but has similarities to civil and military configurations. The facility can be configured to test reinforcement systems, support systems, or ground support schemes. The WASM momentum transfer concept uses the principal of dropping the simulated rock mass (rock to be ejected) and rock reinforcement and support systems (inside a specifically designed frame) onto engineered impact absorbing foundations (buffers). This results in deformation of the reinforcement and support systems to control the ‘ejected rock’ displacement (by absorption of the energy) or failure of one or more components of the ground support scheme. In the WASM Dynamic Test Facility: • The impact of the drop beam with the buffers represents the general rock mass that is not ejected. • The reinforcement anchorage will be rapidly decelerated to zero by the performance of the buffers. • The ejected mass represented with steel rings will be decelerated according to the properties of the ground support scheme. This mechanism of loading is thought to more closely simulate the situation in an underground mine than the other test methods. The performance of the reinforcing element that transfers the momentum from the ‘ejected rock mass’ and the response of the buffers are key factors in determining the dynamic load to the reinforcing element. The relative velocity between the buffers / drop beam and the ‘ejected rock mass’ determines the energy absorbed by each component of the system compared with the total energy available. Interestingly, the form of impact or dynamic loading produced in a testing facility and how they might relate to reality have not previously been raised as major issues. However, in developing the WASM Dynamic Test Facility, several concerns were raised as to the effect of using energy absorbing buffers. It has now been clearly demonstrated, by both computer simulation and testing, that impact forces and energies of sufficient magnitude can be achieved to cause failure of high strength and moderate energy absorption capacity reinforcement systems. The major advantage of the WASM Test Facility is the ability to analyse the data and calculate the energies absorbed by the various components at any time during a test. A key feature of the facility is the assessment of the system energy at the instant of contact to the buffers, the amount lost in yielding or deforming the reinforcing element, and the amount absorbed into the buffers.
- 103 -
Other key components of the WASM test facility are: • The integrated instrumentation, monitoring and data recording system. • The data analysis methodology and software. • The simulation software. The advantages of the test facility relate to: • Ability to perform full-scale tests of reinforcement systems. • The large input energy available to test systems. • The ability to replicate dynamic loading well. Any perceived disadvantages in the facility can only be accepted in terms of the cost of the facility, cost per test or time to set-up and conduct a test. That is: • The facility is the most expensive mining dynamic test facility constructed. • It is likely to have the highest unit test. • And is probably the longest to set-up a test. These have all occurred because all prior mining dynamic test facilities have serious deficiencies in being able to correctly load the elements being tested or being able to provide valid instrumentation and calculations of the energy absorbed by the systems tested. The facility has been rated as “the most advanced and the closest replication of a seismic event”, by Brown (2004) in his keynote address. Any serious review of the capabilities of the facility and instrumentation involved will show that a world class facility has been constructed and that will in time characterise the dynamic capacities of reinforcement and support systems. It is in the latter regard that work is on-going and represents one of the Phase One tasks that is not yet completed. An addendum to this report will document the results of testing that will form the basis of a dynamic reinforcement response database that can be used for design.
- 104 -
13
CONCLUDING REMARKS
The project has successfully advanced since commencement. The design, construction and commissioning of the facility was undertaken within a two year period. The facility has the capacity to represent rockbursts by a new loading methodology which can be applied to the ground support scheme elements. It is proven from the commissioning tests that the WASM dynamic test facility can provide significant loading of the reinforcement system at the accepted static capacity of reinforcement system elements. These loads are applied for short durations of time with a very rapid rise time (less than 5ms) representing the shock load to the reinforcement system.
14
ACKNOWLEDGEMENTS
The authors would like to thank the project sponsors MERIWA, Harmony Gold, Garford, Geobrugg, GHD Engineering, Goldfields, KCGM, MBT, Newmont, Placer Dome, Rock Engineering and Strata Control Systems.
15
REFERENCES
Aki, K and Richards, P.G. 1980. The Seismic Source: Quantitative Seismology – Theory and Method Ch14, Vol 2, pp799-911. Ando, T. Kishi, N. Mikami, H and Matsuoka, K.G. 2000. Weight Falling Impact Tests on Shear-Failure Type RC Beams with Stirrups. In Structures Under Shock and Impact VI (Eds. N. Jones, C.A Brebbia) Cambridge England, pp579-587. Ansell, A, 1999. Dynamically Loaded Rock Reinforcement. PhD Thesis. Royal Institute of Technology Department of Structural Engineering Sweden. ISSN 1103-4270 Ansell, A. 2000. Testing and Modelling on an Energy Absorbing Rock Bolt, In Structures Under Shock and Impact VI (Editors. N. Jones & C.A Brebbia) Cambridge England, pp417-426.
Brady, B.H.G. and Brown, E.T. 1993. Rock Mechanics for Underground Mining (2nd Edition), Chapman and Hall:London, 571p. Chopra, A.K. 1995. Dynamics of Structures. Prentice Hall(Simon and Schuster-Asia Pte Ltd):Singapore, 729p. GAP221 – Testing of Tunnel Support : Dynamic Load Testing of Rock Containment Systems (eg wire mesh) Safety In Mines Research Advisory Committee Report , South Africa 1997. Authors: W.D. Ortlepp and T.R. Stacey.
- 105 -
GAP423 – Dynamic Loading of Rock bolt Elements to Provide Data for Safer Support Design, Safety In Mines Research Advisory Committee Report, South Africa, June 1998. Authors: W.D. Ortlepp and T.R.
Stacey. Hanssen, G., Auestad, T., Tryland, T., and Langseth, M., 2003. The kicking machine: A device for impact testing of structural components 2003 International Journal of Crashworthiness ISSN: 1358-8265 Volume: 8, Issue: 4, pp385-392 Hyett, A.J., Bawden, W.F. and Reichardt, R, 1992. The Effect of Rock mass Confinement on the Bond Strength of Fully Grouted Cable Bolts. Int. J. Rock Mech. Min. Sc.& Geomech. Abstr., V29, pp503-524. Ishikawa, N. Katsuki, S. and Takemoto, K. 2000. Dynamic Analysis of Prestressed Concrete Beams under Impact and High Speed Loadings. Structures Under Shock and Impact VI (Editors. N. Jones & C.A. Brebbia) Cambridge England, pp 247-256. Iskhakov, I. and Ribakov, Y. (2000) Full-Scale Dynamic Testing of an 11-story RC Building and Interpretation of the Results from the Seismic-Resistance Viewpoint. In Structures Under Shock and Impact VI (Editors. N. Jones & C.A. Brebbia) Cambridge England, pp331-338.
Jager, A.J 1992. Two New Support Units for the Control of Rockburst Damage. Rock Support in Mining and Underground Construction. Balkema, Rotterdam, pp621-631.
Jager, A.J., Wojno, L.Z. and Henderson, N.B. 1990. New Development in the Design and Support of Tunnel under High Stress Conditions.
Technical Challenges in Deep Level Mining, SAIMM.
Johannesburg, pp1155-1172. Kaiser, P.K, McCreath, D.R. and Tannant, D.D. 1996 Canadian Rockburst Support Handbook. Geomechanics Research Centre, Laurentian University, 700p. Kishi. N. Ikeda, K. Konno, H. and Kawase, R. 2000 Prototype Impact Test on Rockfall Retaining Walls and its Numerical Simulation. In Structures Under Shock and Impact VI (Editors N. Jones & C.A. Brebbia), Cambridge England, pp351-360. Kennedy, G. & Goodchild, C. 2003, Practical Yield Line Design, 1st Edition, British Cement Association.,175p. Li. T, Villaescusa E. and Finn. D, 1999. Continuous Improvement in Geotechnical Design and Practice, Australian Journal of Mining. Vol 14 , No 146, pp 46-51.
Li. T, Singh, U., and Coxon. J. A 2002. Case Study of Management of High Stress and Seismicity at Junction Mine. International Seminar on Deep and High Stress Mining. Section 29. Australian Centre of Geomechanics, Perth.
- 106 -
Lu, Y. Hao, H., Ma, G., and Zhou, Y. (2000) Shear Force in Structural Response to Blast Induced Ground Excitations. In Structures Under Shock and Impact VI (Editors N. Jones & C.A. Brebbia) Cambridge England, pp 99-107. Masuya, H. Yamamoto, M. Toyama, M. and Kajikawa, Y. (2000) Experimental Study on the Perforation of Steel Fibre Reinforced Concrete Slab by Impact. In Structures Under Shock and Impact VI (Editors N. Jones & C.A. Brebbia) Cambridge England, pp 205-214. McGarr, A Spottiswoode, S.M. Gay, N.C. and Ortlepp W.D. 1979. Observations Relevant to Seismic Driving Stress, Stress and Efficiency. J. Geophy. Res. B. Vol84, pp2251-2261. McGarr. A. 1999. On Relating Apparent Stress to the Stress causing Earthquake Fault Slip. J. Geophys. Res. Vol104, pp 3003-3011. McMichael, S. and Fucher, S. 1989.
Understanding Materials with Instrumented Impact.
Dynalup
Products Division, Santa Barbara, CA, Materials Engineering, April, 47-50.. Milev, A.M. Spottiswoode, S.M. Rorke, A.J. and Finne G.J. 2001. Seismic Monitoring of a Simulated Rockburst on a wall of an Underground Tunnel. J. Sth. African Institute Mining and Metallurgy Vol101 No.5 pp 253-260. Ortlepp, W.D. 1992. Invited lecture: The design of support for the Containment of Rockburst Damage in Tunnels - An engineering Approach. Rock Support in Mining and Underground Construction. Balkema, (Editors. P.K. Kaiser and D.R. McCreath), pp593 – 609. Ortlepp, W..D. 1997. Rock Fracture and Rockbursts an Illustrative Study. Monograph Series 9. SAIMM, 1997. Ortlepp, W..D. and Stacey. T.R. 1996. The Performance of Containment Rock Support such as Wire Mesh under Simulated Rockburst Loading. Proc. Geomechanics 1996. A.A Balkema, pp81-87. Ortlepp, W.D. and Stacey, T.R. 1997. Containment of Rockburst Energy with Appropriate Tunnel Support. International Symposium on Rock Support – Applied Solutions for Underground Structures. Norway 1997.
pp 609-620. Ortlepp, W.D. and Stacey, T.R. 1998. Performance of Tunnel Support under Large Deformation Static and Dynamic Loading. Tunnelling and Underground Space Technology Vol13, No1, pp15-21 1998. Ortlepp, W..D. Stacey, T.R. and Kirsten, H. Containment Support for Large Static and Dynamic Deformations in Mines. In International Symposium in Rock Support and Reinforcement Practice in Mining (Editors E. Villaescusa, C.R. Windsor & A.G. Thompson), pp359-364.
- 107 -
Ortlepp, W.D. and Swart, A. 2002. Dynamic Testing of Rockburst Support for Tunnels. International Seminar on Deep and High Stress Mining. Section 36. Australian Centre of Geomechanics, Perth. 2002.
Player, J.R. 2004. Field Performance of Cone Bolts at Big Bell Mine. 5th International Symposium of Ground Support and Reinforcement Practice in Mining. Balkema, (Editors E. Villaescusa & Y Potvin), 289-298. Player, J.R., Villaescusa, E. and Thompson A.G. 2004. Dynamic Testing of Rock Reinforcement Using the Momentum Transfer Concept. In 5th International Symposium of Ground Support in Mining and Construction (Editors E. Villaescusa and Y. Potvin), Balkema:Leiden, 327-339.
Roberts, M.K and Brummer, R.K. Support Requirements in Rockburst Conditions. Journal South African Institute Mining and Metallurgy. Vol88, No 3, pp97-104.
Scholz, C.H. 1990. The Mechanics of Earthquakes and Faulting. Cambridge University Press, 439pp. Smart, G.S and Schleyer G.K. (2000) Failure Characterisation of Clamped Aluminium Plates under Pulse Pressure Loading. Structures Under Shock and Impact VI (Eds. N. Jones, C.A Brebbia) Cambridge England pp 321-330. Spottiswoode, S and Churcher, J, 1988. The effect of backfill on the Transmission on Seismic Energy. Proc of SAIMM Symposium, Backfill in South African Mines. Johannesburg pp203-217.
Stacey, T.R. and Ortlepp, W.D. 1999. Retainment Support for Dynamic Events in Mines. Rock Support and Reinforcement Practice in Mining. Balkema 1999 pp 329-333
Stacey , T.R. and Ortlepp, W.D. 2002. Yielding Rock Support – The Capacities of Different Types of Support and Matching of Support Type to Seismic Demand. International Seminar on Deep and High Stress Mining. Section 34. Australian Centre of Geomechanics, Perth. 2002.
Thompson, A.G. Villaescusa, E. and Player, J.R. 2004. In 5th International Symposium of ground Support in Mining and Construction (Editors E. Villaescusa & Y. Potvin), Balkema:Leiden, 341-355.
Thompson, A.G. and C.R. Windsor 1993. Theory and Strategy for Monitoring the Performance of Rock Reinforcement. Proc. Australian Conference on Geotechnical Instrumentation and Monitoring in Open Pit and Underground Mining, Kalgoorlie, 21-23 June, 473-482, Balkema: Rotterdam. Villaescusa, E., Sandy, M. and Bywater, S. 1992. Ground support investigations and practices at Mount Isa, Proc. Int. Symp. on Rock Support. Sudbury, Ontario Canada, pp 185-193. Wagner, H. 1982. Support Requirements of Rockburst Conditions. In Proceeding of 1st International Conference on Rockburst and Seismicity in Mines. Johannesburg, pp209 – 218.
- 108 -
Whitesands Test Facility http://www.wsmr.army.mil/capabilities/st/testing/lab_fac/dyntest.html US Department of Defense – General Testing Facilities http://jcs.mil/technology/army.html Windsor, C.R. and A.G. Thompson 1996. Terminology in rock reinforcement practice. Proc of NARMS 96, Montreal, V1, 225-232, Balkema:Rotterdam.
16
BIBLIOGRAPHY
Albrecht, J.B. (2003) Investigation of factors related to rockburst damage in Western Australian mines. PhD thesis in progress, University of Western Australia, Perth, Australia.
AS 2294.2:1997 Earth-moving machinery – protective structures. Part 2: laboratory test and performance requirements for roll-over protective structures. Standards Association of Australia.
AS 2294.3:1997 Earth-moving machinery – protective structures. Part 3: laboratory test and performance requirements for falling object protective structures. Standards Association of Australia.
Brink, A.v.Z, Hagan, T.O., Spottiswoode, S.M., Malan, D.F., Glazer, S.N. and S. Lasocki (2000) GAP 608: Survey And Assessment Of Techniques Used To Quantify The Potential For Rock Mass Instability. Safety in Mines Research Advisory Committee – Final Project Report.
Durrheim, R.J., Roberts, M.K.C., Haile, A.T., Hagan, T.O., Jager, J.A., Handley, M.F., Spottiswoode, S.M., and Ortlepp, W.D. (1997) Factors Influencing the Severity of Rockburst Damage in South African Gold Mines. In Proceedings of SARES 97 – 1st Southern African Rock Engineering Symposium (Editors R.G. Gurtunca and T.O. Hagan) Johannesburg, pp. 17-24. Gutenberg, B. and Richter, C.F. (1944) Frequency of earthquakes in California. Bull. Seismol. Soc. Am. 34: pp. 185-188. Hudyma, M.R., Mikula, P.A. and Owen M.L. 2002. Seismic Hazard Mapping at Mount Charlotte Mine. In Proceedings of the 5th North American Rock Mechanics Symposium, Toronto, 07-10 July 2002 (Editors R.
Hammah, W.F. Bawden, J. Curran & M. Telesnicki), University of Toronto Press, Canada, pp1087-1094.
- 109 -
APPENDIX TERMINOLOGY The following terminology is used within this report. Reinforcement System
Comprises the reinforcing element (the bolt), an internal fixture (grout, mechanical or friction coupling), and an external fixture (face restraint). Support System
Maybe one or a combination of surface fixtures generally linked to the reinforcement system (w-straps, weld or chain link mesh, shotcrete or fibrecrete, sprayed membrane). Ground Support Scheme
Comprises a combination of the reinforcement system and support system. Seismic Event
A release of built up strain energy from the formation of excavations that does not result in a fall of ground or yielding of a ground support scheme. Energy travels in the rock mass as a wave with frequency and amplitude and is complex in shape. Rockburst
Caused by energy waves travelling through the rock mass causing a section of the rock mass to be detached from an excavation boundary that the energy wave encounters. The wave excites both the rock mass that remains behind after the rockburst, and also the rock ejected into an excavation. The ejected rock already has a velocity and does not accelerate further. The actions of the ground support scheme can reduce and stop the displacement of the rock provided it has sufficient capacity. Basically, either a fall of ground occurs or the ground support system yields and maintains the ejected rock. Rock Mass
The ground surrounding an excavation. During a seismic event, it constitutes both solid ground and fractured ground. Following a rockburst, it constitutes the rock not ejected into the excavation. Simulated Rock Mass
The drop beam and the steel rings of the test facility prior to impact.
- A1 -
Ejected Rock
The rock ejected as part of a rockburst that loads or fails the ground support scheme. The ejected rock was a constituent of the rock mass prior to the loading from the seismic event. Simulated Ejected Rock
The steel rings integrated with the borehole. Mining Dynamic Test Facility
A Mining Dynamic test Facility is specifically designed to test in tension, shear or combination, of ground reinforcement or support elements and, or ground support schemes, in a repeatable manner. Blast induced loading of ground support schemes (either on the surface or underground) does not fit this definition because of the difficulties in repeatability and variability within the rock mass at underground sites. Facilities that are configured to test ‘props’, in compressive loading from the hangingwall on to a support element, are not considered. Coefficient of Restitution
The Coefficient of Restitution (e) is defined as the ratio of velocity after and before an impact between bodies. The value of e is a measure of the energy lost in the collision. The value of e does not affect the Conservation of Momentum. A value of e = 1 corresponds to a perfectly elastic collision in which no energy is lost. A value of e = 0 corresponds to a perfectly plastic collision and the bodies cohere. In practice, the value of e lies between these two extremes. Conservation of Momentum
The momentum of an aggregate of bodies is constant when there is no external impulse. The application of the Conservation of Momentum principle applies to collisions or impact between bodies Creep
Creep is defined as deformation of a body that occurs while the applied loads are maintained constant. Impulse of Force
The impulse (P) of a force (F) is given by: P=Ft where t is time for which the force acts
- A2 -
Impulse-Momentum Principle
The change of momentum of a mass (m) during a time interval (t) is equal to the impulse exerted by a force (F) during this time interval. That is: mΔV= P Kinetic Energy
Kinetic energy (KE) of a mass is given by: KE = ½ M v2 where V = Velocity Load Relaxation
Load relaxation in a body is defined as the reduction of load that occurs while the deformation is maintained constant.
Density
Density of a material has units of mass per unit volume. Unit Weight
The unit weight of a material has units of force per unit volume. Mass
The mass (m) of a body is equal to its volume multiplied by its material density. Momentum
The momentum (M) of a mass (m) is given by M = mV Newton's First Law
Newton’s First Law states that an object will remain at rest or in uniform motion in a straight line unless acted upon by an external force
- A3 -
Newton’s Second Law
The change in an object's state of motion - its acceleration - is proportional to the magnitude of the force acting on the object along the direction of the net force. The rate of change in velocity (acceleration) with which an object moves is directly proportional to the magnitude of the force applied to the object and inversely proportional to the mass of the object. Therefore, for a mass (m) acted on by a force (F), the acceleration a is given by: a=F/m Potential Energy
In engineering terms, the potential energy (PE) of a mass (m) is given by: PE = mgH Where g = the acceleration due to gravity (assumed to be 9.81m/s2. And H = the height above an arbitrary datum. Resilience
The ability of a reinforcement system to absorb energy when deformed elastically and return to its original condition when the force is removed Used where the imposed transient forces are less than force capacity of the reinforcement system (e.g. blasting, earthquake loadings). Toughness
The ability of a reinforcement system to absorb energy and deform plastically (before “failing”) Used where the imposed transient forces may exceed the force capacity of the reinforcement system and where the imposed forces reduce with displacements (for example, high stress areas, strain and rock bursting) Weight
The weight of a mass (m) is mg. Work
The work done (W) by a force (F) moving through a distance (d) is given by: W=Fd
- A4 -
MERIWA PROJECT M349 DYNAMIC TESTING OF GROUND SUPPORT SYSTEMS PHASE 1 – ADDENDUM (Revision 0) ANALYSED TEST RESULTS
June 2005
Professor E. Villaescusa Dr A.G. Thompson Mr J.R. Player WA School of Mines
EXECUTIVE SUMMARY The purpose of this Addendum to the Final Report to MERIWA Project M349 – Dynamic Testing of Ground Support Systems is to provide a “live” document that will continue to be updated as new data related to dynamic testing of reinforcement systems become available. In this Revision 0, all the commissioning data tests are summarised and as much useful data have been extracted to provide better interpretation and understanding of the behaviour of reinforcement systems. Data are presented with direct applicability to the principles of better ground support design. These data were obtained in later tests that provided more reliable data due to the improved quality of the measurements and data acquisition. The reinforcement systems that have been tested to date can be classified into the three major classes of reinforcement systems: • Continuously Friction Coupled (CFC) – namely, split tube friction rock stabilisers. • Continuously Mechanically Coupled (CMC) – namely, cement grouted thread bar and strand. • Discrete Mechanically and Friction Coupled (DMFC) – namely, Cone bolts and yielding anchor cable bolts Some of the key findings from these tests are: • Friction Rock Stabilisers Generally the 47 mm FRS performed poorly with excessive displacements being associated with sliding – in some cases, the bolt detached completely from the anchor pipe. The energy absorbed (4 to 7 kJ) was low compared with the expected energy demand. • Cement Grouted Thread bar The thread bar performed reasonably well – the response involved both slip of the bar in the grout and element elongation. Energy absorbed was between ~10 and ~20 kJ. • Cone Bolts o
High strength Cement Grout The response involved both cone slip (small) and element elongation. Energy absorbed was ~20kJ.
o
Low strength Cement Grout
-i-
The response involved both cone slip (large) and minimal element elongation. Energy absorbed was over 30 kJ. • Cable Bolts The response of the plain strand cable bolts depended greatly on the configuration. If the anchor load transfer length was long enough (~2 metres), strand rupture occurred with ~15 kJ of energy absorbed. At lesser lengths, the strand was able to slip within the grout and the mass was retarded with between 23 and 42 kJ of energy absorbed. If a plate and barrel and wedge anchor are not used on the strand, then sliding failure of the lower pipe and loading mass occurred with 16kJ of energy absorbed before complete pull through of the strand from the collar pipe. These tests results have demonstrated that friction rock stabilisers do not have the properties required to withstand rockburst loading. Fully coupled thread bar and strand are capable of absorbing impacts with energies up to about 15 kJ – this capacity may be less than the energy generated in a rock burst (often suggested to be of the order of 25kJ per square metre). Cone Bolts in high strength cement grout are capable of absorbing about 20kJ of energy – energy is absorbed in both the cone pulling through the cement grout and element elongation. Cone Bolts in low strength cement grout are capable of absorbing energies in excess of 30kJ – by comparison with the high strength grout system, energy is mainly absorbed by the cone being pulled through the grout (consistent with the original design concept).
-ii-
CONTENTS 1
INTRODUCTION.................................................................................................................................1
2
CHARACTERISATION OF REINFORCEMENT SYSTEM RESPONSES .................................1
3
TEST PROGRAM ................................................................................................................................3 3.1 TEST CONFIGURATION ..........................................................................................................3 3.2 TYPES OF REINFORCEMNT SYSTEMS ................................................................................4 3.3 Cement Grouted Thread Bars ......................................................................................................4 3.3.1 Configurations ...............................................................................................................4 3.3.2 Results............................................................................................................................5 3.3.3 Interpretation.................................................................................................................5 3.4 Cone Bolts ...................................................................................................................................6 3.4.1 Results............................................................................................................................7 3.4.2 Interpretation.................................................................................................................7 3.4.2.1 22mm Cone bolts in high strength grout ........................................................... 7 3.4.2.2 22mm Cone bolts in low strength grout............................................................. 8 3.5 Friction Rock Stabilisers............................................................................................................10 3.5.1 Results..........................................................................................................................10 3.5.2 Interpretation...............................................................................................................11 3.6 Cable Bolts.................................................................................................................................14 3.6.1 Results..........................................................................................................................14 3.6.2 Interpretation...............................................................................................................15
4
CONCLUDING REMARKS..............................................................................................................16
A1 TERMINOLOGY .................................................................................................................................1 A2 STAGE I COMMISSIONING TESTING ..........................................................................................3 A2.1 TEST RESULTS AND OBSERVATIONS.................................................................................3 A2.1.1 Smooth Bar ....................................................................................................................3 A2.1.2 Thread Bar.....................................................................................................................3 A2.1.3 Cone Bolt .......................................................................................................................4 A2.1.4 Friction Stabiliser ..........................................................................................................6 A2.1.5 Cement Grouted Strand .................................................................................................7 A2.2 IMPORTANT LESSONS LEARNED ........................................................................................8 A2.2.1 Mass...............................................................................................................................8 A2.2.2 Pipe Interaction .............................................................................................................8 A2.2.3 Impact Surface – Buffer .................................................................................................9 A2.2.4 Surface Hardware – Attachment to the Bolt ..................................................................9 A2.2.5 Impact Velocity ............................................................................................................10 A3 REINFORCEMENT SYSTEM TESTS ............................................................................................11 A3.1 CEMENT GROUTED THREAD BAR.....................................................................................11 A3.2 CEMENT GROUTED CONE BOLT........................................................................................13 A3.3 FRICTION ROCK STABILISER .............................................................................................16 A3.4 CEMENT GROUTED CABLE BOLT......................................................................................19
-iii-
FIGURES Figure 1.
Schematic of testing arrangement showing the major components. ........................................... 3
Figure 2.
Broken thread bar after Test 11-3. .............................................................................................. 6
Figure 3.
Separation of pipes as a result of cone slip and element stretching. ........................................... 8
Figure 4.
Cone bolt element broken - cone did not slip inside high strength cement grout. ...................... 9
Figure 5.
Cone bolt element broken - cone did not slip inside high strength cement grout. ...................... 9
Figure 6
Complete slip of friction rock stabiliser from within anchor pipe. ........................................... 12
Figure 7
Excessive slip of friction rock stabiliser from within anchor pipe............................................ 13
Figure 8
Rupture of strand –requires high load transfer in both the anchor and collar regions............... 15
Figure 9
Unwinding of strand as a result of not using a plate and barrel and wedge anchor. ................. 16
Figure A1. Reinforcement load transfer from unstable rock to stable rock .................................................. 1 Figure A2. The components of a reinforcement system................................................................................ 2 Figure A3. Force-displacement response for Thread Bar 11-1. .................................................................. 11 Figure A4. Summary of energy-time responses for Thread Bar 11-1. ........................................................ 11 Figure A5. Force-displacement response for Thread Bar 11-2. .................................................................. 12 Figure A6. Summary of energy-time responses for Thread Bar 11-2. ........................................................ 12 Figure A7. Force-displacement response for Cone Bolt 32. ....................................................................... 13 Figure A8. Summary of energy-time responses for Cone Bolt 32. ............................................................. 13 Figure A9. Force-displacement response for Cone Bolt 60. ....................................................................... 14 Figure A10. Summary of energy-time responses for Cone Bolt 60. ............................................................. 14 Figure A11. Force-displacement response for Cone Bolt 61. ....................................................................... 15 Figure A12. Summary of energy-time responses for Cone Bolt 61. ............................................................. 15 Figure A13. Force-displacement response for 47mm Friction Stabiliser 62................................................. 16 Figure A14. Summary of energy-time responses for 47mm Friction Stabiliser 62....................................... 16 Figure A15. Force-displacement response for 47mm Friction Stabiliser 63................................................. 17 Figure A16. Summary of energy-time responses for 47mm Friction Stabiliser 63....................................... 17 Figure A17. Force-displacement response for 47mm Friction Stabiliser 64................................................. 18 Figure A18. Summary of energy-time responses for 47mm Friction Stabiliser 64....................................... 18 Figure A19. Force-displacement response for Cable Bolt 23. ...................................................................... 19 Figure A20. Summary of energy-time responses for Cable Bolt 23. ............................................................ 19 Figure A21. Force-displacement response for Cable Bolt 27. ...................................................................... 20 Figure A22. Summary of energy-time responses for Cable Bolt 27. ............................................................ 20
-iv-
Figure A23. Force-displacement response for Cable Bolt 19. ...................................................................... 21 Figure A24. Summary of energy-time responses for Cable Bolt 19. ............................................................ 21 Figure A25. Force-displacement response for Cable Bolt 22. ...................................................................... 22 Figure A26. Summary of energy-time responses for Cable Bolt 22. ............................................................ 22 Figure A27. Force-displacement response for Cable Bolt 26. ...................................................................... 23 Figure A28. Summary of energy-time responses for Cable Bolt 26. ............................................................ 23
-v-
TABLES Table 1.
Summary of thread bar configurations and test specification. .................................................... 4
Table 2.
Summary of thread bar configurations and results...................................................................... 5
Table 3.
Summary of cone bolt configurations and test specification. ..................................................... 6
Table 4.
Summary of Cone Bolt configurations and results. .................................................................... 7
Table 5.
Summary of split tube friction rock stabiliser configurations and test specification. ............... 10
Table 6.
Summary of friction rock stabiliser configurations and results. ............................................... 10
Table 7.
Summary of cable bolt configurations and test specification.................................................... 14
Table 8.
Summary of cable bolt configurations and results. ................................................................... 14
Table A1. Summary of commissioning test results and interpretations – Smooth Bar................................ 3 Table A2. Summary of commissioning test results and interpretations –Cement Grouted Thread Bar....... 3 Table A3. Summary of commissioning test results and interpretations – Cone Bolt................................... 4 Table A4. Summary of commissioning test results and interpretations – Friction Stabilisers..................... 6 Table A5. Summary of commissioning test results and interpretations – Cement Grouted Cable Bolts..... 7
-vi-
1
INTRODUCTION
This report is an Addendum to the Final Report of MERIWA Project M349 – Dynamic Testing of Ground Support Systems – Phase 1. It is intended that the report will be updated at intervals after new test results for reinforcement systems are obtained over the next three years. The report is also intended to be a standalone document – therefore some terminology associated with reinforcement systems and dynamic testing are included in Appendix 1. Phase 1 of MERIWA M49 was divided into two largely distinct activities: 1.
Construction of the facility and testing associated with the commissioning of the facility. In these tests it was expected during the commissioning period that some mistakes might be made and useful data might not be obtained.
2.
Routine testing of reinforcement systems with different configurations. In these tests, it was expected that reliable data would be obtained with direct applicability to the principles of ground support design.
As it turned out, much reliable data was obtained from the commissioning tests and is presented in this Addendum to the Final Report. Other useful data, though perhaps not directly applicable to the principles of ground support design, are presented in the Appendix 2. Appendix 3 provides the detailed outputs from the analysis of the data obtained from the routine tests.
2
CHARACTERISATION OF REINFORCEMENT SYSTEM RESPONSES
The two main indicators of reinforcement performance are: • Load-displacement response curves These provide an indication of the initial stiffness in response to loading, the peak and residual forces and the displacement capacity (should the reinforcement element fail). • Energy absorption capacity The energy absorption capacity of a reinforcement system can be estimated if one of the components of the system fails. If the system does not fail, then the test indicates that the energy absorption capacity is greater than that calculated. In this Addendum, summaries of information for each reinforcement system tested are provided in terms of: • measured maximum load transfer at the anchor load cells. • measured yield or displacement across the discontinuity following impact.
-1-
• assessment of performance of the system. For the later tests, detailed force-displacement response curves and energy-time curves were produced for all the components of the tests. These results are provided in Appendix 3. This information is preliminary in nature and at this stage is not a true characterisation of in situ reinforcement system performance because: • the energy and velocity of loading compared with the field is unknown. • the duration of impact compared with the field is unknown. Notwithstanding the above limitations of the tests, the performance indicators may be used to compare different reinforcement systems and to assess their likely effectiveness when loaded dynamically by a rockburst.
-2-
3
TEST PROGRAM
3.1
TEST CONFIGURATION
The test configuration is shown schematically in Figure 1. The important features of this diagram that will be mentioned in subsequent sections are: • The specimen to be tested consists of an upper (anchor) pipe and a lower (collar) pipe. • A load cell to measure force is located between the anchor pipe flange and the beam (all tests). • A load cell to measure the collar force is located between the plate and the external fixture (most tests). • Displacements of the beam and loading mass are measured in all tests. • Accelerometers are located on the beam and the loading mass.. • The element force at the reinforcement interface is derived from the accelerometer measurements Note that the upper load cell force is larger than the interface force due to the inertial effects associated with the upper pipe and the collar force is less than the interface force due to load transfer in the collar pipe. Flange welded to anchor pipe
Stiffened Deep Beam
Reinforcement Interface Flange welded to collar pipe
Loading mass comprising steel disks clamped to flange
Buffer
Buffer External Fixture
Plate
Figure 1.
Schematic of testing arrangement showing the major components.
-3-
3.2
TYPES OF REINFORCEMNT SYSTEMS
Energy absorption calculations have been performed for: •
Cement grouted thread bar
•
Cone bolts in both high strength and low strength cement grout
•
47mm Friction Rock Stabilisers
•
15.2mm plain strand in cement grout
•
Yielding anchor strand in cement grout
The reinforcement configurations tested and the results obtained are summarised in the following sections.
3.3
Cement Grouted Thread Bars
3.3.1
Configurations
Table 1.
Summary of thread bar configurations and test specification.
Test Number
11-1
11-2
Element
20mm Thread Bar
20mm Thread Bar
Internal Fixture
HS Grout
HS Grout
Anchor Length (m)
1.25
1.25
Collar Length (m)
1.0
1.0
Plate
Dome
Dome
Fixture
Washer and nut
Washer and nut
Loading Mass (kg)
2026
2026
Drop Height (m)
1268
1850
Impact Velocity (m/s)
5
6
-4-
3.3.2
Results
Table 2.
Summary of thread bar configurations and results.
Test Number
11-1
11-2
Element
20mm Thread Bar
20mm Thread Bar
Internal Fixture
HS Grout
HS Grout
Mode of Response
Slip in anchor pipe and element elongation
Slip in anchor pipe and element elongation
Peak Velocity (m/s)
1.4
1.4
Peak Force (kN)
230
245
Maximum Displacement (mm)
49
108
Energy Absorbed (kJ)
10
22
3.3.3
Interpretation
These tests were two consecutive drops on the same sample. The first drop was lower velocity than the second one. It is inferred that the first drop caused some fracturing of the element/grout interface. The second drop caused further fracturing of the grout and slip of the element. There was also evidence of damage to the zinc coating at the interface between the upper and lower pipes. This indicated that the bar had been loaded above its yield strength. A third drop (results not shown) resulted in rupture of the bar as shown in Figure 2.
-5-
Figure 2.
3.4
Broken thread bar after Test 11-3.
Cone Bolts
Table 3.
Summary of cone bolt configurations and test specification.
Test Number
32
60
61
Element
Cone Bolt
Cone Bolt
Cone Bolt
Internal Fixture
HS Grout
LS Grout
LS Grout
Anchor Length (m)
1.25
1.25
1.25
Collar Length (m)
1.0
1.0
1.0
Two Dome plus rubber Washer and nut
Two Dome plus rubber Washer and nut
Dome plus rubber Washer and nut
Initial Tension (kN)
133
61.6
80.0
Loading Mass (kg)
2032
2032
2032
Drop Height (m)
1268
1850
1850
Impact Velocity (m/s)
5
6
6
Plate Fixture
Note: HS means high strength grout that is defined as having an unconfined compressive strength of over 40MPa, LS means low strength grout that is defined as having an unconfined compressive strength of less than 20MPa.
-6-
3.4.1
Results
Table 4.
Summary of Cone Bolt configurations and results.
Test Number
32
60
61
Element
Cone Bolt
Cone Bolt
Cone Bolt
Internal Fixture
HS Grout
LS Grout
LS Grout
Mode of Response
Anchor slip and element elongation
Anchor slip and element elongation
Anchor slip and element elongation
Peak Velocity (m/s)
2.7
3.7
3.2
Peak Force (kN)
200
245
120
Residual Force
190
130
110
Maximum Displacement (mm)
102
283
265
Anchor Slip (mm)
78
280
264
Energy Absorbed (kJ)
20
34
30
3.4.2 3.4.2.1
Interpretation 22mm Cone bolts in high strength grout
Only the first drop results are summarised in the table. Subsequent tests showed that the loss of collar tension from the first drop caused changes in performance of the bolt from the second test onwards, particularly with the high strength grout. It is inferred that cone slip is more likely to occur in high strength grout with a high element tension and the surface hardware held tightly. The high strength grout also results in stretching of the element during the first drop. Subsequent drops showed that the element yielded (stretched) significantly in preference to the cone pulling through the grout and the element failed on the third drop. It is also worth noting that each drop resulted in additional deformation and loading of the surface hardware. The hard strength grout requires that two, thin steel dome plates are used to ensure that the washer and nut do not flatten the dome and pull through. The rubber plate assists in softening the system but does not prevent damage to the steel plates.
-7-
3.4.2.2
22mm Cone bolts in low strength grout
There was little or no evidence of damage to the plates and they remained tight against the bearing surface of the loading mass. In this case, the bolts behaved consistently for each drop and they survived three drops. The energy absorption is high because of the large displacements that resulted. With low strength cement grout, the cone is able to pull through the grout and limit the loading on the surface hardware. Therefore, only a single dome plate is required.
Figure 3.
Separation of pipes as a result of cone slip and element stretching.
-8-
Figure 4.
Cone bolt element broken - cone did not slip inside high strength cement grout.
Figure 5.
Cone bolt element broken - cone did not slip inside high strength cement grout.
-9-
3.5
Friction Rock Stabilisers
Table 5.
Summary of split tube friction rock stabiliser configurations and test specification.
Test Number
62
63
64
Element
47mm FRS
47mm FRS
47mm FRS
Internal Fixture
Steel/Grout Friction
Steel/Grout Friction
Steel/Grout Friction
Anchor Length (m)
0.9
1.6
2.1
Collar Length (m)
1.4
0.62
0.22
Plate
Part Combi/Dome
Part Combi/Dome
Part Combi/Dome
Fixture
Welded Ring
Welded Ring
Welded Ring
Initial Tension (kN)
N/A
N/A
N/A
Loading Mass (kg)
2058
717
705
Drop Height (m)
1850
816
816
Impact Velocity (m/s)
6
4
4
Note that a procedure was developed to create a simulated borehole in a sand/cement grout contained within a steel tube. The friction rock stabilisers were then installed by a jumbo.
3.5.1
Results
Table 6.
Summary of friction rock stabiliser configurations and results.
Test Number
62
63
64
Element
47mm FRS
47mm FRS
47mm FRS
Internal Fixture
Steel/Grout Friction
Steel/Grout Friction
Steel/Grout Friction
Mode of Response
Anchor slip
Anchor slip
Anchor slip
Peak Velocity (m/s)
6
4.2
3.3
Peak Force (kN)
40*
110
120
Residual Force (kN)
0
15
10
Maximum Displacement (mm)
>900
>1300
572
Energy Absorbed (kJ)
4
6#
7
* Static pull of 160kN per 2.3 m embedment length before test. # - energy absorbed after 950mm of slip
- 10 -
3.5.2
Interpretation
In the first test, the energy was well in excess of the capacity of the bolt and there was little evidence of the loading mass being slowed. The toe end of the bolt pulled out from the upper pipe. In the subsequent tests, the anchor length was increased and the energy input reduced (less mass at lesser velocity. As expected, the energy absorbed increased as the anchor length was increased. However, the second test still resulted in failure by slip of the element from within the upper pipe. In the third test with the longest anchor length (possibly unrealistic in practice), the loading mass was arrested but with nearly 600mm of pull out from the upper pipe. This amount of displacement would be considered unacceptable in an operating mining situation.
- 11 -
Figure 6
Complete slip of friction rock stabiliser from within anchor pipe.
- 12 -
Figure 7
Excessive slip of friction rock stabiliser from within anchor pipe.
- 13 -
3.6
Cable Bolts
Table 7.
Summary of cable bolt configurations and test specification.
Test Number
23 15.2 mm Superstrand HS Cement Grout
27 15.2 mm Superstrand HS Cement Grout
19 15.2 mm Superstrand HS Cement Grout
22 15.2 mm Superstrand HS Cement Grout
26 15.2 mm Superstrand HS Cement Grout
Anchor Length (m)
1.5
1.96
1.96
1.96
1.58
Collar Length (m)
1.08
0.62
0.62
0.62
1.0
Plate
Flat Steel
Flat Steel
No Plate
Fixture
Barrel and Wedge
Barrel and Wedge
Initial Tension (kN)
50
Loading Mass (kg)
Element Internal Fixture
Barrel and Wedge
Flat Steel and Rubber Barrel and Wedge
Barrel and Wedge
50
N/A
50
50
2026
2026
2026
2026
2026
Drop Height (m)
1850
1850
1850
1850
1850/810
Impact Velocity (m/s)
6
6
6
6
6/4
3.6.1
No Plate
Results
Table 8.
Summary of cable bolt configurations and results. Test Number
23 15.2 mm Superstrand HS Cement Grout
27 15.2 mm Superstrand HS Cement Grout
19 15.2 mm Superstrand HS Cement Grout
22 15.2 mm Superstrand HS Cement Grout
Peak Velocity (m/s)
2.5
2
6
4
5.6
Peak Force (kN)
200
285
55
250
140
Residual Force (kN)
160
0
0
0
50
Maximum Displacement (mm)
130
80
>400
90
700
Energy Absorbed (kJ)
23
15
16
16
42
Element Internal Fixture Mode of Response
26 15.2 mm Superstrand HS Cement Grout Sliding-Mass Mass Retarded Strand Rupture Sliding Failure Strand Rupture Retarded
- 14 -
3.6.2
Interpretation
The strand was able to slip relative to the cement grout when there was 1.5m of embedment in the upper pipe (Tests 23). When this length was increased to 1.96m (Test 22 and 27), rupture of the strand occurred. This demonstrates that the general design “rule-of-thumb” that there should be about 2m embedment of strand to mobilise its strength capacity (250kN) is appropriate. When the strand ruptures, about 15 kJ of energy is absorbed. Greater energy absorption results when sliding can occur at relatively high loads (Tests 23 and 26). A short collar embedment length without a plate and barrel and wedge anchor resulted in an uncontrolled sliding failure at low force. This demonstrates the importance of anchors on strands, particularly in rockburst prone areas of a mine.
Figure 8
Rupture of strand –requires high load transfer in both the anchor and collar regions.
- 15 -
Figure 9
4
Unwinding of strand as a result of not using a plate and barrel and wedge anchor.
CONCLUDING REMARKS
Details have been presented of the dynamic tests of reinforcement systems conducted up to May 2005. The results from these tests have clearly demonstrated that the facility is able to generate impact loadings sufficient to break high capacity reinforcement systems.
The results have also demonstrated that
substantial differences exist between the responses to dynamic loadings compared with those obtained in static tests.
- 16 -
APPENDICES A1
TERMINOLOGY
Reinforcement System Comprises the reinforcing element (the bolt), an internal fixture (grout, mechanical or friction coupling), and an external fixture (face restraint). Support System Maybe one or a combination of surface fixtures generally linked to the reinforcement system (w-straps, weld or chain link mesh, shotcrete or fibrecrete, sprayed membrane). Ground Support Scheme Comprises a combination of the reinforcement system and support system. Load Transfer Concept The load transfer concept for reinforcement and support systems involves considering the response of these systems to rock movement. In the case of a reinforcement system, it is assumed that the reinforcement transfers force across a distinct interface or zone between unstable and stable rock as shown in Figure A1.
Unstable Surface Region
Stable Interior Region
Excavation
Figure A1.
Reinforcement load transfer from unstable rock to stable rock
- A1 -
Reinforcement System Load Transfer A reinforcement system can be considered to consist of 4 components as shown in Figure A2; namely: 0.
The rock.
1.
The element.
2.
The internal fixture.
3.
The external fixture.
Figure A2.
The components of a reinforcement system.
The response of the reinforcement system to rock loading involves several modes of load transfer between the various components. The modes of load transfer between the element and rock lead to a simple classification system described by Windsor and Thompson (1996). This classification system resulted in only three basic classes of reinforcement systems; namely: 1.
Continuously Mechanically Coupled (CMC) Systems.
2.
Continuously Frictionally Coupled (CFC) Systems.
3.
Discretely Mechanically or Frictionally Coupled (DMFC) Systems.
It can be easily demonstrated that all commercial reinforcement systems can be considered to fit within one of these three classes.
- A2 -
A2
STAGE I COMMISSIONING TESTING
The following notes summarise the learning process from Stage I testing at the WASM Dynamic Test Facility.
A2.1
TEST RESULTS AND OBSERVATIONS
The following tables briefly describe each bolt tested and comments on the results obtained. A2.1.1 Table A1.
Smooth Bar Summary of commissioning test results and interpretations – Smooth Bar.
Bolt Element Number Type
Drops
Mass
Heights
Results and Comments
14
Smooth Bar
9
500kg Concrete
100400
Eccentric concrete mass.(500kg) Resulted in 287mm slip Net to cut out welds between pipes and noise dampening required
13
Smooth Bar
3
500kg Concrete
400 3m/s
Slip of 150mm. Improved understanding of instrumentation Better noise reduction required.
13
Smooth Bar
1
500kg Steel*
1000
Slip of 325mm slip Improved performance from instrumentation
* Concentric steel rings used hereafter A2.1.2 Table A2.
Thread Bar Summary of commissioning test results and interpretations –Cement Grouted Thread Bar.
Bolt Element Number Type 1
2
Thread Bar
Thread Bar
Drops
Mass
Heights
3
500kg
1000
Stripped nut No load transfer ring to measure force
10001850
Load transfer ring Additional and changed sensor locations, 190mm stretching / slip, consistent bolt changes with each drop Substantial work on strain gauge setup
21
500kg
Results and Comments
- A3 -
Table A2.
Summary of commissioning test results and interpretations –Cement Grouted Thread Bar.
Bolt Element Number Type
Drops
Mass
Heights
Results and Comments
4
Thread Bar
1
1500kg
1280 = 5m/s
Approximately 19kJ of energy input. Stripped the nut (was not fully engaged) and pulled the lower pipe length off the grout around the bolt. Anchor and collar forces suggest 80kN to cause pipe slip. All pipes in future to have additional load transfer via the use of shear pins installed through the wall of the pipe and into the grout. Buffer compression trailed.
11
Thread Bar
3
2000kg
1245 1845
First drop uneven and slower than ideal. 117mm of separation by the second drop. Element pulled out of grout on the third drop.
A2.1.3 Table A3.
Cone Bolt Summary of commissioning test results and interpretations – Cone Bolt.
Bolt Element Number Type
31
34
Cone Bolt
Cone Bolt
34
Cone Bolt
34
Cone Bolt
Drops
10
10
3
3
Mass
Heights
Results and Comments
500kg
1800 = 6m/s
Load transfer ring 104mm total slip and yield Buffer response assessed Consistent response with each drop
500kg
500kg
500kg
1800
No load transfer ring 108mm of total separation 20ms loading time measured by anchor load cells Increase strain gauge excitation voltage. Consistent response with each drop
1800
Change force ring to load cell at the collar. Same forces recorded by collar and anchor load cells and same occurrence time for the peak due to debonding and yield of the cone bolt.
1800
Buffer pre-compression device trialled to increase buffer stiffness No gain in shock but reduction in travel distance of buffer.
- A4 -
Table A3.
Summary of commissioning test results and interpretations – Cone Bolt (continued).
Bolt Element Number Type
38
Cone Bolt
37
Cone Bolt HS Cement Grout
37 (cont)
Cone Bolt HS Cement Grout
37 (cont)
Cone Bolt HS Cement Grout
42
Cone Bolt HS Cement Grout
60
Cone Bolt LS Cement Grout
Drops
Mass
Height/ Velocity
Loading time 70ms. The shock recorded by the accelerometer on the mass becomes less as the resisting force provided by the bolt becomes less. 114mm of total separation from all tests. . 19kJ input per test; estimate that ~10kJ absorbed by the bolt per drop. Buffer pre-compression trialled
3
500kg
1
Anchor load cell recorded 180 to 220kN for a duration of 50ms 1275mm 48mm of separation. 1500kg 5m/s Approx 8.5 to 10.5kJ absorbed by bolt while 19kJ absorbed by buffers
3
4
4
3
1500kg
1500kg
1500kg
2000kg
1280
Results and Comments
1835 = 6m/s
Yielding of element, anchor force curve stiffened with each test, possibly due to work hardening of the bolt 197mm of yield from the 3 tests.
2500 = 7m/s
Yielding of element Anchor force high for short time period 50ms, In 6th drop, when the cone slipped in the grout, duration of loading was 130ms. 380mm of separation from the 5th to 7th drops, and then bolt failed on the 8th and final drop. End of trials with buffer pre-compression
1265 1845
First drop at 5m/s – them rest at 6m/s. Load cells recording on collar and anchor, 155mm of total separation from the first three test, then stripped nut on the 4th test (was not fully engaged) Cone movement of 40mm and element stretch of 115mm recorded.
1850 = 6m/s
Low strength grout mix with limestone to improve slide capacity of the bolt. Double steel dome plate combined with flat rubber plate. Excellent performance - sliding with minimal stretching of the element Anchor loads were of the order of 150-160kN (less than the element yield strength) 950mm of displacement produced by the three drops.
- A5 -
Table A3.
Summary of commissioning test results and interpretations – Cone Bolt (continued).
Bolt Element Number Type
61
32
A2.1.4 Table A4.
Cone Bolt LS Cement Grout
Cone Bolt HS Cement Grout
Mass
Height/ Velocity
Results and Comments
4
Low strength grout mix with limestone to improve slide capacity of the cone. Excellent performance – element stretched when the cone 1850 = caught on tabs used to stop grout sliding. 6m/s (3 Long duration of pull when clear of tabs with up 2000kg drops) 4th to 0.17s pull time of the cone coming through drop at the grout, at 110-130kN. 1550. 1004mm of total yield from the 4 drops without failing the bolt. These tests performed with a single dome plate.
4
133kN of pretension at collar. High surface tension resulted in very little bolt stretch but predominately cone slip. 1850- For the later tests, after tension is lost, response is 2600, different – appears that bar stretches in preference 2000kg 6m/s and to cone slip. 7m/s Very high load recorded on the anchor cells (up to 270kN) Shows the need to re-tension element between tests if tension lost.
Friction Stabiliser Summary of commissioning test results and interpretations – Friction Stabilisers.
Bolt Element Number Type
62
Drops
Friction Rock Stabiliser
63
Friction Rock Stabiliser
64
Friction Rock Stabiliser
Drops
1
1
1
Mass
2000kg
717kg
705kg
Height/ Velocity
Results and Comments
1835
Only 1.0m of embedment above the simulated discontinuity. Static pull test showed the 2.4m friction stabiliser had a pull capacity of 160kN. Friction stabiliser absorbed very little energy.
815
1.3m of embedment above the discontinuity (allowing for some loss of length due to tapering at the end of the friction stabiliser and at the collar. This bolt was not pull tested. Pulled straight out peak load 110kN and then dropped off to almost nothing as it continued to pull out.
815
2.1m of embedment above the discontinuity. The bolt was not pull tested. Under dynamic loading the bolt recorded a peak load of ~ 120kNfollowed by sliding at ~30kN. A total separation of 570mm occurred at the interface.
- A6 -
A2.1.5 Table A5.
Cement Grouted Strand Summary of commissioning test results and interpretations – Cement Grouted Cable Bolts.
Bolt Element Number Type
23
Plain Strand HS Cement Grout
29
Plain strand HS Cement Grout
27
Plain strand HS Cement Grout
22
Plain strand HS Cement Grout
19
Plain strand HS Cement Grout
Drops
2
1
1
1
1
Mass
2000kg
2000kg
2000kg
2000kg
2000kg
Height/ Velocity
Results and Comments
1850
Cable slipped in the anchor pipe with this embedment length; 141mm on the first drop and 290mm on the second drop. Matches static idea that plain strand requires 2.0m of embedment to enable load transfer equal to the strength of the strand.
1850
1850
1850
1850
Broke the cable on the first drop. Cup and cone fractures of the individual cable wires in the strand.
Broke the cable on the first drop. Cup and cone fractures of the individual cable wires in the strand. This result is consistent with Test 29.
Rubber plate added and the bolt sat tensioned for 5 days. Bolt broke on first drop, but also accompanied by partial slip of the cable and barrels and wedges. Energy absorption part way between the unplated strands with 1.5m of embedment and 1.96m of embedment. Stripped with very low load transfer of ~ 50kN. Shows the importance of the plate and barrel and wedge anchor in dynamic loading situations.
- A7 -
A2.2
IMPORTANT LESSONS LEARNED
Learning points from the commissioning and testing completed to date with examples of the testing processing and reinforcement systems are discussed in terms of: •
Mass
•
Pipe interaction
•
Impact surface - buffer
•
Surface hardware – attachment to bolt
•
Impact Velocity
In the following sections, the test numbers are those used in the tables above. Preliminary assessments are provided for energy absorption and dynamic load capacity of reinforcement systems. A2.2.1
Mass
Learnt:
The loading mass (including the lower pipe) should exceed the mass of the drop beam and the upper pipe.
Reason:
To ensure that the buffer performance and energy absorption does not dominate the response of the reinforcement, and that the response of the reinforcing element is also characterised, there needs to be more mass below the top of the buffers. The relative velocity between the loading mass and the drop beam are important in characterising the reinforcement response.
Examples:
Smooth bar Bolt 14, Smooth bar bolt 13, Thread bar bolt 2, Cone bolt 31, Cone bolt 34, involved tests with the loading mass less than drop beam.
Exceptions:
Extremely low capacity bolts under dynamic conditions will be less influenced by this limitation.
A2.2.2
Pipe Interaction
Learnt:
Changed the loading mass from an eccentric concrete block to concentric steel rings, added a load transfer ring to the collar pipe and added shear pins through the pipe into the cement grout.
Reason:
This simulates loading mechanism more accurately as the borehole is drilled into the rock mass and hence must be directly coupled to the rock mass and is not a separate entity to the rock mass. It also assisted in a reduction of eccentric loading at the head of the bolt. The use of shear pins stops the grout sliding out of the pipe; the pipe is smoother and straighter than a real borehole.
Examples:
Smooth bar Bolt 14 and Smooth bar bolt 13 to a later test on Bolt 13 – concrete block to steel rings.
- A8 -
Thread bar Bolt 1 to Thread bar Bolt 2 – change in performance of the bolt with the use of the load transfer ring. Thread bar Bolt 4 to Thread bar Bolt 11; every test after bolt 4 used the load transfer ring. Thread Bar 4 stripped on the first drop of 1500kg and 5m/s but also there were no shear pins from the pipe to the grout. Analysis suggests effective load transfer of 80kN/m from the wall of the pipe to the grout. Exceptions:
The load transfer ring is less critical for elements that are fully decoupled from the lower length of pipe. The shear pins are not required for elements that are fully decoupled from the grout in the lower pipe; but after bolt 4, for standardisation purpose, shear pins were installed in the upper and lower pipes to ensure the grout does not move.
A2.2.3
Impact Surface – Buffer
Learnt:
Buffer response is a function of the total drop mass, drop velocity and effect of the load transfer from the loading mass up the reinforcement system to the drop beam. Buffer response can be modelled through software written as part of the project. Pre-compression of the buffers to increase the initial response stiffness was ineffective. Buffer performance can be best changed by increasing the mass of the piston; this will make the response stiffer by providing more inertia against acceleration during and immediately following impact.
Reason:
Pre-compression of the buffers only seemed to reduce the stroke length of the buffer.
Examples:
Cone Bolt 34, Cone Bolt 38 and Thread Bar 4, showed minimal changes in the shock loading through the bolt with repeated tests with no compression, 20mm compression and 15mm compression. Buffer only has maximum travel distance of 114mm.
Exceptions:
N/A
A2.2.4
Surface Hardware – Attachment to the Bolt
Learnt:
It is critical to have full engagement of every thread on a nut. Fine thread nuts are less sensitive than course thread nuts.
Reason:
Under dynamic loading of the bolts, stripping of the nut occurred when the thread was not fully engaged. This applied even when the nut was only one thread short of being fully engaged.
Examples:
Cone Bolt 42 – nut stripped off on the 4th drop during the bolt stretching stage, one thread short. Thread Bar 1 stripped on the third drop but there was no load transfer ring so the 1000kg of the drop mass was being applied directly to the surface hardware. This is important in dense rock masses where there is no load transfer between the rock mass and the shaft of the bolt because the collar of the hole is not grouted or the front shaft of the bolt is debonded. Cable bolt 19, stripped the mass off the cable at a load transfer of approximately 50kN, where as the use of the plate generates full load transfer in the cable and causes the cable to break or yield, depending on the embedment length above the simulated discontinuity.
Exceptions:
A surface fixture should be used for dynamic loading situations. It is considered poor practice to rely solely on load transfer between the element and cement grout in the collar region where the quality and length of encapsulation may be questionable.
- A9 -
A2.2.5
Impact Velocity
Learnt:
It is difficult to test an impact velocity of less than 3m/s. The manufacture has de-rated the buffers to a maximum impact velocity of 6m/s.
Reason:
A drop height of ~400mm is required for the 3m/s at impact. This does not allow much travel distance if there are problems with the release to achieve consistent sliding. This is particularly the case where the loading mass was less than ~500kg. The maximum impact velocity is not the most important factor – the velocity of loading of the reinforcement system is the relative velocity between the loading mass and the beam and the mass. This velocity is initially zero and rapidly builds up to maximum before the reinforcement force causes a deceleration. The velocity variation with time is determined during analysis and can be related to the reinforcement force-displacement response and the energy absorbed.
Examples:
Smooth bolt 14 – commissioning drops of less than 3m/s. Cone bolt 37 – third set of drops used 7m/s impact velocity and buffer compression of 15mm without apparent bottoming out or damage to the buffers. The provision of additional mass to the buffer piston can be used to enable higher impact velocities.
Exceptions:
Current base testing parameters of 2000kg at 6m/s seems to provide sufficient energy input for the elements tested. High strength elements (up to 250kN) can be ruptured with energies absorbed being more than 30kJ.
- A10 -
A3
REINFORCEMENT SYSTEM TESTS
A3.1
CEMENT GROUTED THREAD BAR
Figure A3.
Force-displacement response for Thread Bar 11-1.
Figure A4.
Summary of energy-time responses for Thread Bar 11-1.
- A11 -
Figure A5.
Force-displacement response for Thread Bar 11-2.
Figure A6.
Summary of energy-time responses for Thread Bar 11-2.
- A12 -
A3.2
CEMENT GROUTED CONE BOLT
Figure A7.
Force-displacement response for Cone Bolt 32.
Figure A8.
Summary of energy-time responses for Cone Bolt 32.
- A13 -
Figure A9.
Force-displacement response for Cone Bolt 60.
Figure A10. Summary of energy-time responses for Cone Bolt 60.
- A14 -
Figure A11. Force-displacement response for Cone Bolt 61.
Figure A12. Summary of energy-time responses for Cone Bolt 61.
- A15 -
A3.3
FRICTION ROCK STABILISER
Figure A13. Force-displacement response for 47mm Friction Stabiliser 62.
Figure A14. Summary of energy-time responses for 47mm Friction Stabiliser 62.
- A16 -
Figure A15. Force-displacement response for 47mm Friction Stabiliser 63.
Figure A16. Summary of energy-time responses for 47mm Friction Stabiliser 63.
- A17 -
Figure A17. Force-displacement response for 47mm Friction Stabiliser 64.
Figure A18. Summary of energy-time responses for 47mm Friction Stabiliser 64.
- A18 -
A3.4
CEMENT GROUTED CABLE BOLT
Figure A19. Force-displacement response for Cable Bolt 23.
Figure A20. Summary of energy-time responses for Cable Bolt 23.
- A19 -
Figure A21. Force-displacement response for Cable Bolt 27.
Figure A22. Summary of energy-time responses for Cable Bolt 27.
- A20 -
Figure A23. Force-displacement response for Cable Bolt 19.
Figure A24. Summary of energy-time responses for Cable Bolt 19.
- A21 -
Figure A25. Force-displacement response for Cable Bolt 22.
Figure A26. Summary of energy-time responses for Cable Bolt 22.
- A22 -
Figure A27. Force-displacement response for Cable Bolt 26.
Figure A28. Summary of energy-time responses for Cable Bolt 26.
- A23 -