Dynamic Topology Orchestration for Distributed Cloud-Based Applications Alexandru-Florian Antonescu∗‡ , Philip Robinson† , Torsten Braun‡ ∗ SAP
(Switzerland) Inc., Althardstrasse 80, 8105 Regensdorf, Switzerland (UK) Limited, The Concourse, Queen’s Road, Queen’s Island, Titanic Quarter, Belfast BT3 9DT, UK ‡ University of Bern, Communication and Distributed Systems (CDS), Neubrueckstrasse 10, 3012 Bern, Switzerland
[email protected],
[email protected],
[email protected] † SAP
Abstract—This paper describes a specification language and architecture for managing distributed software and mapped compute, storage and network infrastructure services dynamically, beyond the state of the art in cloud computing. This is referred to as dynamic application topology orchestration, where the mapping and configuration of distributed, interconnected, interdependent application services and infrastructure resources are dynamically adjusted, according to guarantees in Service Level Agreements (SLAs) and operational constraints. The viability and benefits of this architectural approach are compared against simpler strategies, to establish technical and business cases for the associated engineering effort.
I. I NTRODUCTION Cloud-computing is an evolution of utility-computing [1] and virtual organizations [2]. Computational, storage and network resources are acquired for specific purposes, usages and time-frames, for an agreed price by resource providers to consumers. Meanwhile, enterprise applications continue to become more decoupled, service-oriented and composed of multiple layers [3]. These two trends in infrastructure resource acquisition and enterprise application architecture provide an opportunity for various stakeholders. Application architects are able to design scalable solutions with increased assurance that the infrastructure can respond to their scaling models. Therein, application users experience more consistent quality, within the context of Service Level Agreements (SLAs), without exposure to the underlying complexities of infrastructure ownership and maintenance. Moreover, the infrastructure providers and integrators run a more efficient infrastructure operation, by having insight into the initial and dynamic requirements of hosted applications and associated SLAs. Although these opportunities continue to be acknowledged in the literature ([3], [4], [5], [6]), there is still a need for comprehensive solutions that deal with (1) distributed applications with interdependencies and (2) alignment of technical and business requirements for infrastructure expressed in SLAs. We define this need as dynamic application topology orchestration, where an application topology is a structural specification of how distributed services are to be deployed and interconnected on any selected execution environment (see section III-A for a formal description). The paper continues with section II, providing an overview of existing work that motivates and enables our approach, as well as related work that influences our problem analysis
and identification of strategies against which we can compare. Section III describes the conceptual models of our approach, while Section IV describes the technical realisation of the approach, summarising the key capabilities and workflow. Section V provides a value model for the domain and applies this to a case study to evaluate our approach against alternative strategies. Conclusions and future work are summarised in Section VI. II. BACKGROUND AND R ELATED W ORK This section discusses relevant work in the areas of distributed cloud-based applications and approaches to their topology orchestration and management. A. Distributed Cloud-based Applications We classify four models of distributed cloud-based applications found in literature and practice. Redundancy-based models replicate functionality in different locations for the purpose of fault mitigation or load-balancing. Capability-based models arise when individual components and services of a single application have different compute and storage requirements that are not likely to be found in one location. Workflowbased models the necessity and scheduling of individual components and services follow a predefined control-flow, such that collocation and co-activation is inefficient and potentially conflicting. Finally, the fourth model is concurrency-based, where there is a performance gain in job decomposition, parallel processing and result aggregation. For each of these models there are a set of common challenges that start with the initial specification of how application components should be distributed, interconnected, monitored, maintained and eventually terminated. The challenges extend to the selection of distributed resources and the coordination of operations performed on the runtime of the service. There are currently no best practices established for these challenges nor evaluation models for solutions. B. Topology Orchestration and Cloud Management There is currently one industrially-endorsed standardisation effort in the area of application topology specification to our knowledge, known as the Topology and Orchestration Specification for Cloud Applications (TOSCA) [7]. We hence use this as our starting point for exploring the anatomy of
application and service topologies. TOSCA is a language used for defining both the service components of distributed applications (topology), as well as the service management interfaces (plans). Service orchestration is realized by describing the interactions between the services using workflows, called plans. We extend the TOSCA concepts by adding SLA metrics and scaling rules for both the services and the associated infrastructure (compute, storage, network) resources. For the purpose of service specification, we considered the Unified Service Description Language (USDL)[8], a domainindependent service description language aimed at expressing both technical and business aspects. USDL enables description of capabilities and non-functional characteristics of services, allowing complex interactions to be captured. An extension of USDL, the USDL-SLA [9] enables attaching guaranteed service states and actions in SLAs to service descriptions. We extend the USDL capabilities with aspects related to network service management and more general service monitoring. Much of the initial problem identification and definition was carried out in the Generalised Architecture for Infrastructure Services (GEYSERS) project[10], which aims to deliver an architectural blueprint and platform for seamless and coordinated provisioning of connection-oriented networking (primarily optical) and IT (application, compute and storage) resources as infrastructure services. Our involvement in this project is to provide insights into how application management could benefit from this holistic approach to infrastructure virtualization. C. Related Work Liu et. al. [5] describe a data-centric approach to cloud orchestration by modeling the resources as data structures, which are then queried and updated using transactional semantics: views, constraints, actions, stored procedures and transactions. We follow similar design principles, including the declarative approach to orchestration description and separation of logical and physical aspects. However, their novel data-centric approach introduces a new computational model for cloud management, whereas we seek to enhance the capabilities of existing management systems where possible. Juve and Deelman [4] present a system for cloud infrastructure management with a similar approach envisioned by us, but only focus on the initial distributed application deployment and not on dynamic scaling of virtual resources and response to adaptation triggers. They also do not consider the impact and provisioning of network resources. Malawski et al. [11] consider how to optimally provision for multiple a priori known workflow ensembles with varying deadline and budget constraints. However, they do not consider the network as a critical part of the topology orchestration and focus only on the workflow model rather than the structural aspects of the application topology. They are also considering a fixed pool of VMs, which does not change during the workflow runtime. In contrast, we propose scaling the number of virtual machines (VMs) based on the service load defined through SLA guaranteed actions, applicable to all distribution models.
Kim et al. [12] describe a master-agent task scheduler based on the CometCloud management system, able to provision and size virtual infrastructures composed of VMs in hybrid infrastructure environments. Their system is able to operate in an autonomous manner and to recover from node failures. They however do not address SLA guarantees, or how the network is treated as a managed resource. Lu et al. [6] take another perspective on the problem of SLA-based planning by considering how to optimise decisions to outsource infrastructure demands to subcontractors. Their optimisation problem considers the costs, profitability and SLA failure risks associated with outsourcing. While we consider similar metrics for optimisation, our automation objective is not concerned with planning and outsourcing, but with initial deployment and ongoing adaptation of how infrastructure resources are used. III. E NABLING T OPOLOGY O RCHESTRATION The core concepts of our solution for application topology specification and orchestration of SLA management, provisioning, monitoring and response are presented in this section. A. Application Topology and Infrastructure Requirements An application topology AT is a structural specification of how distributed services S are to be deployed and interconnected on any selected execution environment. We define the application topology as a tuple AT = (S, SS, Z, ZZ, P ) where: •
•
•
•
S is the set of distributed services that compose the application. Each Si ∈ S has a unique name Si .uname and is associated with a set of assets Si .assets = (a1 , ..., an ). An asset ai refers to software, images, scripts or data necessary for the service to be executable. Each asset ai declares a set of metrics ai .metrics = (m1 , .., mn ) with which its state can be observed. Each metric mi has a unique name and 1 probe mi .probe that conforms to a standard protocol defined by the target infrastructure or platform. SS is a set of service relationships (Si , Sj , l) where i 6= j, l is a label from a predefined enumeration of relationship types, and (Si , Sj ) ⊆ S. Relationships are used to inform the orchestration of deployment and service maintenance actions. Z is the set of logical regions for containment of collocated services S. At deployment time each Zi ∈ Z is mapped to an actual, physical region, which are compute and storage resource pools at different datacenters or cloud providers. Each Zi is a data-structure with a unique name Zi .uname, internally required network Zi .net, storage Zi .str, memory Zi .mem and processor Zi .cpu capacities and capabilities. At topology specification time a mapping Zi ← S i ⊆ S is defined to assign a subset of services to each zone. ZZ is the set of inter-region relationships zz ∈ ZZ = (Zi , Zj , neti,j ), i 6= j and neti,j defines the initial band-
the format IF NOT vf(gs, gt, (m1 , ..., mn )) THEN ga, where: •
•
•
•
Fig. 1.
Extended USDL-SLA Ontology
width requirement for the connectivity between zones Zi and Zj . • P defines the set of rules or policies used to manipulate the state of services in the application topology and behavior of the infrastructure towards the services. More on the specification of these rules is given in section III-B. When the application topology is specified, its infrastructure requirements are specified per zone, without a priori selection or assignment of physical regions and resource pools. In this way a separation of application topology specification and infrastructure configuration are maintained. B. Service Level Agreements and Management Rules A Service Level Agreement (SLA) [13] is a contract between a consumer and a provider of a service regarding its usage and quality [14]. It defines guarantees or Quality of Service (QoS) terms under which the services are provided and the ways for checking those guarantees. The SLAs might also contain guaranteed actions, which might be used for enforcing the validity of the guaranteed states. The content of an SLA is inevitably used for concrete instantiation and configuration directives, which parameterize the provisioning of resources, deployment of software and tuning of settings to enable effective operation of the service. We use SLAs as the basis for specifying dynamic behavior of application and infrastructure services, by using an extension of the USDL-SLA [9] vocabulary for describing the guaranteed states and actions (management rules), as well as the conditions required for automatic execution of the actions. The SLAs also contain enough information for determining the context in which the conditions are evaluated. Rules for managing the dynamic application topology are specified by the owner/ architect of the topology. All rules have
•
vf ∈ VF is a boolean validation function from the set of known functions VF, which causes the rule to fire when false. Standard binary and arithmetic operators are used. gs ∈ GS is one guaranteed state from the set of states GS defined in the SLA, which the infrastructure is responsible for maintaining. It is the first input to the validation function vf. Some examples of guaranteed states include availability, capability, efficiency, stability and security. The vf uses this as a reference. gt ≺ ¬ gs is the guaranteed trigger for the rule and represents a state that precedes invalidation of the guaranteed state gs, such that gs should ideally never be invalid. m1 , ..., mn ⊆ M is an array and subset of metrics M registered with the infrastructure. That is, the infrastructure knows how to obtain and evaluate these metrics. The array is the second input to the validation function vf. There are three domains within which metrics are defined: 1) Application.statistic classifies metrics defined by the application owner to measure statistics for number of users, response times and request queue lengths. 2) Application.service classifies metrics defined by the application owner to asses the availability, location and number of application services and instances. 3) Infrastructure.resources classifies metrics defined by the infrastructure administrator to assess the consumption and availability of memory, storage, CPU and networking. ga ∈ GA is a guaranteed action from the set of known actions GA. A ga is executed by the infrastructure management whenever a vf in the associated rule fails. The following action templates are used for defining guaranteed actions: – start with : used to initiate a specific service in the application topology. – stop with-error-level : used to terminate a service with an indicator of why the termination should occur. – update . with : used to configure a service’s state by assigning a value to a defined metric. – increase by : used for scaling up to increase performance and reduce response times. – decrease by : used for scaling down in order to save energy and costs. – redirect from to : used for high-availability scenarios with redundancy, where a service in region-x is mirrored or can be substituted by one in
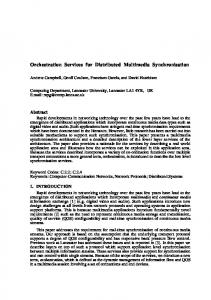
region-y. Note that the term service is used to describe components of the application or capabilities of the infrastructure. For example, the Computation and Network available to the application topology are referred to as the ”Computation service” and ”Network service” respectively. Figure 1 depicts the model used for defining the SLAs. The SLA model described here is used during the actual service deployment phase, following the selection of actual regions used for hosting the services. The SLA model contains Service Type entities that are used for representing the linked descriptions [8] of the services. Each Service Type specifies one or more Monitoring Metrics that are used during runtime for gathering state information about the actual service instances. The Service Type also specifies a Service Level Profile that contains one or more Service Levels. A Service Level can be either a Guaranteed State or Guaranteed Action, which are used during runtime for checking the state of the services and for performing actions on them, such as scale-up and scale-down. Each Service Level has a Service Level Expression that is used as described below. The Guaranteed State service level specifies a single Service Level Expression, which is used for checking a service state-invariant. During runtime, the expression is periodically evaluated for each service instance of the specified Service Type and if the guaranteed state is violated, then a log entry will be created, which can then be used for audit purposes. The Guaranteed Action also has a Service Level Expression, which contains the actual code representation of the guaranteed action, as well as another expression, which is the condition describing the state in which the application must be in order to trigger the specified action. The Service Level Expression has a Representation that uses one or more Variables. Each variable contains the value of a specified Monitoring Metric. The Monitoring Metric has a type, which can be application statistic, service, or infrastructure, as previously defined. As multiple Service Types might refer to the same monitoring metric, the variable must also specify which Service Type is used for setting its value. Likewise, as the specified service might have instances running in different regions, the variable must specify to which service it refers. This is of particular importance for the service levels that have expressions evaluated in the context of one or more regions, such as requesting network bandwidth for a connection between two remote data-centers. C. Dynamic Topology Orchestration Process Dynamic topology orchestration is a 5-staged process, following the specification of a valid application topology. The orchestration process is a continuous process driven by the monitored metrics, guaranteed triggers and guaranteed actions in the topology specification. The process is terminated when the agreed lifetime of the application is expired or other guaranteed triggers are observed that lead to termination, as specified in the SLA.
1. Request Handling and Scheduling. This stage involves transformation of the application topology into multiple, service deployment requests and their service request dependencies. There is a 1-to-n mapping between services and requests. Each request states the relevant service, request type, explicit target, where it should be executed, operation to be performed, set of parameters, schedule for the request to be executed and set of post-deployment information that should be provided for subsequent requests, according to the dependencies. 2. Infrastructure Preparation. This second stage determines what infrastructure resources are required, where they are located and how they should be configured, given a set of scheduled requests. The first activity of preparation focuses on the compute and storage end-points, as these need to be activated before the properties for network paths can be configured - consider the case where IP addresses are assigned dynamically. Subsequently reservation of inter-region network capacity is done, completing the configuration of paths between relevant - the GEYSERS project[10] can be referenced for more details on path-computation. The final activity in this stage is the activation of infrastructure probes according to the infrastructure metrics specified in the topology. 3. Service Deployment. This stage is the installation of application-level assets including images, binaries, scripts and application data on infrastructure resources in regions where their associated services are mapped. Application-level probes are then activated according to the application metrics defined in the topology. 4. Service Monitoring. This stage is a continuous collection of metrics from the different infrastructure and application monitoring probes. Each probe is associated with a service metric. The metric’s value is sent together with the metric identifier and the unique service identifier to the monitoring handler, where the value is recorded and a window of v values stored in memory for noise rejection. For the specified window, the minimum, maximum and average are calculated and made available for the use in the evaluation of guaranteed triggers in SLA expressions. 5. Response. This stage occurs when a guaranteed trigger is raised and a rule exists to resolve the difference between the guaranteed trigger and the guaranteed state. The resolution in the rule is an action that either returns to stage 1, creating a new request, or the invocation of a specific operation on a target infrastructure resource or service element. The range of operations have been classified in Section III-B. IV. A RCHITECTURE AND SLA-D RIVEN DYNAMIC H ANDLING This section describes a system architecture for enabling the 5-stage process described in Section III-C. The architecture is designed as a tool for application topology architects and administrators. It is a loosely-coupled, message-based architecture, such that most components are defined as types of Handlers, as shown in in Figure 2. Once the application topology specification is completed, it is submitted to the Request Handler (RH) via the Request
to Monitoring Handler
Request Interface
Query Interface R
R
R
R
Scheduler Handler
Application Handler
Asset Handler
Request and Query Handler
R
R
Service Handler
R
App. Templates
R
Srv. Instances R
Srv. Templates
R
Monitoring Handler Monitoring Data
R
Network Links
R
R R
R R
SLA Rule Enactor SLA Rules
Resource Pools
R
Orchestration Handler SLA Rules
SLA Handler SLA Profiles
Infrastructure Resource Handler IT/Net Resources
R
Rule Outcome Handler
R
Archived Monitoring
Infrastructure Virtualization Manager Clients
SLA Logs R
Fig. 2.
System Architecture
Interface, triggering stage 1 of the orchestration process. The states of requests, services and SLA of active topologies are continuously monitored via a corresponding Query Interface. The RH queries the Asset Handler (AsH) for a list of available, infrastructure resource pools of computing, storage and memory resources according to the requirements of the topology specification. The application architect or administrator is responsible for initial selection of mappings between application regions in the topology specification and suggested resource pools. Once this initialization mapping is completed, the RH parses the topology specification into a set of deployment requests and passes these to the Scheduler Handler (SH). The SH builds a schedule for requests and associated handler operations, allowing subsequent or batches of application topologies to be submitted. When a topology is scheduled for deployment, the Application Handler(AH) is invoked to register the service templates and dependency mappings in the topology, indicating that it is being activated. Initially selected infrastructure resource pools are marked as ’reserved’ for the specific application topology in the AsH, moving to stage 2 in Section III-C. This then signals the Infrastructure Resource Handler (IRH) to establish and set up network links between the resources pools, which could be at different, physical locations. We extend concepts and use mechanisms for co-provisioning of IT (compute, storage, memory) and network resources from the GEYSERS project[10] for this purpose. The IRH has a signaling connection to Infrastructure Virtualization Manager Clients (IVCs) at each site offering resource pools and connectivity. IVCs currently developed are clients for GEYSERS[10] Logical Infrastructure Composition Layer, OpenNebula[15] and the GEYSERS Network Control Plane. It is via these IVCs that the IRH is able to request isolated portions of infrastructure, per application topology to be served. The network links are also registered with the AsH once provisioned. Once this underlying virtual infrastructure of distributed resource pools and network links is established for the application topology, the service templates and SLA profiles from the
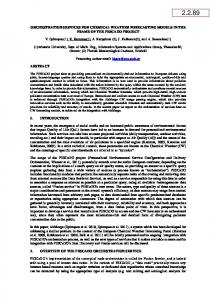
topology specification are passed to the Service Handler (SH), where the actual topology orchestration process is enacted, corresponding to stage 3 of Section III-C. The AH processes the application instantiation request by first identifying the application topology and software templates referred in the request, as well as the resource pools indicated for hosting the services. For each service template, the AH requests the Service Handler (SH) the instantiation of the minimum number of instances in the mapped resource pools. The SH assigns a unique identifier to the service instance and then passes the request to the Orchestration Handler, which resolves the service dependencies and populates the service context, waiting if necessary for the services to be instantiated. As the services begin operating, the individual instances begin sending monitoring information, which is received and processed at the Monitoring Handler. After the successful notifications of the services’ instantiations have been received, the AH retrieves the SLA profile for each service and then registers it at the SLA Handler(SLAH). The SLAH stores the SLA profile and then passes it to the Rule Enactor(RE) for processing. The RE extracts the Service Levels from the SLA profile and for each level determines its Expression. For the SLA service levels of type Guaranteed Action, the expression is wrapped by an IF condition containing the action’s precondition expression. For the Guaranteed State SLA service level, the extracted expression is wrapped in a IF triggering the creation of a Rule Outcome of type SLAlog when the expression evaluates to false. The generated code sequences are then compiled into an MVEL expression [16]. For each expression, its variables are identified, their values are populated with data from the Monitoring Handler and then they added to a Context map object that will be passed to the MVEL framework for evaluation, together with the compiled sequence. The expression context population and MVEL evaluation are wrapped in a Runnable and periodically executed. At each SLA monitoring cycle, the RE produces Rule Outcome objects, which are passed to the corresponding Rule Outcome Handler for processing, based on the outcome’s type (e.g. scale-up, network-bandwidth-increase). Each rule outcome has a set of properties that are used for performing the corresponding action. In case of outcomes generated from Guaranteed Actions SLA levels, the handler actually triggers the execution of the desired action by building a request for one of the Infrastructure Virtualization Clients. In case of outcomes generated from a Guaranteed State SLA level, the handler logs the SLA violation by archiving it in the AH. V. E VALUATION To evaluate this approach to SLA-driven orchestration for dynamic application topologies, we use a distributed Enterprise Information System (EIS) with variable user numbers, payload sizes and classes of workloads, shown in Figure 3. The distributed services are interconnected by a Registry and Messaging architecture. The evaluation is a mixture of
Region 1
Region 3
Region 2 Storage
num-instances
num-instances
1
n
n
num-users
response-time
Instance n
Consumer queue-length
1
n 1
1 1
1
1
Registry/ Messaging
Host-1 Load Generator
Consumer
LoadBalancer
1
Registry/ Messaging
1
1
n
Host-2 vm/cpu/net Probes
Registry/ Messaging
1
vm/cpu/net Controls
Host-3 Load Generator
SLA Orchestration
Fig. 3.
Application topology for the case study
qualitative architectural analysis and quantitative simulation and experimentation. The EIS, developed within our research group for integrating benchmarks for processor and networking infrastructures, is a distributed OSGi application with a distributed service registry for 4 service classes, where each service class has its own set of relevant, monitored metrics and control operations: (1) Consumer is instantiated per client of the EIS. It represents a remote, virtual-desktop infrastructure deployed with proxiimity to the EIS core, such that large pauloads or transactions do not originate beyond the controlled network. The monitored metrics are the number of users and the response-time for requests. The number of Consumer instances is gradually increased and decreased using a Load Generator. (2) EIS Instance (or just Instance) is the acutal worker that handles requests from Consumers. It returns results of different analytics workload-generating queries using SQL SELECT statements associated with request classes. (3) Storage is the provider of the database queried by the worker Instance to handle the Consumer requests. (4) Load-Balancer is in place to determine which Instances should handle incoming Consumer requests. Only one LoadBalancer is instantiated and it provides access to a queuelength metric. In Figure 3 we also depict how the application topology model defined in Section III-A is applied. The EIS’ application topology consists of 3 Regions, where Regions 1 and 3 are replicas of Consumer locations each separately interconnected with Region 2, which contains the server-side of the EIS. The number of Consumers in Regions 1 and 3 can be varied independently. Rules with SLA triggers and guaranteed actions are specified for increasing or decreasing the number of Instance and Storage services running in Region 2 according to the number of concurrent Consumers, the sizes of workloads they require and the consequent queuelengths handled by the Load-Balancer. A compensation for service provisioning delay is introduced by adding one extra
instance. Simultaneously, the number of Consumers and their variable payloads also changes the bandwidth requirements for interconnections between Regions 1 to 2 and 3 to 2. It is assumed that initial application infrastructure sizing has been done for creating a mapping between the utilization metrics (number of concurrent consumers, average workload sizes and average payload sizes) to compute and networking capacity requirements. The SLAs associated with the application topology do not only specify guaranteed triggers and actions, they specify foremost constraints on response time for Consumers. This hence provides the challenge to the providers of minimising their costs while satisfying the response time constraints, as breaching constraints results in penalties. A. Value Model and Alternatives The value model of the scenario is defined against two objectives: (1) maximise the assurance that the response time guarantees for all Consumers will be met and, (2) minimise wastage of resources to spawn and maintain multiple worker Instances. To remain competitive, infrastructure providers need to maintain their reputation for satisfying SLAs, while minimising their operational costs and maximising their operational efficiencies. They will want to accommodate existing customers, fluctuations in demand and new customers. Given that cooling of data center equipment and connectivity costs are the highest contributors to service operation cost, an increase in efficiency has significant impact on both objectives. From these 2 objectives we derive 3 evaluation parameters discussed in the following paragraphs. Firstly, the reaction time rt for a service, such as creating a new EIS Instance, is the sum of detection time dt, planning time pt and action time at required by an administrator or management system to respond to a potential incident, an undesirable state or an opportunity to enhance operations. The ¯ (equation 1) is the sum of dt’s, pt’s average reaction time rt and at’s for a series of adaptation triggering events e1 , ..., en , divided by the number of events n. n
X ¯ = 1 dte + pte + ate rt n e=1
(1)
Secondly, the average number of SLA violations sv ¯ across a list of observed service states (s1 , ..., sn ) ⊆ S, with cardinality |S|, where S is the set of observable states and each s ∈ S is a collection of metrics Ms ⊂ M . The set S is extracted from logs and from live monitoring probes. sv ¯ =
|S − GS| |S|
(2)
Finally, the provisioning efficiency P E of the infrastruct ture considers the ratios of consumed resources Rcons and t provisioned resources Rprov for the EIS application topology over a time series t ∈ (t1 , ..., tn ). The P E is a measure of the resource provider’s ability to satisfy demands, while minimising resource costs and waste. The statistical trends (P Emean , P Emax , P Emin and P Emode ) in P E over the time series (P E 1 , ..., P E n ) are of interest in assessing the
dynamic
120 100
● ● ●
Users
B. Comparison of Alternatives
total users dynamic provisioned max provisioned mean provisioned mode provisioned
●
● ●
● ●
40
dynamic
●
mean
mean
●
●
●
20
●
mode
●
mode
● ●
● ● ● ● ● ● ●
● ● ●
0
¯ defined in To compare the average reaction time rt Equation 1, we use a qualitative architecture analysis approach to classify all possible adaptation triggers and estimate the relative reaction time per alternative, in comparison to an unmanaged system’s response to these triggers. An unmanged system is considered as one where there is no active system in place to avoid, monitor or respond to the classes of adaptation triggers identified. In the scenario there are 7 classes of event sources, services or resources, from which metrics can be obtained (1:EIS.Consumers, 2:EIS.Registry, 3:EIs.Load-Balancer, 4:EIS.Instances, 5:Infrastructure.Compute, 6:Infrastructure.Storage and 7:Infrastructure.Network). Secondly, there are 4 types of observations that can be made as an analysis of these metrics that will lead to some adaptation action (add/remove Instance or increase/decrease capacity) being triggered, given the guarantees in the SLA and operational constraints of the provider: (1:unavailable/failed, 2:under-performing, 3:overperforming and 4:expired). This gives 7 × 4 = 28 adaptation triggers. We then use a comparative scale for the detection time dt, planning time pt and action time at with values: 0 := no time, 1 := shorter than unmanaged, 2 := same as unmanaged, 3 := longer than unmanaged. For each of the 28 adaptation triggers, we rationally assign a value from the comparative scale to dt, pt and at, per alternative in comparison to an unmanged ¯ as defined in Equation 1. The results system, then calculate rt for the over-provisioned, under-provisioned and dynamic approaches were 0.5, 1.25 and 0.833 respectively, where the dynamic approach refers to our system. These results indicate that the over-provisioned alternative has the best potential for performing better than an unmanaged system with regards to the set of adaptation triggers, and the under-provisioned approach performing the worse. Our dynamic approach sits in the middle. The reason that the over-provisioned approach performs best is the provision of redundancy and assumption that resource costs are irrelevant. With massive redundancy in place peaks and in some cases failures are masked by readily available resources. However, this assumption about resource
SLA violation start SLA violation stop
80
There are three fundamental alternatives that can be derived, considering independent optimisation strategies for the three objectives stated in the value model. (1) Minimise reaction time rt: over provision to avoid need to monitor and adapt the initial deployment; (2) Minimise SLA violations sv: over provision to avoid violations; (3) Maximise provisioning efficiency P E: provision for mean or modal workload. Different configurations of these can lead to other alternatives but these 3 make for a comprehensive evaluation against the SLA-driven orchestration approach.
costs is not scalable or applicable to all circumstances, such that our dynamic approach has a better potential to satisfy multiple operational constraints. In an analysis of SLA violations, using equation 2 and presented in Figure 4, the over-provisioning alternative will inevitably yield fewer violations (tending to 0), as its contingency is to over-compensate with redundancy.
60
performance of alternatives to service management, as shown in Equation 3. Rt (3) P E t = cons t Rprov
0
● ● ● ● ●
5
●
●
● ● ●
10
15
20
25
30
35
time
Fig. 4.
SLA Violations
The duration of SLA-violation in this case was the ModeProvisioned strategy, as the mode tended to be low for this particular distribution of users. The duration of SLA-violation state for our dynamic approach is temporally similar to the Mean-Provisioned strategy but the difference in user demand and service capability is significantly smaller throughout the duration, making the SLA violation impact less significant. Although the Over-provisioned (or Max-Provisioned) strategy appears to make sense from the perspective of minimising (zero-setting) reaction time and SLA violations, there is a penalty to pay for efficiency, as shown in Figure 5. The dynamic approach enables almost 20% of the operation time to be at near maximum efficiency, while the OverProvisioned approach incurs above 20% at minimum efficiency for a fluctuating workload. The Over-Provisioned case can only be efficient if there is a constant burst of maximum anticipated users. Losses in efficiency with the dynamic approach are again transient, and can be addressed by optimising the reaction time to adaptation triggers. VI. C ONCLUSIONS We have presented an SLA-centric specification model, architecture and value model for dynamic application topology specification and orchestration. Our specification model is
Over−provisioning
25
25
Dynamic provisioning
5
10
15
20
SLA violations: 0 / 35
0
0
5
10
15
20
SLA violations: 5 / 35
0.0
0.2
0.4
0.6
0.8
1.0
0.4
0.6
0.8
1.0
Acknowledgments
SLA violations: 15 / 35
The work in this paper has been (partly) funded by the European Union through project GEYSERS (contract no. FP7ICT-248657).
15 10
20
15 10
20
SLA violations: 11 / 35
0.2
Mode provisioning
25
25
Mean−provisioning
0.0
of infrastructure adaptation, towards minimising the reaction time, as well as assessing the impact on management effort. Some data is being collected from our work in the GEYSERS project, where a converged model of compute, storage and network virtual resources is developed. Secondly, we believe that the main way of minimising reaction time is through more accurate prediction of when, what and why adaptation triggers occur during runtime. Further studies are hence towards incorporating and assessing the value of predictive algorithms and methods in our architecture.
5 0
0
5
R EFERENCES
0.0
0.2
0.4
0.6
Fig. 5.
0.8
1.0
0.0
0.2
0.4
0.6
0.8
1.0
Provisioning Efficiency
designed to simplify validation of selection, deployment and adaptation rules for application to infrastructure mapping. Secondly, the specification provides application architects with an application management model that is applicable at specification and operation time, separating the concerns of specification from configuration. Subsequently, given an architecture like we proposed, such a specification increases the level of infrastructure management automation, including provisioning, deployment, monitoring, problem specification and resolution, as an explicit expression of locality, scaling and adaptation constraints are included for each class of infrastructure resource: storage, computation and networking. Finally, the set of four value measures in the value model we presented have been derived from a first-principle analysis of application topology management. This provides a set of measurements that can be used to assess, compare and strategically enhance different approaches to application topology management. We applied three of these measures in a comparison of our dynamic approach with over and underprovisioned strategies for application topology management. Our results show that the dynamic approach is a better choice considering the objectives of minimising SLA violations and maximising efficiency. A qualitative estimation of the ¯ showed advantages for the dynamic average reaction time rt approach under basic assumptions about the preparedness of over and under-provisioned strategies for response to adaptation triggers. However, there is some overhead introduced by the need to monitor more metrics with a greater frequency, and the incurrence of transient unavailabilities during adaptation of the infrastructure. Future work is hence towards a more empirical analysis
[1] M. Buco, R. Chang, L. Luan, and C. Ward, “Utility computing sla management based upon business objectives,” IBM Systems J., 2004. [2] I. Foster and C. Kesselman, “The anatomy of the grid: Enabling scalable virtual organizations,” Int. J. High Perform. Comput. Appl., 2001. [3] T. Ellahi, B. Hudzia, H. Li, and P. Robinson, The Enterprise Cloud Computing Paradigm. John Wiley and Sons, Inc., 2011. [4] G. Juve and E. Deelman, “Automating application deployment in infrastructure clouds,” in Cloud Computing Technology and Science (CloudCom), IEEE Third International Conference on. IEEE, 2011. [5] C. Liu, Y. Mao, J. Van der Merwe, and M. Fern´andez, “Cloud resource orchestration: A data-centric approach,” in Proceedings of the biennial Conference on Innovative Data Systems Research (CIDR), 2011. [6] K. Lu, T. R¨oblitz, and P. Chronz, “Sla-based planning for multi-domain infrastructure as a service,” Cloud Comp. and Services Science, 2012. [7] OASIS Committee Specification, “TOSCA version 1.0 2012,” http: //docs.oasis-open.org/tosca/tosca/v1.0/csd03/tosca-v1.0-csd03.html. [8] C. Pedrinaci and T. Leidig, “Linked-usdl core,” http://www.linked-usdl. org/ns/usdl-core, November 2011. [9] Leidig, T. and C. Momm, “Usdl service level agreement,” http://www. linked-usdl.org/ns/usdl-sla, April 2012. [10] E. Escalona, S. Peng, R. Nejabati, D. Simeonidou, J. A. Garcia-Espin, J. Ferrer, S. Figuerola, G. Landi, N. Ciulli, J. Jimenez, B. Belter, Y. Demchenko, C. de Laat, X. Chen, A. Yukan, S. Soudan, P. Vicat-Blanc, J. Buysse, M. D. Leenheer, C. Develder, A. Tzanakaki, P. Robinson, M. Brogle, and T. M. Bohnert, “Geysers: A novel architecture for virtualization and co-provisioning of dynamic optical networks and it services,” in Future Network and Mobile Summit 2011, 2010. [11] M. Malawski, G. Juve, and E. Deelman, “Cost-and deadline-constrained provisioning for scientific workflow ensembles in iaas clouds,” 24th IEEE/ACM International Conference on Supercomputing, 2012. [12] H. Kim, Y. el Khamra, I. Rodero, S. Jha, and M. Parashar, “Autonomic management of application workflows on hybrid computing infrastructure,” Scientific Programming, vol. 19, no. 2, 2011. [13] W. Theilmann, J. Happe, C. Kotsokalis, A. Edmonds, K. Kearney, and J. Lambea, “A reference architecture for multi-level sla management,” Journal of Internet Engineering, vol. 4, no. 1, 2010. [14] A.-F. Antonescu and P. Robinson, “Towards cross stratum sla management with the geysers architecture,” in Parallel and Distributed Processing with Applications, IEEE 10th Int. Symposium on, 2012. [15] D. Milojiˇci´c, I. Llorente, and R. Montero, “Opennebula: A cloud management tool,” Internet Computing, IEEE, 2011. [16] “Mvel expression language,” http://mvel.codehaus.org, 2012.