Dyno Test – PW Controlled Sequential Water Injection. INTRODUCTION ....
against the same spark tune using 14.7:1 AFR and water injection. All testing
used ...
Dyno Test – PW Controlled Sequential Water Injection INTRODUCTION This project was inspired by discussion on several internet discussion groups. The usual question was how and when to trigger a conventional spray type water injection system with one or two spray nozzles. The JYTURBO list had several members that were using one or more fuel injectors to spray water and driving them in various ways. A discussion of the combustion chemistry of water injection caught my attention as well as three NACA research papers from WWII era research. (NACA Report 756, NACA Report 812 & NACA War Report –E- 264) My thought was, why not trigger the injector system when the fuel injection pulse width exceeded a certain value? This would allow the water to come on only when the engine reached a certain LOAD. The test data and discussion is the culmination of 1.5 years of work learning about electrical circuits, searching the internet for answers and a lot of fabrication time. Very little in this project is completely original, mostly a collection of ideas and information I could get my hands to make the project work. GOALS of WATER INJECTION 1) Determine if significant WOT knock suppression can be achieved with water injection. This would allow more power on a boosted engine. 2) Test for better efficiency at WOT 3) Test for better efficiency at light LOAD – highway cruise conditions THEORY OF WATER INJECTION The basic concept of the water injection being used for internal coolant is that any fuel used below stoichiometric AFR is used to cool the combustion process. The references suggest that water injection can be used to replace this extra fuel and produce the same or more power. This process will cause the combustion process to be somewhat slower than normal often necessitating greater spark advance. The references use as much as 60% water/fuel in some tests. The second and more traditional use for water injection is to cool the intake air, creating a more dense air charge, resulting in more power. This method has to be used carefully, if the water turns into steam, displacing large amounts of air, the net result could be lower power since not as much oxygen gets into the combustion chamber. TEST ENGINE DESCRIPTION The engine used is a Ford 5.0 V-8 in a 1994 Mustang GT. Stock bottom end, AFR-165 heads, “Baby” Crower cam, Trick Flow Street manifold, 30# FMS injectors, Pro-M MAF calibrated for 30# injectors, stock headers, 2.5” exhaust with Hooker Aero Chamber mufflers. Engine control is through Ford EEC-IV T4M0 computer and TwEECer RT. The TwEECer allows full control of fuel and spark tables. A DIY-Wide Band O2 sensor is permanently installed in car and is data logged by the TwEECer. Significant
1
information is data logged during the dyno runs by the TwEECer. Compression ratio is approximately 9.2 and distributor is set to 10 deg BTDC. All spark advance values discussed are the total spark advance. DYNAMOMETER DESCRIPTION The chassis dynamometer used is a 1- year old, Mustang Dyno, model Importdyne. It has an eddy current brake to control each run ensuring the engine is only allowed to accelerate at a programmed rate allowing for accurate data collection. WATER INJECTION SYSTEM DESCRIPTION The water injection system is essentially a second complete fuel injection system. It has a 6-gallon plastic tank normally used for an outboard boat motor, a SHURflo on-demand diaphragm pump, model #8009-541-236 and a 90 micron brass inline filter. Pressure and return lines from trunk to engine compartment are 300 psi air compressor hoses. The water supply rail is stainless steel tubing welded to stainless steel bungs that fit the feed side of the water injectors. The supply rail pressure is controlled by the stock 1994 Mustang fuel pressure regulator (an aftermarket regulator is used on the fuel system). The 8-water injectors are 14# per hour fuel injectors out of a Ford Crown Victoria. The injectors are mounted on the underside of the top half of the Trick Flow intake manifold. The injectors spray a fairly solid stream directly across each respective intake runner. The impingement of the water stream is all that mixes the water with the intake air before it goes into the combustion chamber. The electronic controller is custom built using a separate transistor for each injector to allow sequential operation. The controller triggers the respective injector when it senses the fuel injector opening. A delay function is incorporated which delays the opening of the water injector for a given number of microseconds. This allows the amount of water versus fuel to be changed from very little to as much as 46.7% water/fuel (14#/30#). There are three feedback circuits to allow 0-5 volt data log of fuel PW, delay PW and water PW. Water mixture used was 80% water and 20% methanol alcohol. The methanol had 1 oz of Klotz UpLon Fuel Lube mixed in with each gallon of methanol. The Klotz is supposed to provide some measure of corrosion resistance for the fuel system components (big concern is injectors). TEST PLAN AND PROCEEDURES The test equipment and procedures below really are only able to directly test for WOT knock suppression and indirectly test for WOT efficiency. The low LOAD – highway cruise efficiency improvements were not tested. The basic plan was to test a conventional tune with normal high load AFR’s (12.7:1) against the same spark tune using 14.7:1 AFR and water injection. All testing used only 89 octane fuel. The basic tune was the 1994 Mustang Cobra tune J4J1, the only real change was to increase the last row of the spark tables to use 28 degrees total advance, and to change the fuel tables to command AFR’s as described above. Each additional run
2
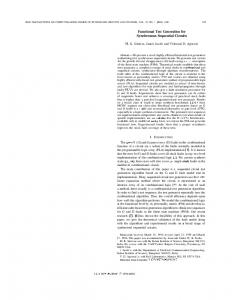
would use the Global Spark adder to increase total spark advance by 2 degrees. Once the dyno showed a drop in power that series would be stopped since the peak power spark advance had been achieved. The TwEECer has real-time data display of many engine parameters. It also allows four tunes to be stored and can be switched from one tune to the next in just one second. So time on the dyno between runs was controlled by engine cool down. We used the ECT readout on the TwEECer to decide when to start the next run. Although the engine had a 180 degree thermostat we started the next run as soon as the ECT came down to the mid 190’s. Data was collected by the TwEECer and the dynamometer computer. A clipboard sheet was used to record computer time as each data log was commenced (data file names are date-time stamps). ECT temp was recorded at beginning of pull, total spark advanced viewed was also recorded (not statistically accurate but gave us a feel for how hard we were pushing with the spark advance). Peak Hp and Tq were recorded on this sheet at the end of each run. All this data is complied in spreadsheet “Dyno Sheet 11-24-04.pdf”. RESULTS – DATA FILES The center of the test results is the spreadsheet file “Dyno Sheet 11-24-04.pdf”. This file shows the plan of attack and has all the notes taken during the pulls. It refers to other files based on each pull, Dyno files and TwEECer data files. Dyno files are jpg files scanned in from the original printouts. They basically gave Peak HP & Torque and Average Hp and Torque, and graphically give the HP, Tq, AFR versus RPM. TwEECer data files are .csv files, comma delimited and can be read by any spreadsheet program. The headers are mostly self explanatory. The AFR recorded in these files is generated by the DIY-Wide Band O2 sensor permanently installed in the car. All spark advance numbers are the total commanded by the EEC-IV. DISCUSSION OF RESULTS A review of “Dyno Sheet 11-24-04.pdf” shows that run #6 and #16 produced very close Peak Hp and Tq values, Average values were also very close. Graphs of Spark advance vs RPM, PW vs RPM and AFR vs RPM are supplied in the files section (example #662249 PW vs RPM.pdf). Run #6 was achieved with 12.7:1 AFR commanded, resulting AFR was between 13.0 and 13.3:1. Maximum Spark advance was about 36 degrees BTDC.
3
40.00 35.00 30.00 25.00 20.00 15.00 10.00 5.00 0.00
Series7 Poly. (Series7)
17 23 20 66 24 68 28 54 32 23 35 96 39 66 43 31 46 13 50 53 52 26 54 73
Deg Advance
Spark Advance vs RPM_ Run #6
RPM
WB-AFR vs RPM_ Run #6 14.00 WB-AFR
13.50 13.00 12.50
Series4 Poly. (Series4)
12.00 11.50 5511
5226
5094
4764
4575
4249
3966
3653
3314
2982
2658
2345
2055
1723
11.00
RPM
Run #16 was achieved with 14.7 AFR commanded, resulting in about 14.5 AFR on the DIY-WB. Maximum spark advance was 40 degrees BTDC. I wasn’t sure of the effect of water so a baseline run was made with this tune to see what AFR actually is achieved without water injection. The baseline AFR data for 14.7 series was between 14.0 & 14.5:1 AFR (0-2928 Baseline 14.7 AFR.pdf; data is in 0-02928.csv).
4
45 40 35 30 25 20 15 10 5 0 5337
5153
5016
4661
4371
4048
3740
3353
3070
2735
2408
2072
Series7 Poly. (Series7)
1752
Deg Advance
Spark Advance vs RPM_ Run #16
RPM
15.5 15.0 14.5 14.0 13.5 13.0 12.5 12.0 11.5 11.0 5337
5153
5016
4661
4371
4048
3740
3353
3070
2735
2408
2072
Series4 Poly. (Series4)
1752
WB-AFR
WB-AFR vs RPM_ Run #16
RPM
Equal power was achieved with a much leaner mixture and about 4 more degrees of spark advance. An increase in WOT fuel efficiency is demonstrated in this test by the use of a leaner mixture 14.5:1 (run #16) to achieve the same power as the baseline with 13.3 AFR (run #6). That calculates to about a 9% savings at WOT. This would be significant for an application that operates at a significant % of full load, tow vehicle etc.
5
Another concern was whether the water was turning to steam before entering the combustion chamber thus displacing oxygen and lowering potential power. The MAF values were compared between run #6 and run #16. “MAF Flow.xls combines this data and calculated the percentage difference in MAF air flow between the two runs; Dry/WI or run #6/#16. It appears that the WI run (#16) may actually use a little more air at top RPM suggesting that the water is not turning to steam and may be cooling the intake air a small amount, see “MAF Flow Dry vs WI.pdf”. The difference is on the order of 2-3% in favor of the WI run and negative 2-3% at the lower RPMs.
MAF Flow Dry/WI 1.15 Dry/WI
1.1 1.05
Dry/WI Poly. (Dry/WI)
1 0.95 0.9 5459
5279
5061
4819
4562
4237
3941
3636
3319
3005
2680
2357
2038
1764
0.85
RPM
Spreadsheet “Dyno Sheet 11-24-04 has the right most three columns dedicated to recording the heat rise on each run. This was to see if there was a trend of the water injected operation showing lower heat rise, suggesting less heat loss to the cooling jacket. Although 3 of the 8 runs on the 14.7 water injected series suggest that WI operatio n might transfer less heat to the water jacket, other runs in the series counter the trend. The ability to measure this parameter is pretty crude, better methodology and instrumentation would be needed to verify this trend accurately. CONCLUSIONS The theory suggested that equal or better power could be produced with a lean mixture and slightly more spark advance. The comparison of run #6 and #16 shows that equal power was achieved but not improved. It appears that significant knock tolerance is achieved with the water injection as more spark advance proved to work with a leaner mixture without signs of detonation while generating equal power. The airflow entering the engine as measured by the MAF was basically equal on runs #6 & #16. A slight difference could be argued but again the accuracy of data collection might bring such a conclusion into question. There doesn’t appear to be a significant difference in the airflow of the two runs. At the least this would suggest that significant
6
steam is NOT being produced in the intake runners. Most of the water appears to be making it into the combustion chamber as water not steam, the intended goal. The data collected doesn’t seem to prove that less heat goes into the cooling jacket during combustion with water injection. Better instrumentation or methodology would be needed to prove this. About a 9% improvement of fuel efficiency was shown under WOT. Translated to real world use full time WI could help a tow vehicle that operates under heavy load most of the time. The NACA references suggest that the lighter the load the less effect internal coolants will have on efficiency.
7