there are no good models for design errors, and therefore it .... al, since a given input vector produces a response in the .... a given input decomposition cube.
Functional Test Generation for Behaviorally Sequential Models F. Ferrandi G. Ferrara D. Sciuto Politecnico di Milano Dip. di Elettronica e Informazione Milano, ITALY
Abstract Functional testing of HDL specifications is one of the most promising approaches for the verification of the functionalities of a design before synthesis. The contribution of this work is the development of a test generation algorithm targeting a new coverage metric (called bit-coverage) that provides full statement coverage, branch coverage, condition coverage and partial path coverage for behaviorally sequential models. The behavioral test sequences can be also the only way to evaluate testability of VHDL model for which a gate-level representation is not available (e.g third-party cores), since the behavioral error model is characterized also by a high correlation with the RT and gate-level stuck-at fault model. Moreover, the preciseness of the proposed coverage metric makes the identified test sequences more effective in identifying design errors, than other test patterns developed by following standard coverage metrics.
1 Introduction Functional verification of VHDL specifications is increasingly the bottleneck toward the reduction of design time. The aim is to verify that a description has the intended behavior: this can be accomplished by identifying a series of meaningful simulation vectors. However, such a strategy represents the most resource-consuming part of the design process, requiring large verification teams and time. This increases both product development costs and time to market, without any guarantee of avoiding to ship products with bugs. Simulation and emulation are not keeping up with the size of the designs to be verified. In fact, the verification of all specified behaviors can only be guaranteed if an exhaustive application of all possible input values is performed: this task is infeasible for actual designs. Today, formal verification techniques are gaining a wider acceptance, however they do not represent a general solution, but can be useful for specific cases. In the case formal verification techniques cannot be used,
A. Fin F. Fummi Universit`a di Verona DST Informatica Verona, ITALY
the specification is verified by means of simulation, either at the gate or RT-level. Test cases are manually defined or randomly generated. In most cases, designers perform functional vectors generation based on their knowledge of the specification; this allows the definition of a meaningful set of vectors but without any guarantee to thoroughly exercise the specification. In that case, testbench authoring tools provide a way to ”measure” the quality of the test patterns through some coverage metrics, mostly taken from the software testing area [1]. In the literature, semi-formal techniques [2, 3, 4] have been advocated to make simulation smarter, being able to perform a comprehensive validation without redundant effort. This analysis is targeted to RTL specifications and aims at maximizing the probability of stimulating and detecting bugs at minimum cost, in terms of time and computation resources. The main effort is the definition of the most suitable coverage metrics that will be able to guide the test vectors generation and define how comprehensive has been the verification so far, thus identifying a stopping criterion. The ideal situation would be to find a metric that has a direct correspondence to the design errors. However, there are no good models for design errors, and therefore it is difficult to prove that a metric is a good approximation for design bugs. Many different coverage metrics have been proposed, serving different purposes, and working at different abstraction levels. Code-based coverage metrics, deriving from the software testing field, seem the most suitable ones to be applied on HDL-based specifications and represent a useful guide to identify the test cases to be applied. However, classical code-based coverage metrics such as line/code block coverage, branch/conditional coverage, expression coverage, path coverage and the most recent tag coverage are not sufficient to guarantee the detection of all design errors. The aim of this paper is to evaluate different coverage metrics, based on a high-level error model for VHDL behavioral (i.e., VHDL descriptions accepted by high-level synthesis tools) and functional RT-level specifications. Analyzed behavioral descriptions are subdivided into behav-
iorally combinational and behaviorally sequential descriptions as described in Section 2. The paper proposes a coverage metric based on an error model that approximates the actual design errors. An error is defined as a modification of an element of the VHDL code that may produce a different behavior. For each one of these errors we generate a test that detects it. During test, the erroneous and original designs behave differently. Coverage is defined as the fraction of faults detected by the entire test set and it is measured by simulation. To verify the effectiveness of our error model, we consider it with respect to statement coverage, adopted by many HDL coverage tools, and with respect to the code-based metric proposed in [6], which considers block coverage. To evaluate this difference in terms of design errors identification between these coverage metrics, we used the stuck-at fault coverages at the RT-level as an independent comparison method. This can be considered a method for estimating the ability of the produced functional test patterns to identify design errors. Finally, we compare the single stuck-at fault coverage provided by a commercial test generator, with the fault coverage obtained by applying the test sequence identified at the specification level, in order to verify how our coverage metric performs at gate-level. Different papers in literature have analyzed with different flavors the problem of producing test patterns to identify design errors. In [7] test patterns developed for the gatelevel implementation using the single stuck-at fault model, are used to compare the gate-level combinational implementation with the functional-level specification. The authors show that these tests allow detection of a large class of common design mistakes. However, this approach can be applied only after the implementation has been obtained, thus identifying design errors only at a very late stage of design. In [8] a coverage measure to compute the level of design validation obtained is proposed. This paper does not provide an approach to generate functional test pattern targeting the design errors modeled. Furthermore, their design error model works at the gate-level. In [9] the authors propose a tag coverage method to evaluate the quality of a set of functional vectors based on HDL coverage and observability information. This information is used to determine if the effects of errors that are activated by the test vectors are observable at the outputs. Observability information is computed by applying tags to variables during simulations, and then using a specific simulation calculus to evaluate the coverage provided by a set of functional vectors. No test generation procedure is proposed. In the next paper, the observability metric is used to search for inputs that exercise a selected number of paths of a RT-level Verilog description, by using a satisfiability checking algorithm [10, 11]. In their last work they tackle the problem of sequential circuits, by extending their technique to include time-frame anal-
ysis [5]. None of these papers consider redundancy identification as one of the goals of the coverage directed simulation performed. Observability is the main focus of [12], in which the authors analyze three different metrics for taking observability into account during RT-level test generation. The focus of this paper is on behavioral and RT-level VHDL specifications, thus analyzing a higher level of abstraction of previous approaches. The aim is to propose a new automatic generator of test vectors targeting full coverage of a behavioral error model, adopted as coverage metric. This metric, based on bit coverage instead of statement or selective path coverage [13, 5] allows a more precise verification of the specification, covering anyway all statements, branches and conditions and some significant paths of the VHDL model by incorporating both controllability and observability criteria. Full path coverage cannot be guaranteed since the number of paths in a specification can grow exponentially with the size of the description. Note that the error model based on bit errors on variables is not related to specific design errors, but it is used primarily to extend standard coverage metrics to include controllability and observability requirements that provide the possibility of detecting design errors. Main advantages of the approach proposed in this paper can be summarized as follows.
�
�
�
�
It allows functional verification of behavioral and RTlevel descriptions, described as VHDL processes, with sequential behavior, providing coverage of all statements, branch coverage, condition coverage and selective path coverage. It provides the identification of untestable or difficult to test parts of the specification, before synthesis is performed, on the VHDL source code, thus avoiding redesign time if the obtained testability is not considered sufficient. It allows accurate evaluation of different architectural alternatives also in terms of testability and not only in terms of area and performance, as provided by the high-level synthesis tools, in a fraction of the time required to generate specific test sequences for each implementation. It provides a mean to generate test patterns for those embedded cores for which a gate-level description is not available, thus allowing to evaluate their testability.
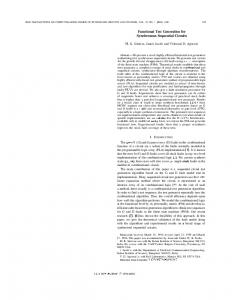
2 Behavioral Descriptions Classification The proposed testing approach analyzes single-process VHDL behavioral specifications. Operations and statements considered are those accepted also by high-level synthesis tools such as the Synopsys Behavioral Compiler.
Each VHDL process can include a single wait statement, or, in more complex and general cases, can be based on multiple wait statements. By assuming a single wait, process outputs are a mapping of input values applied in the same time frame. This kind of descriptions is classified behaviorally combinational, since a given input vector produces a response in the same time frame, thus behaving as a combinational circuit. However, gate-level circuits obtained by such behavioral descriptions, are always sequential, and the sequential behavior is introduced by the high-level synthesis tool during the scheduling phase. A functional test generator produces for such descriptions a test vector for each error. On the contrary, if the behaviorally combinational assumption is removed, a functional test generator must produce a sequence of test vectors to test a particular error. In fact, an error generally requires more than one clock cycle to be propagated to the primary outputs. We classify these types of descriptions as behaviorally sequential, and, obviously, the corresponding gate-level circuits are sequential. An example behaviorally sequential description is shown in Figure 1. It is important to nota that the class of behaviorally sequential descriptions includes also RT-level descriptions representing an FSM controlling a datapath. Any behaviorally sequential VHDL description is converted into an internal representation, based on Binary Decision Diagrams (BDDs), which is used for functional test generation. The procedure for the VHDL to BDD translation is based on the concepts introduced in [14], which are here modified to take into account the behaviorally sequential nature of the analyzed descriptions. VHDL is parsed and a Control/Data Flow Graph (CDFG) is extracted. Each node of the Control Flow Graph is associated with a Data Flow Graph (DFG) which represents all arithmetic or boolean expressions. The CFG is composed of four types of nodes: VHDL assignment, condition, loop and wait statements. All other VHDL constructs are translated into these four classes of statements, thus ensuring a general applicability to the proposed approach. Figure 1 shows the control flow graph of a behaviorally sequential description of the greatest common divider. The CFG generated is analyzed and partitioned in a graph, named Macrostate graph, where each node, named macrostate, clusters the set of statements of the CFG between a given wait and all wait directly reachable from it. Let us consider, for example, the GCD reported in Figure 1. The corresponding Macrostate graph (shown in Figure 2) presents two macrostates: the first one considers the subgraph of the CFG with the statements (1), 2, 3, 4, 9, [1], [5], with the statements 1 as first statement and 1 and 5 as last wait statements, while the second one groups statements (5), 6, 7, 8, 4, 9, [1], [5]. The edges of the Macrostate
:$,7 817,/ FORFN [ �
[L�
\ �
\L�
:+,/( �[ ≠ \ /223 :$,7 817,/ FORFN ,) �[ � \ 7+(1 \ �
\ � [�
(/6( [ �
[ � \�
(1' ,)� (1' /223� RX �
·�·�
·�·�
{ | } ~
� � � � � �
�
[�
�
�
Figure 1. GCD behavioral VHDL description and its control flow graph. graph connect the last wait statement of a node to the node having the corresponding wait as first statement. The Macrostate graph helps in modeling the sequential behavior, in fact, a design evolves going from a macrostate to another as clock increases, therefore a macrostate can be used to represent a high-level state. Moreover, in a behavioral description, there are other elements that contribute to the high-level state, for example variables read in a macrostate before its writing or outputs not written on all paths associated with a macrostate, such that their values should be considered during transitions from a macrostate to another.
� � � �
�
�
�
� �
�
� �
�
0DFURVWDWH� 6WDUW :DLW ��
0DFURVWDWH � 6WDUW :DLW ��
Figure 2. Macrostate graph associated with the GCD of figure 1. This Macrostate graph is then translated into the internal BDD-based representation adopted by the test generation algorithm. The translation proceeds in breadth-first manner, by analyzing first the initial macrostate (i.e. the macrostate containing the first instruction of the process) and then iteratively level by level, by computing all transitions associated with the whole design. Obviously, at the first level (i.e. when the initial macrostate is considered),
all the transitions and output values starting from the initial high-level state are considered, then the next level starts from the reached states and builds all the corresponding transitions and output values. The procedure ends when all transitions are computed or when the size increases over a given level. The transitions are built by adopting the procedure described in [14] considering the part of the CFG associated with a macrostate and building the output and the next state functionality considering the high-level state as primary input. The procedure resembles the traversal procedure adopted in formal verification to compute the set of reached states, but with a relevant difference: the procedure incrementally builds the functionality of the description and therefore can be interrupted when the size of the internal model increases over the manageable size. Moreover, we can extend the input domain decomposition adopted in [14] to control the size of the internal model. In particular, in [14] we consider a cube, named input decomposition cube, representing the input set values. When a variable does not appear in the input decomposition cube this means that the corresponding input can be set either to 0 or 1, while when a variable is present in positive (negative) form the corresponding input is fixed to the 1 (0) value. In this way, the internal model describes the functionality only for a subset of the input domain. The same procedure can be extended to the sequential case by traversing the Macrostate graph by considering for each time frame only those transitions compatible with a given input decomposition cube. Therefore, the analysis can incrementally analyze the description by existentially abstracting variables from the initial input decomposition cube, then enlarging the input subset until the whole domain is considered.
of the signal, variable or port, the VHDL line affected, the variable, signal or port instance in that VHDL line, the type of stuck-at error (bit stuck-at zero or one; condition stuck-at true or false). For bit failures the bit position is also identified. Since all bits of a VHDL description are used to model errors, we call this error model: bit coverage. Let us now relate the bit-coverage metric to the other metrics, developed in the software engineering field [1], and commonly used in functional testing.
�
�
3 Coverage Metrics Comparison The aim of the proposed functional testing strategy is to unify in the same approach the three problems of design errors identification, testability estimation and faults detection. For this reason, we adopt a behavioral error model, which is closely related to RT-level faults [20]. It is a single error model and it is based on the following VHDL modifications:
� �
Bit failures. Each variable, signal or port is considered as a vector of bits. Each bit can be stuck-at zero or one. Condition failures. Each condition can be stuck-at true or stuck-at false, thus removing some execution paths in the erroneous VHDL representation.
The error model excludes explicitly the incorrect behavior of the elementary operators (e.g., +; ; �; : : :). Therefore, only single bit input or output errors are considered, including all operator’s equivalent errors. Each error in the error list is characterized by the following properties: the name
�
Statement coverage. Any VHDL statement manipulates at least one variable or signal. Our bit failures are injected into all variables and signals on the left-hand and right-hand side of each assignment. Thus, at least one test vector is generated for all VHDL statements. To reduce the proposed error model to statement coverage it is thus sufficient to inject only one bit failure into one of the variables (signals) composing a VHDL statement. If the injected error is not behaviorally redundant, a test vector is generated covering the statement. In conclusion, the bit-coverage metric produces a larger number of vectors with respect to statement coverage and guarantees to cover all statements. Branch coverage. The branch coverage metric implies the identification of patterns which verify the execution of both the true and false (if present) paths of each branch. Modeling of our condition failures implies the identification of patterns which differentiate the true behavior of a branch from the false behavior, and vice versa. This differentiation is performed by making stuck-at true (false) the branch condition and by finding patterns executing the false (true) branch, thus executing both paths. In conclusion, the proposed bit-coverage metric includes the branch-coverage metric. Condition coverage. The proposed error model includes condition failures which make stuck-at true or stuck-at false any condition disregarding the stuckat values of its components. Thus, if a condition is composed of multiple clauses, the proposed approach would actually model only one erroneous behavior while condition coverage requires to models all erroneous behaviors of each clause. However, a simple VHDL transformation allows the proposed error model to cover all conditions. In fact, a multiple-clause condition (e.g., IF ( x > 0 AND y < 5) THEN) is converted into a Boolean variable assignment and a condition on the variable (e.g., test := (x > 0) AND (y < 5); IF (test = TRUE) THEN). This transformation preserves the VHDL semantic. In this case, all injected bit failures produce test patterns for all clauses, thus
allowing the proposed bit-coverage metric to cover all conditions.
�
Path coverage. The verification of all paths of a VHDL process can be a very complex task due to the possible exponential grow of the number of paths. The proposed error model selects a finite subset of all paths to be covered. The subset of covered paths is composed of all paths that are examined to activate and propagate the injected errors from the inputs to the outputs of the VHDL design entity within a given time limit. Note that, such paths are not explicitly enumerated, but they are symbolically executed as described in the next section.
In [6] statement coverage has been extended by partitioning the code in blocks and by activating these blocks a fixed number of times. This block coverage criterion is included in the proposed error model in the case the number of bit errors included in a block is larger than the number of times the block is activated. In fact, a test pattern is generated for each bit error, thus the block including the error is activated when the error is detected. In conclusion, the bit-coverage metric, applied to VHDL descriptions, unifies into a single metric the well known metrics concerning statements, branches and condition coverage. Moreover, an important part of all paths is also covered and all blocks of a description are activated several times.
4 Test Generation Algorithm The behavioral level test pattern generator is based on the comparison between the error-free and erroneous BDD representations of the VHDL specification. It is composed of the following steps that are repeated for each class of behavioral errors:
� � �
�
Simulate test sequences already identified for other error classes, if any. Translate the VHDL specification into a BDD-based representation, while injecting the current error class, thus producing an error-free and an erroneous representation. Build the automaton, whose recognized language describes all the test sequences for errors of the current class. There is an acceptor state for each error of the class. If for an error no acceptor state can be identified, then the error is behaviorally redundant. Traverse breadth-first the automaton, until at least one acceptor state is reached, then backward traverse it until the reset state is found, thus extracting the test sequence that detects such an error.
�
Update the current class error coverage.
The automaton is built by starting from the couple composed of the reset state of the error-free and erroneous representations. Each state of the automaton is labeled by a couple of high-level states, one belonging to the error-free representation and the other to the erroneous one. A highlevel state is composed of variables, output ports values, and the current macrostate encoding. In order to build the automaton it is necessary to identify the next high-level state for each error-free and erroneous high level state. The couple of high-level next states reached under a specified input corresponds to the next automaton state. Two automaton states are connected by an oriented edge labeled with the input value. The computation of the next high-level states terminates when no new automaton states can be identified, thus reaching a convergence in the expansion. When the output values generated by the error-free representation differ from those generated by the erroneous one, the next automaton state represents an acceptor state. Therefore the language accepted by this automaton is the set of test sequences for the current error class. The automaton construction is similar to the one described in [16]. When the translation into the internal representation is performed by adopting the input domain decomposition, as described in section 2, the automaton construction is constrained with respect to an input decomposition cube by considering only a subset of the input domain. In this way, the automaton is computed to accept all test sequences compatible with the input decomposition cube, thus being able to control the test generation process, without going beyond the memory limits and attempting to generate the test sequences on the reduced representation. In this case, if the automaton does not present an acceptor state, the input domain must be enlarged and a new attempt performed. An error can be classified as behaviorally redundant only when the whole domain is considered.
5 Gate-level Test Sequences Derivation The behavioral test sequence generated before the behavioral synthesis step, does not take into account the effects of the different synthesis steps, and in particular the different possibilities in terms of scheduling and module allocation, that affect the resulting RT-level architecture. To effectively apply the behavioral test sequence to a RTlevel or gate-level description, the test sequence must be tailored to the scheduling applied by the high-level synthesis. This operation can be performed by identifying how many clock cycles are necessary to execute all VHDL instructions belonging to a specific macrostate. This implies that the instructions belonging to a macrostate must be scheduled in an integer number of control steps, that is no control step can include instructions belonging to different macrostates. Output operations are performed in the last clock cycle of
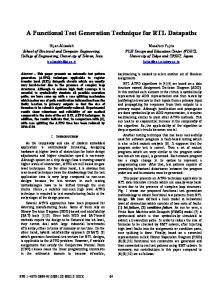
the macrostate, while read operations can be assigned to any instruction belonging to the macrostate. Therefore, given the number n of clock cycles required to execute a macrostate at the RT level, the behavioral test vector applied to such a macrostate at the behavioral level must be repeated n times in order to synchronize its outputs with the start of the execution of the instructions of the next macrostate. The value n represents the number of clock cycles necessary to produce the same output value on the outputs of the RT-level representation obtained after one clock cycle on the behavioral-level description. This value differs for each macrostate, since the number of control steps required to schedule each macrostate can differ significantly. The procedure allowing the identification, for each behavioral test vector of each macrostate, of this replication number, is based on a simultaneous VHDL simulation of the RT-level description output by the synthesis tool and the behavioral-level description, modified to make the internal state of the computation observable. In fact, the original VHDL is modified by adding a set of outputs that allow to observe the value of the process internal variables and the code representing the next macrostate to be executed. These outputs are added in correspondence to each wait instruction of the specification, and therefore will be available at the last clock cycle of the current macrostate execution.
actually completed the execution of the current test vector. This event occurs when the output value produced by the RT-level circuit description is the same of the output value generated by the behavioral description. In fact, the value of the clock signal OK depends on the result of the comparison of the outputs produced by the behavioral architecture in one cycle, and the outputs produced by the RT-level architecture at each clock cycle CK. When the two values are the same, the clock signal OK assumes value 1, triggering the reading of a new behavioral test vector. For all the clock cycles CK in which the two output values differ, the current input test vector is written in the file that will contain the final RT-level test sequence. This allows the identification of the number of times each test vector must be repeated.
6 Experimental Results The proposed functional test pattern generator has been implemented in the BEHATE program (BEHAvioral Test Environment), which is composed of more than 120K C code lines. Experiments have been run on a SunUltra 30/248 with 1Gbyte RAM.
6.1 Functional test generation The analysis has been performed on some behaviorallevel VHDL benchmarks, whose description can be accepted by the Behavioral Compiler of Synopsys. Benchmarks have been selected from the following two sets:
�
0RGLILHG 9+'/ EHKDYLRUDO &RPSDUDWRU
%HKDYLRUDO WHVW
�
2.
VHTXHQFH 0RGLILHG 9+'/ JDWH�OHYHO
&.
&RQWUROOHU
Single-process high-level FSMs of the benchmarks set [19]. Such benchmarks are control dominated, since they mainly represent control operations.
*DWH�OHYHO WHVW VHTXHQFH
&ORFN JHQHUDWRU
Figure 3. RT-level sequences derivation. Figure 3 shows a schematic view of the VHDL design entities simulated for the generation of the RT-level test sequence. The VHDL testbench simulated instantiates a clock generator and two architectures for the same entity representing the circuit under test, the behavioral VHDL description and the RT-level one. The testbench reads the stimuli file containing the behavioral test sequence, one vector at a time. The two architectures both receive the same inputs, corresponding to the test vector, but a different clock signal. While the RT-level architecture receives the clock signal produced by the clock generator CK, the behavioral architecture receives a different clock signal OK, multiple of CK, that allows the activation of a new execution of the behavioral architecture only when the RT-level architecture has
High-level synthesis benchmarks [18], which follow the constraints on the VHDL language reported in Section 2. Such benchmarks are data dominated, since they describe some kind of filters and arithmetic operations. High-level characteristics of all benchmarks are reported in Table 1 in terms of number of bit of inputs, outputs, variables, wait statements, VHDL lines and VHDL modules. Results of functional test generation are reported in Table 2 in terms of memory used MByte, number of errors injected, error coverage, number of functional vectors generated and CPU time in seconds. The adopted functional test generator is able to cover the majority of errors.
6.2 Criteria comparison on behavioral errors The bit-coverage criterion has been shown in [20] to allow the efficient identification of design errors. For this reason, the classical statement-coverage criterion and the block-coverage [6] strategy have been compared to the proposed bit-coverage criterion. Results are reported in Table 3 in terms of achieved bit-coverage and number of vectors. Patterns generated for covering statements and blocks do not achieve (except for b07) the same bit coverage achieved by using the proposed functional test generator, which targets bit errors. To evaluate this difference in terms of design
Name b01 b02 b03 b04 b06 b07 b08 b09 b10 b11 gcd 16 shewa 8 maha 8 kim 8
#In. 4 3 6 13 4 3 11 3 13 67 34 95 95 92
#Out. 2 1 4 8 6 8 4 1 6 64 16 16 8 16
#Var. 3 3 26 61 3 43 57 2 14 23 48 40 56 56
#Wait 1 1 1 1 1 1 1 1 1 1 2 7 3 5
#VHDL lines 110 70 141 102 128 92 89 103 167 119 38 102 92 97
Table 1. Benchmarks characteristics. Name b01 b02 b03 b04 b06 b07 b08 b09 b10 b11 gcd shewa maha kim
MByte 8.0 5.8 12.2 17.9 8.9 10.8 14.2 15.0 11.2 15.2 16.0 554 28.5 14.0
Err. 185 67 304 439 165 897 346 312 315 886 556 988 1004 1442
%Err. Cov. 100.0 97.0 78.0 86.8 99.0 52.2 85.5 77.9 84.1 63.9 99.3 97.9 95.4 87.5
Vec. 152 42 246 52 74 168 310 236 159 542 261 79 37 58
CPU s. 19.3 1.8 722.9 5731.0 13.2 3271.4 10306.4 3521.3 654.8 20204.6 18798.0 7580.1 17917.0 9384.1
Table 2. Functional test pattern generation. errors identification, we used stuck-at fault coverages at the RT-level as an independent comparison method.
6.3 Criteria comparison on RT-level faults
The comparison between the error coverage reported in Table 3 and the fault coverages reported in Table 4 shows that an higher bit coverage implies an higher coverage of RTL stuck-at faults. Assuming that RT-level faults model design errors, it is possible to conclude that the proposed bit coverage metric allows the identification of more design errors than classical coverage metrics.
6.4 Testability evaluation at the gate level Finally, each behavioral benchmark of the second set ([18]) has been synthesized in four different ways by using different module implementation and resource sharing by constraining the behavioral compiler of Synopsys. This
Name b01 b02 b03 b04 b06 b07 b08 b09 b10 b11
Statement cov. %Bit C. Vec. 94.6 55 88.1 21 75.6 76 65.6 20 95.2 28 52.1 171 75.6 111 63.1 96 78.7 90 56.4 130
Block cov. %Bit C. Vec. 99.0 247 94.0 99 74.0 252 84.7 33 97.0 122 52.1 1227 80.6 367 69.0 720 79.0 1372 60.0 459
Bit cov. %Bit C. Vec. 100.0 152 97.0 42 78.0 246 86.8 52 99.0 74 52.1 168 85.5 310 77.9 236 84.1 159 63.9 542
Table 3. Comparison on behavioral errors.
Name b01 b02 b03 b04 b06 b07 b08 b09 b10 b11
Statement cov. Det.F. %F.C. 279 93.6 163 89.6 731 68.8 2548 65.6 347 91.8 1471 52.6 877 80.8 777 69.1 1011 85.0 2471 79.3
Block cov. Det.F. %F.C. 289 97.0 167 91.8 723 68.1 2484 64.0 361 95.5 1482 53.0 972 89.5 824 73.3 1054 88.6 2627 84.3
Bit cov. Det.F. %F.C. 293 98.3 175 96.2 751 70.7 2874 74.0 361 95.5 1475 52.8 998 91.9 909 80.9 1061 89.2 2797 89.8
Table 4. Comparison on RTL faults.
operation has been performed to simulate the exploration of different high-level synthesis alternatives from the point of view of testability. All implementations have been analyzed for testability at the gate level by using: one of the most efficient commercial TPG, and the test sequences derived from the functional test patterns of BEHATE. Such sequences have been derived by applying the methodology reported in Section 5. The fault coverage achieved by the commercial TPG and by BEHATE is reported for each benchmark implementation in Figure 4. Moreover, the accumulated CPU time for the testability analysis of all benchmarks implementations is reported in Figure 5. The CPU time for BEHATE includes functional test generation, gatelevel test sequences derivation and fault simulation. The analysis of both graphs underlines that it is reasonable to use BEHATE to generate functional test patterns to evaluate testability at the gate level, since a very accurate estimation of the achievable gate-level fault coverage can be obtained by saving a relevant amount of time.
7 Concluding Remarks The paper introduces a new functional test generator able to analyze VHDL behavioral descriptions. Characteristics
In this way, the three problems of design errors identification, testability estimation and faults detection are faced by using an integrated testing strategy. Future work will consider the comparison of the proposed bit-coverage metric to coverage criteria based on observability measures (e.g. [9, 12]).
100,00
90,00
80,00
70,00
60,00
50,00
CPTG FC (%) Our approach FC (%)
40,00
Acknowledgments We would like to acknowledge Prof.Sonza Reorda and Dr.Violante of Politecnico di Torino, which provide test vectors for block coverage.
30,00
20,00
10,00
0,00 gc d_ 16 _1 gc d_ 16 _2 gc d_ 16 _3 gc d_ 16 _4 sh ew a_ 8_ 1 sh ew a_ 8_ 2 sh ew a_ 8_ 3 sh ew a_ 8_ 4 m ah a_ 8_ 1 m ah a_ 8_ 2 m ah a_ 8_ 3 m ah a_ 8_ 4 kim _8 _1 kim _8 _2 kim _8 _3 kim _8 _4
References
Figure 4. Gate-level stuck-at fault coverage.
[1] Glenford J. Myers. The Art of Software Testing. Wiley - Interscience, New York, 1979. [2] J.P. Bergmann and M.A. Horowitz. Improving Coverage Analysis and Test Generation for Large Designs. Proc. IEEE ICCAD, pages 580–583, 1999. [3] J. Yuan, K. Shultz, C. Pixley, H. Miller, and A. Aziz. Modeling Design Constraints and Biasing in Simulation Using BDDs. Proc. IEEE ICCAD, pages 584–587, 1999.
90000
80000
[4] D.L. Dill and S. Tasiran. Embedded Tutorial: Formal Verification Meets Simulation. Proc. IEEE ICCAD, pages 221–222, 1999.
70000
60000
50000 CPTG time(s) Our approach time (s) 40000
30000
20000
10000
[5] F. Fallah, P. Ashar, and S. Devadas. Simulation vector generation from hdl descriptions for observability-enhanced statement coverage. Proc. ACM/IEEE DAC, pages 666–671, 1999. [6] F. Corno, P. Prinetto and M. Sonza Reorda. Testability Analysis and Atpg on Behavioral RT-level VHDL. Proc. IEEE ITC, 1997. [7] M.S. Abadir, J. Ferguson, and T.E. Kirkland. Logic Design Verification via Test generation. IEEE Trans. on CAD/ICAS, 7(1):138-148, January 1988.
gc d_ 16 _1 gc d_ 16 _2 gc d_ 16 _3 gc d_ 16 _4 sh ew a_ 8_ 1 sh ew a_ 8_ 2 sh ew a_ 8_ 3 sh ew a_ 8_ 4 m ah a_ 8_ 1 m ah a_ 8_ 2 m ah a_ 8_ 3 m ah a_ 8_ 4 kim _8 _1 kim _8 _2 kim _8 _3 kim _8 _4
0
Figure 5. Accumulated CPU time necessary to measure testability. of the behavioral descriptions have been investigated, and behaviorally sequential representations have been defined with respect to simpler combinational representations. The proposed functional TPG works on a BDD-based representation extracted from a VHDL model by injecting behavioral errors. The adopted error model (bit-coverage) has been shown to be more effective in identifying design errors. This verification has been performed by comparing stuck-at fault coverages obtained by using different functional coverage criteria. Functional test patterns are generated directly at the early steps of the design flow and they are independent of any high-level synthesis operation. Thus, they can be used to evaluate the testability of the behavioral descriptions before the actual synthesis. Moreover, they can be tailored to the particular implementation selected during the synthesis and can be used to test gate-level stuck-at faults. Finally, since this derivation of the functional test sequences to the synthesized circuits is very simple and fast, functional test sequences can be used to compare the testability of different implementations by performing fault simulation at the gate level, without being constrained to generate test sequences for each implementation.
[8] S. Kang and S.A. Szygenda. Modeling and Simulation of Design Errors. Proc. IEEE ICCD, pp.443-446, 1992. [9] S. Devadas, A. Ghosh, and K. Keutzer. An Observability-Based Code Coverage Metric for Functional Simulation. Proc. IEEE ICCAD, pp.418-425, 1996. [10] F. Fallah, S. Devadas, and K. Keutzer. Functional vector generation for HDL models using linear programming and 3-satisfaiability. Proc. ACM/IEEE DAC, pages 528–533, 1998. [11] F. Fallah, S. Devadas, and K. Keutzer. OCCOM: Efficient computation of observability-based code coverage metrics for functional verification. Proc. ACM/IEEE DAC, pages 152–157, 1998. [12] F. Corno, M. Sonza Reorda, G. Squillero. High-Level Observability for Effective High-Level ATPG. Proc. IEEE VLSI Test Symposium, 2000. [13] R. Vemuri and R Kalyanaraman. Generation of design verification tests from behavioral VHDL programs using path enumeration and constraint programming. IEEE Trans. on VLSI Systems, 3(2):201–214, June 1995. [14] F. Ferrandi, F. Fummi, and D. Sciuto. Implicit test generation for behavioral VHDL models. Proc. IEEE ITC, pages 436–441, 1998. [15] LEDA VHDL*Verilog System user’s manual. VHDL Compiler Version 4.1, 1998. [16] F. Ferrandi, F. Fummi, E. Macii, M. Poncino, D. Sciuto. Symbolic Optimization of Interacting Controllers Based on Redundancy Identification and Removal. IEEE Trans. on CAD/ICAS, 19(7):760–772, July 2000. [17] F. Somenzi, CUDD: University of Colorado Decision Diagram Package, Release 2.3.0, User Manual, Dept. of ECE, University of Colorado, Boulder, CO, September 1998. [18] 1991 and 1992 High Level Synthesis benchmarks. p://mcnc.mcnc.org/pub/benchmark/HLSynth91[92], 1992.
ft-
[19] Benchmarks included in ITC’99 suite. http://www.cad.polito.it/tools/#bench, 1999. [20] F. Ferrandi, F. Fummi, and D. Sciuto. Symbolic Functional Vector Generation for VHDL Specifications. Proc. IEEE DATE, pages 442-446, 1999.