EDGE DETECTION OF MANMADE OBJECTS USING WAVELETS IN HIGH RESOLUTION SATELLITE IMAGES Varvara D. Noutsou, Graduate Student Demetre P. Argialas, Proffesor Remote Sensing Laboratory, School of Rural and Surveying Engineering, National Technical University of Athens 9 Herron Polytechniou Str,15780 Zografos Campus, Athens, Greece
[email protected],
[email protected] Pantelis N. Michalis Research Fellow University College London,
[email protected]
ABSTRACT The edge detection problem of man made objects has traditionally been addressed with the use of the Canny and Hough transforms. In recent years considerable interest was developed in new transforms that address the problem of edge detection, especially in case of high resolution satellite images. They are based on the wavelet transform. The challenge is to choose the appropriate wavelet for a particular application which is not known a priori. In this paper, two methods based on wavelets have been introduced and implemented for extracting edges. The first method was based on the biorthogonal mother wavelet while the second method was based on a new wavelet named “contourlet”. Contourlets have been appropriately designed to locate the edges of an image, thus having a significant advantage compared to classical wavelets for edge detection. The evaluation was made using high resolution images containing specific features with a variety of geometric shapes, in order to understand better the advantages of the “new wavelet” transform. The results have shown that the wavelet transform using the biorthogonal wavelet produced accurate edge detection results on high resolution satellite images of urban areas Moreover, the contourlet gave very good results, in detecting roads, some of their types, and other linear features. KEY WORDS: remote sensing, contourlet, multiresolution, scale multiplication, roads, buildings
INTRODUCTION The new generation of high resolution satellite images which have been acquired since 1999, gave a boost in Remote Sensing to expand in new fields of urban applications. In such fields, edges are of great importance as they determine the boundaries of significant objects like buildings, urban vegetation, and road networks. The edge detection problem in urban areas has traditionally been addressed with the use of the Canny and Hough transforms. In recent years considerable interest has been generated for new transforms that specifically address the problem of edge detection, especially in case of high resolution satellite images. They are based on multiresolution analysis, time-frequency analysis, pyramid algorithms and wavelet transform (Gonzales et al., 2004). Wavelets are localized in frequency as well as in space having an advantage over the Fourier transform which is only localized in frequency. As a result temporal-spatial information is maintained during the wavelet transformation process which is extremely important for edge detection. There are many possible sets of wavelets and they are usually represented by a mother wavelet and a scaling function. The challenge is to choose the appropriate wavelet for a particular application something which is not known a priori. Various wavelets have been introduced attempting to give better results in the edge extraction process than the traditional methods, along with the choice of a threshold level (Gonzales et al., 2004). Two methods based on wavelets from the multiresolution point of view have been introduced and implemented in the framework of the present paper, for extracting edges in urban areas from high resolution satellite imagery. The first method was based on the two-dimensional fast wavelet transform using the biorthogonal mother wavelet (Gonzales et al., 2004). Various scales of the multiresolution analysis and their combination were tested taking into consideration the dimensions of the objects studied. The second method was based on a new wavelet named “contourlet” which has been developed recently as an improvement of the classical wavelets (Do, 2001). Contourlets have been appropriately designed for edge detection, so that to locate the edges of an image, thus having a significant advantage compared to classical wavelets.
ASPRS 2007 Annual Conference Tampa, Florida May 7-11, 2007
In the following, the theoretical background of the wavelet and the contourlet transforms is first introduced along with the most important methods and procedures for edge extraction based on wavelets and contourlets. Finally, the performance of a wavelet based scale multiplication scheme, as well as the contourlet transform, applied to high resolution satellite images in order to detect manmade features, are presented.
WAVELETS From Fourier to Wavelet Analysis The Fourier transform has been the mainstay of transform-based image processing since the late 1950s. However, Fourier analysis has a serious drawback as only frequency information remains while the local one is lost. This means, that any modification of the Fourier coefficients has a global effect on the image. In order to involve localization on the analysis, the Short Time Fourier transform (STFT) is adapted (Castelman, 1995). In this case, the image is windowed, and thus the information has a precision relevant to the size of the window used. The drawback is that the window is the same in all frequencies. In principal, in image processing a more flexible approach is required where the window size varies in order to determine more precisely either location or frequency. Wavelet analysis allows the variation of the window based on the frequency information. As a result, long time intervals are used in low-frequency information and short time intervals in high-frequency information. In general, wavelets have limited duration and an average value of zero and thus they are irregular and asymmetric with short duration (Mallat, 1998). As with the Fourier transform, the same possibilities exist for wavelet transforms: a continuous wavelet transform, a wavelet series expansion, and a discrete wavelet transform.
The Continuous Wavelet Transform (CWT)-Wavelet properties Introduction. The present goal is to interpreter digital images which in reality are discrete as series of pixels in two dimensions. However, for completeness, the continuous wavelet transform (CWT) is covered in this paragraph giving a direct comparison to the Fourier transform (Castelman, 1995). The continuous wavelet transform of a continuous, square-integrable function, f(t) is described as
γ ( s, t ) = ∫ f (t )ψ s*,t (t )dt
(1)
where * denotes complex conjugation. This equation shows how a function f(t) is decomposed into a set of wavelets ψs,τ(t). The variables s and τ, are the scale and the translation. The wavelets are generated from a single basic mother wavelet ψ(t), by scaling and translation:
ψ s ,t (t ) =
1 ⎛ t −τ ⎞ ψ⎜ ⎟ s ⎝ s ⎠
(2)
The theory of wavelet transforms defines a framework within which a wavelet is designed in order to fulfil specific criteria. It is not needed to specify the wavelet basis functions a priori. This is another advantage of the wavelet transform compared to the Fourier transform, or other transforms. The most important properties of wavelets are the admissibility and the regularity conditions. Wavelets should be waves as they are used to analyze and reconstruct a signal without loss of information (Admissibility condition). An additional condition on the wavelet functions should be defined in order to make the wavelet transform decrease quickly with scale s. This is the regularity condition where the wavelets should have some smoothness and concentration in both time and frequency domains. Regularity is explained using the concept of vanishing moments. To summarize, the ‘wave’ is given by the admissibility condition, while the ‘let’ or fast decay by the regularity condition, and thus the wavelet is developed. (Gonzales et al., 2004). The two-Dimensional CWT. As can be seen from equation (1) the wavelet transform of a one-dimensional function f(t) is two-dimensional. For functions of more than one variable, this transform also increases the dimensionality by one.
ASPRS 2007 Annual Conference Tampa, Florida May 7-11, 2007
The Discrete Wavelet Transform Introduction. When digital images are to be viewed or processed at multiple resolutions, the Discrete Wavelet transform (DWT) is the mathematical tool of choice (Gonzales et al., 2004). In addition to being an efficient, highly intuitive framework for the representation and storage of multiresolution images, the DWT provides powerful insight into image’s spatial and frequency characteristics. An efficient way to implement DWT using filters was developed by Mallat (1998) (Gonzales et al., 2004). The Mallat algorithm is in fact a classical scheme known in the signal processing community as a two-channel subband coder. This very practical filtering algorithm yields a fast wavelet transform — a box into which a signal passes, and out of which wavelet coefficients quickly emerge. Fast Wavelet transform (FWT). An important consequence of the above properties is that both φ(x) and ψ(x) can be expressed as linear combinations of double-resolution copies of themselves. That is, via the series expansions ϕ ( x) = ∑ hϕ (n) 2ϕ (2 x − n) ψ ( x) = ∑ hψ (n) 2ψ (2 x − n)
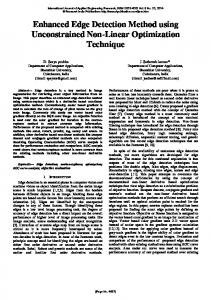
where hφ and hψ are called scaling and wavelet vectors, respectively. They are the filter coefficients of the fast wavelet transform (FTW), an iterative computational approach to the DWT shown in Figure 1. The Wφ(j, m, n) and {Wψi(j,m,n) for H,V,D} outputs in Figure 1 are the DWT coefficients at scale j. Blocks containing time-reserved scaling and wavelet vectors are the lowpass and the highpass decomposition. Finally, blocks containing a 2 and down arrow represent downsampling.
Figure 1. Fast wavelet transform (source: Gonzales et al., 2004). Each pass thought the filter bank decomposes the input into four lower resolution components. The Wφ coefficients are created via two lowpass filters and thus called approximation coefficients. {Wψi(j,m,n) for H,V,D} are horizontal, vertical and diagonal coefficients, respectively. This is the representation of the first iteration (Figure 1). The second iteration would consider as input the approximation coefficients.
WAVELETS AND EDGE DETECTION In images, edges appear as the points where great changes in brightness are observed, separating different objects or different conditions. More specifically, in satellite images, edges correspond to roads, airports, rivers, buildings, crop/parcel boundaries, coastlines, etc. Subsequently, they determine the boundaries of significant objects and their detection is of crucial importance in Remote Sensing. Humans can easily distinguish the limits of different objects in an image using different types of information like brightness, text, colour as well as their knowledge of the world. However this human understanding procedure is difficult to be automated. Concerning image processing, wavelet analysis is used in compression, denoising and image fusion. Its usefulness was also exploited in image segmentation and classification (Liapis et al., 1997). As suggested by Marr and Hildreth (1980), multiple scales should be employed to describe the variety of the edge structures and then these multiscale descriptions could be synthesized to form an edge map. Thus, wavelet analysis being a multiscale analysis can be used in edge detection. ASPRS 2007 Annual Conference Tampa, Florida May 7-11, 2007
Wavelet analysis may perform well in high resolution images as it can manage better their detailed information. Edges of large objects are maintained in higher level scales whereas edges of smaller objects are maintained only in smaller levels of wavelet analysis. Edge detection techniques that are based on Wavelet analysis, have been introduced since 1992. Mallat and Zhong (1992) proposed the use of the quadratic spline as a mother wavelet which approximates the first derivative of Gaussian, and the determination of edges by calculating the local maxima of the wavelet transform. They proved that this method is equivalent to the Canny edge detector. Based on this model, Zang and Bao (2002) proposed a scale multiplication-based edge detection scheme. This methodology is introduced in detail on paragraph 4 below. Duccotet et al. (2004) proposed modelling of contours as smoothed singularities of three particular types (transition, peak and line). Using the wavelet transform modulus maxima in different scales, edge points are characterized according to their similarities to the models. The proposed algorithm detects and locates edges at a locally adapted scale and it is able to identify the type of each detected edge point and to measure both its amplitude and smoothness degree. Sun et al. (2004), proposed an algorithm where the statistical properties of multiscale and multidirectional (subband) wavelet coefficients of an image are modelled by a wavelet domain vector hidden Markov tree. Each wavelet coefficient is viewed as an observation of its hidden state and the hidden state indicates if it belongs to an edge. Shih and Tseng (2005) proposed a two-stage edge extraction approach with a contextual-filter edge detector and multiscale edge tracker. The edge detector detects most edges and the tracker refines the results as well as reduces the noised or blurred influence. An optimization process, using Canny’s three criteria, is introduced in the filter derivation by Hsieh et al. (1997) to derive a wavelet-style edge filter which performs better than that of Mallat-Zhong in edge detection. It was pointed out that if an edge detector is to detect the zero-crossings as edge points, it must be symmetric with respect to the origin. On the other hand, if an edge detector is to detect the local extrema as edge points, it must be anti-symmetric with respect to the origin. (Hsieh et al., 1997)
SCALE MULTIPLICATION In the scale-multiplication-based edge detection scheme, two DWT subbands are multiplied as a product function and edges are determined as the local maxima in the product function after thresholding. The scale multiplication enhances image structures and suppresses noise. An integrated edge map will be formed efficiently while avoiding the ill-posed edge synthesis process, unlike other multiscale edge detectors, where the edge maps are formed at several scales and then synthesized together. It was shown (Zhang and Bao, 2002) that much improvement is obtained on the localization accuracy and the detection results are better than using either one of the two scales independently. It is often required to increase the filter’s scale in order to smooth the existing noise. An edge could disappear or could be dislocated if there is another edge curve at its neighbourhood. It was also found that the scale multiplication will significantly reduce the interference of neighbouring edges. The wavelet used in the scale multiplication scheme is the Mallat wavelet (Mallat and Zhong, 1992). The corresponding φ(x) is a cubic spline, and thus ψ(x) is a quadratic spline. φ(x) approximates the Gaussian function closely and the DWT is equivalent to the Canny edge detector. 0 ⎧ ⎪ ϕ ( − x) ⎪ ϕ ( x) = ⎨ 3 2 ⎪− 8 x − 8 x + 4 / 3 ⎪⎩ 8( x + 1)3 / 3
x ≥1 0 ≤ x ≤1 − 0.5 ≤ x ≤ 0 − 1 ≤ x ≤ −0.5
ASPRS 2007 Annual Conference Tampa, Florida May 7-11, 2007
0 ⎧ ⎪ − ψ (− x) ⎪ ψ ( x) = ⎨ 2 ⎪− 24 x + 16 x ⎪⎩ 8( x + 1) 2
x ≥1 0 ≤ x ≤1 − 0.5 ≤ x ≤ 0 − 1 ≤ x ≤ −0.5
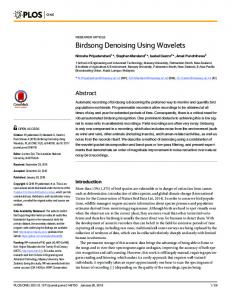
The peaks due to edges tend to propagate across scales, thus by directly multiplying the DWT at adjacent scales will enhance the edge structures whereas it will dilute the noise. With scale varying along dyadic sequence 2j, jєZ, the support of wavelet base ψj(x) will increase rapidly. This is also to say Wjf(x) will become smoother rapidly along scales. If three or more adjacent scales were incorporated in the multiplication, edges would not be sharpened more but much edge dislocation would occur. So it is appropriate to analyze the multiplication using two scales (Zhang and Bao, 2002). In Fig. 2(a), a block signal g and its noisy version f=g+ε are illustrated, where ε is Gaussian white noise. Their DWT at the first three scales are given in Fig. 2(b) and (c). It is shown that at the finest scale the wavelet coefficients W1f are almost dominated by noise. At the second and third scales, the noise diluted rapidly. It can also be seen that at the small scales the positions of the step edges are better localized. But some noise may be falsely considered as edges. At the large scales, the SNR is improved and edges can be detected more correctly but with the decreasing of the accuracy of the edge location. In Fig. 2(d), the product Pfj, j=1–3, are illustrated. Apparently the step edges are more observable in Pfj than in Wjf. (Zhang and Bao, 2002)
Figure 2. (a) A signal g and its noisy version f, (b), (c) DWT of g and f, respectively, in the first three scales (d) the results of scale multiplication in f (source: Zhang and Bao, 2002). In this scheme, the single threshold is preferred for the simplicity, as edges and noise can be better distinguished in the scale product and a properly chosen threshold could suppress the noise maxima effectively. The edges are considered the local maxima in Pfj. A significant edge at abscissa x0 will occur on both the adjacent scales and the signs of Wjf(x0) and Wj+1f(x0) will be the same, so that Pfj(x0) should be non-negative. If Pfj(x) is less than zero, the point will be considered as noise and filtered out. The scale multiplication will improve the detection performance (especially on the localization accuracy) and reduce the interference of neighbouring edges (Zhang and Bao, 2002).
CONTOURLET Introduction Wavelets were initially adopted in signal-processing due to their good performance and representation of the signals as piecewise smooth functions in one dimension. However, images are created by two-dimensional signals, which are smooth away from discontinuities across smooth curves. Moreover, as it was shown in paragraph 2.3.2 the fast wavelet transform is implemented only in three directions (horizontal, vertical and diagonal). This is a limitation to the possible ways of discontinuities or curve direction. As a result, wavelets are good at isolating the ASPRS 2007 Annual Conference Tampa, Florida May 7-11, 2007
discontinuities at edge points, but will not see the smoothness along the curves. This indicates that more powerful representations are needed in higher dimensions. The contourlet transform is a two-dimensional discrete framework that can capture the intrinsic geometrical structure of the images. A double filter bank structure, named the pyramidal directional filter bank, was proposed (Do, 2001) by combining the Laplacian pyramid with a directional filter bank. This transform, provides a flexible multiresolution, local and most importantly the directional expansion for images.
Definition of Contourlets Curvelets. Recently, a new transform, named curvelet, was introduced with key features the high directionality and anisotropy. However, as the curvelet transform was defined in the frequency domain, it is not clear how curvelets are sampled in the spatial domain. It was proposed a filter bank structure that can deal effectively with piecewise smooth images with smooth contours. The resulting image expansion is a frame composed of contour segments, and thus the name contourlet was proposed (Do, 2001). Representing 2-D piecewise smooth signals. In Figure 3 the wavelet transform of a 2-D piecewise functions with a smooth discontinuity curve is shown. 2-D wavelet basis functions have supports on dyadic squares as it is described in paragraph 2.3.3. Wavelets can not ‘understand’ the smoothness of the curve and there are significant wavelet coefficients at the scale where the thick lines represent the discontinuity curves separating two smooth regions. Curvelet basis functions can be viewed as a local grouping of wavelet basis functions into linear structures so that they can capture the smooth discontinuity curve more efficiently.
Figure 3. Non-linear approximation of 2-D piecewise smooth signals (source: Do, 2001). The performance of the wavelets is improved by grouping the nearby high correlated coefficients. The curve scaling relation hints that we can group about α2-j/2 nearby wavelet basis functions at the scale 2-j into one basis function with a linear structure so that its width is proportional to its length squared, as shown in Figure 3. Thus the contourlet approach is superior compared with the wavelet transform (Do, 2001).
Contourlet Construction The original construction of the curvelet transform was intended for functions defined in the continuum space R2. The development of discrete transforms for sampled images that have all the features promised by curvelets in the continuous domain remains a challenge, especially when critical sampling is desirable. Furthermore, as the curvelet transform was defined in the frequency domain, it is not clear how curvelets are sampled in the spatial domain (Do and Vetterli, 2003). A major challenge in capturing geometry and directionality in images comes from the discrete nature of the data: the input is typically sampled images defined on rectangular grids. For example, directions other than horizontal and vertical look very different on a rectangular grid. Because of the discrete nature of images, the notion of smooth contours on sampled images is not obvious. For these reasons, unlike other transforms that were initially developed in the continuous domain and then were discretized for sampled data, contourlets have been developed in the discrete-domain (Do and Vetterli, 2005). In order to overcome these limitations the contourlet transform was introduced. The construction of the contourlets, a wavelet-like transform for edge (points) detection is used initially, and then a local directional transform for contour segment detection. This approach is similar to the popular Hough transform for line detection. With this insight, a double filter bank structure (Figure 3) is constructed in which, at first, the Laplacian pyramid (LP) is used to capture the point discontinuities, and then a directional filter bank (DFB) is used to link point discontinuities into linear structures. The overall result is an image expansion with basis images as contour segments, and thus it is named the contourlet transform (Do, 2001). ASPRS 2007 Annual Conference Tampa, Florida May 7-11, 2007
Figure 4. Contourlet construction (source : Do, 2001).
EVALUATION PROCESS Introduction In this paper an IKONOS pan-sharpened image of a suburban area in Agios Stefanos region (Athens, Greece) was used. Different data sets of this scene, containing man-made objects were selected and different band combinations were used. As it was mentioned in paragraph 3 the wavelet analysis using the mother wavelet proposed by Mallat, is equivalent to the Canny edge detector. Thus, in order to achieve better results, improved methods should be used. The scale multiplication scheme was chosen because it is based on wavelet analysis and gives better results in noisy images. Considering the non-desired detailed information of high resolution satellite images as noise, which is reduced in higher levels of wavelet transform, the scale multiplication scheme would possibly perform well. Additionally, the contourlet transform was chosen as it was designed to handle discrete 2D signals, such as satellite images, and incorporates more directions in the detection process and thus it could capture the form of some curved edges. In addition, the contourlet transform, like wavelets, could capture information of different scales as it performs multiresolution analysis.
Scale Multiplication In this part, it should be mentioned that an assimilation of the original scheme proposed by Jang and Bao (2002) was used. The biorthogonal wavelet rbio3.1 was used from the matlab database, as it is asymmetric and resembles to the wavelet proposed by Mallat. Scale multiplication was primarily tested in artificial noisy images (containing straight lines of different directions and curved lines) as it is easier to evaluate the performance of the method and compare it to other ones in artificial images and then use it with the real, more complex, satellite images. These test showed that the method performs well in the multiplication of levels 1-2 and 2-3. In higher levels a significant dislocation of edges occurs. The levels 2-3 showed the best performance, presence of noise, but it wasn’t able to detect edges which are very close to each other, due to the lower resolution on these levels. Levels 1-2 perform well when noise doesn’t exist. Results from scale multiplication in noisy images were better than those of the Canny edge detector. The tests in artificial images showed where the method performed well and helped the understanding of its performance. However, if a method performs well in these images, it doesn’t mean that it will perform in the same manner in real (more complex) images or in every feature of an image. Thus, after these general considerations, a more detailed study was carried out. IKONOS images from different regions (urban and suburban areas) were used to evaluate the “scale multiplication” performance in high resolution satellite images. The scale multiplication scheme, gave good results in detecting manmade objects like buildings or road sides, without being disturbed from the detailed information of high resolution satellite images. In Figure 1 the image presented is the original images used, the 321 composite of the pansharpened image transformed in grayscale. The levels 1,2 of the wavelet transform were used in scale multiplication, because the buildings and roads in this image are not big enough to use higher scales. In higher scales, a distortion of their shape is observed or in other cases they cannot be detected well. Thus small scales were preferred. It was found that edges of manmade features were detected while in open areas, where small trees exist, ASPRS 2007 Annual Conference Tampa, Florida May 7-11, 2007
trees edges were not detected. The results were slightly better than those of the Canny edge detector, but they could be further improved, by better choice of the mother wavelet.
Contourlets Although, the contourlet transform was designed to maintain contour information, the contourlet toolbox (Contourlet Toulbox, 2007) was designed for applications such as denoise (by maintaining the most significant coefficients). Thus, a different scheme was created, based on the contourlet toolbox in order to detect edges. Different tests were conducted by using a simple threshold in the coefficients, or local maxima of the reconstructed image in order to use the contourlet transform to detect edge points.
Figure 5. Original Image (IKONOS, SpaceImaging).
Figure 6. Detected edges with rgb-image in the background.
Figure 7. Canny edge detector.
Figure 8. Edges resulted from Scale Multiplication.
Also, different tests were conducted, to evaluate the performance of the contourlet transform in high resolution satellite images. Images from urban and suburban areas were used and areas with different kind of roads and buildings. It was observed that the contourlet coefficient determined well the roads in high resolution satellite images. Four levels of decomposition were used. The contourlet coefficients constitute matrices which do not correspond to image dimensions, so it is not possible to use local criteria, or to determine the edges in the coefficients table. Thus, the edges were detected in the reconstructed image. The approximation coefficients were reduced to zero as they do not contain significant information about edges whereas edge information is represented by the other coefficients. This reconstructed image presents high values in the places where edges, of higher or smaller scales, exist. It was observed that using only the coefficients of lower scales, the results were not really good. The features of the reconstructed image usually are broken, because some of the information is contained in the next level. However, in order to detect big features or objects the coefficients of lower levels are required. This is the reason why four levels were used. Then the reconstructed image was thresholded to retain only the most significant values. The produced image was a binary image that represents the location of high coefficients in the contourlet domain. As these features are derived from different levels of the transform, their width was usually greater than one pixel-size. For example a road width was usually composed from three to ten pixels, according to its size. Thus, to produce the edge map, a morphological cleaning was carried out. ASPRS 2007 Annual Conference Tampa, Florida May 7-11, 2007
Finally, a further cleaning of the image was performed to retain only the road network, by using other morphological operators like fill, thin and shrink. In the following images (Figures 9-12) the results of the contourlets performance in a suburban area are presented in order to detect rural roads. The results show that almost all roads were detected and the road network was maintained (Figure 12) after the cleaning of the image. This cleaning may be further improved in order to maintain only the road network. In the reconstructed image (without the participation of the approximation coefficients), the higher values represent the locations where the radiometry increases whereas the lower (negative) values represent the location where the radiometry decreases. Both, high positive and negative values constitute edge points. To maintain the negative values the threshold should take into consideration the absolute value. Moreover, two edge images can be created, one for the positive values and one for the negative, by using different thresholds. The final edge map would result from the synthesis of the other two maps. In the case of road detection, the creation of two edge maps, was proved to be very useful to detect different kind of roads. The main (asphalt) roads appear darker than the rural roads, mainly in the infrared band (the 4th band in IKONOS satellite images). Thus using the appropriate band or band combination, the main road network can be defined by the negative values and the rural network by the positive ones. In the following images (Figures 13-14), the results of this method in detecting the main road network are presented. As these roads are big enough, the details of the lower level in the contourlet transform wasn’t used because they contain details that disturb the correct detection of these roads. It can be easily seen that the curved roads are well detected. Some problems occur only in very big roads. Roads of great width are not detected very well.
Figure 9. IKONOS Pansharpened, 321 composite (SpaceImaging).
Figure 10. Reconstructed image after coefficient reduction.
Figure 11. Edge map.
Figure 12. Edge map after morphological operations.
ASPRS 2007 Annual Conference Tampa, Florida May 7-11, 2007
Figure 13. IKONOS, band 4 (SpaceImaging).
Figure 14. Edge map after morphological operations.
CONCLUSIONS AND FUTURE WORK The two main advantages of wavelet analysis are that it is multiscale analysis and at the same time local analysis. An image can be decomposed into components containing information of different frequencies or in other words information of different scales without losing its location. Additionally, the method is really flexible as it provides the means to use different mother wavelets and also to construct a new one according to the application. These characteristics constitute the use of wavelet analysis in remote sensing and image processing an efficient method for denoising, image fusion, edge detection etc. More precisely wavelet analysis can be used in edge detection in high resolution satellite images where the notion of scale is really important. It was shown that the edge detection on the scale multiplication of wavelet analysis can be used in detecting the boundaries of buildings or road sides, avoiding the disturbance of detailed information such as small trees, cars and other small objects. The performance of the method can be improved by using more efficient wavelets for specific applications, or different schemes based on wavelet analysis like those using statistical properties of wavelet coefficients, to determine edges. Moreover, the new trends on improving wavelet analysis by taking into consideration the curvature of edges like curvelets and contourlets it seems also very promising. Contourlets, as they are designed to handle information of discrete two-dimensional signals like images, taking into consideration the directionality, perform well in high resolution satellite images in detecting linear features. Their performance in detecting roads and separating different kind of roads (main roads from rural ones) is really important. The results may be improved by using morphological structures to isolate the road network from other edges. Wavelet analysis may be used in different ways, as it was stated in chapter 3. Different wavelets can be used, new ones may be created. Finally, the information of different scales and the use of statistical or other methods may result in better detection. Thus, the possibilities of using wavelet analysis in edge detection by creating new schemes which would be more efficient for different application, are unlimited. This is really important for their performance in high resolution satellite images, where the classical methods do not perform well, and new ones are needed to handle the detailed information.
ACKNOWLEDGMENTS The project is co - funded by the European Social Fund (75%) and National Resources (25%) - Operational Program for Educational and Vocational Training II (EPEAEK II) and particularly the Program PYTHAGORAS.
REFERENCES Castelman R, 1995. Digital Image Processing, Prentice Hall, 2nd Edition, pp667. Do, M. (2001). Directional Multiresolution Image Representations. PhD thesis submitted to Swiss Federal Institute of Technology Lausanne (EPFL), pp208. Do, M. and Vetterli, M. (2003). Contourlets, Beyond Wavelets, G. V. Welland ed., Academic Press, 1-27. ASPRS 2007 Annual Conference Tampa, Florida May 7-11, 2007
Do, M. and Vetterli, M. (2005) The contourlet transform: an efficient directional multiresolution image representation, IEEE Transactions Image on Processing, 14(12): 2091-2106. Ducottet, C. Fournel, T. Barat, C. (2004). Scale-adaptive detection and local characterization of edges based on wavelet transform, in Signal Processing, 84: 2115-2137. Gonzales, R. Woods, R. Eddins, S. (2004). Digital Image Processing using Matlab, Pearson Education, pp.620. Hsieh, J.W., Ko, M.T. Liao, H.Y.M. and Fan, K.C. (1997). A New Wavelet-Based Edge Detector via Constrained Optimization, Image and Vision Computing, 15: 511-527. Liapis, S., Alvertos, N. and Tziritas, G. (1997). Maximum Likelihood Texture Classification and Bayesian Texture Segmentation Using Discrete Wavelet Frames, International Conference on Digital Signal Processing, 2: 1107-1110. Mallat, S. (1998). A Wavelet Tour of Signal Processing, Second edition, Academic Press, San Diego, pp637. Mallat, S.,and Zhong, S. (1992). Characterization of Signals from Multiscale Edges, IEEE Transaction on Pattern Analysis and Machine Intelligence, 14(7): 710-732. Zang, L., and Bao, P. (2002). Edge Detection by Scale Multiplication in Wavelet Domain, Pattern Recognition Letters, 23: 1774-1784. Shih, M. Tsehng, D. (2005). A wavelet-based multiresolution edge detection and tracking, Image and Vision Computing, 23: 441-451. Sun, J., Gu, D. Chen, Y. and Zhang, S. (2004). A Multiscale Edge Detection Algorithm Based on Wavelet Domain Vector Hidden Markov Tree Model, Pattern Recognition, Vol. 37, pp. 1315-1324. Contourlet Toolbox (February, 2007): http://www.ifp.uiuc.edu/~minhdo/software/ , www.mathworks.com/matlabcentral.
ASPRS 2007 Annual Conference Tampa, Florida May 7-11, 2007