TECHNICAL PAPER
ISSN 1047-3289 J. Air & Waste Manage. Assoc. 54:409 – 418 Copyright 2004 Air & Waste Management Association
Effect of Substrate Henry’s Constant on Biofilter Performance Xueqing Zhu, Makram T. Suidan, Amy Pruden, Chunping Yang, and Cristina Alonso Department of Civil and Environmental Engineering, University of Cincinnati, Cincinnati, Ohio Byung J. Kim U.S. Army Engineer Research and Development Center, Champaign, Illinois Byung R. Kim Physical and Environmental Sciences Department, Ford Research and Advanced Engineering, Dearborn, Michigan
ABSTRACT Butanol, ether, toluene, and hexane, which have Henry’s constants ranging from 0.0005 to 53, were used to investigate the effects of substrate solubility or availability on the removal of volatile organic compounds (VOCs) in trickle-bed biofilters. Results from this study suggest that, although removal of a VOC generally increases with a decrease in its Henry’s constant, an optimal Henry’s constant range for biofiltration may exist. For the treatment of VOCs with high Henry’s constant values, such as hexane and toluene, the transfer of VOCs between the vapor and liquid phases or between the vapor phase and the biofilm is a rate-determining step. However, oxygen (O2) transfer may become a rate-limiting step in treating VOCs with low Henry’s constants, such as butanol, especially at high organic loadings. The results demonstrated that in a gas-phase aerobic biofilter, nitrate can serve both as a growth-controlling nutrient and as an electron acceptor in a biofilm for the respiration of VOCs with low Henry’s constants. Microbial communities within the biofilters were examined using denaturing gradient gel
IMPLICATIONS The acceptance of biofiltration technology in the United States is still limited, in part because of a lack of fundamental information on the parameters that control the performance of the process. This study investigated the influence of a key parameter, substrate Henry’s constant, on biofilter performance through a long-term experiment. The results demonstrated that the removal of a VOC generally increases with a decrease in its Henry’s constant. However, O2 limitation reduced the removal efficiency for a VOC with low Henry’s constant. The study provided vital information for the successes of biofilter design and operation as well as a better understanding of the potential of this technology.
Volume 54 April 2004
electrophoresis to provide a more complete picture of the effect of O2 limitation and denitrification on biofilter performance. INTRODUCTION Biofiltration is fast becoming a promising air pollution control technology for the removal of volatile organic compounds (VOCs) from waste gas streams. However, acceptance of this technology in the United States is still limited because of a lack of fundamental information on the parameters that control the performance of the process. In a trickle-bed biofilter, a waste gas stream is purified by passing it through a biologically active medium along with an aqueous nutrient stream under aerobic conditions. As the waste gas moves through the biofilter, organic compounds diffuse into the attached biofilm surrounding the support medium and are oxidized into mineral end products (e.g., water [H2O] and carbon dioxide [CO2]) or are incorporated into new biomass. A key process involved in a gas-phase biofilter is the transport of VOCs from the gas phase to the aqueous phase. This process frequently is assumed to be related to vapor/liquid partition coefficients or Henry’s constants. Generally, it is accepted that biofilters are only suitable to remove VOCs with moderate to low Henry’s constants.1,2 Using a 48-hr test protocol for each compound, Deshusses and Johnson2 investigated biofilter elimination capacity for 18 VOCs with a wide range of Henry’s constants. They concluded that the biodegradation of VOCs in biofilters is influenced greatly by their availability or by the Henry’s constants. However, no long-term experimental studies of the effect of Henry’s constant on VOC removal efficiency in biofilters have been reported. Previous studies also suggested that the mass transfer of gas-phase substrates into a biofilm may not be limited by the aqueous phase Journal of the Air & Waste Management Association 409
Zhu et al. MATERIALS AND METHODS because transport of gas-phase compounds into the biofilm can occur directly through nonwetted areas.3– 6 Thus, Model VOCs, Seed Culture, and Nutrients the effect of Henry’s constants may not be as significant as Four model VOCs, isobutanol, toluene, n-hexane, and some theoretical simulations suggest.7,8 diethyl ether, were selected to study the effect of Henry’s Another important issue related to the effect of Henconstant on biofilter performance. Some of the major ry’s constant is oxygen (O2) limitation, which may occur physical properties of the selected compounds are listed in biofilters treating VOCs with low values of Henry’s in Table 1. These compounds cover a wide range of Henconstant (hydrophilic compounds) because of their more ry’s constants, while at the same time, they have similar favorable partitioning into water and biofilms. By varying diffusivities and are generally considered readily biodethe O2 content of the influent gas in biofilters treating gradable. As mentioned previously, biofilter performance two hydrophilic VOCs (acetone and propionaldehyde), 9 depends on both substrate availability and biodegradabilKirchner et al. found the diffusion of O2 in the biofilm to ity. To minimize the complication effect of biodegradabilbe rate-limiting. However, O2 limitation has not been ity, ideally, the same type of substrates with different observed commonly in biofiltration studies and opera4 Henry’s constants should be used for this study. Unfortutions. Zhu et al. found that increasing the O2 content in nately, substrates with similar molecular structures often the influent gas did not affect biofilter performance when treating diethyl ether. Similar results were obtained by have similar physical properties (e.g., Henry’s constant). Deshusses et al.10 when methyl ethyl ketone (MEK) and Therefore, a commonly used approach in studying submethyl isobutyl ketone (MIBK) were used as model VOCs. strate availability involves the selection of readily biodeBy examination of biofilm structure and O2 concentration gradable compounds (nonrecalcitrant chemicals) as in distribution along the depth of the biofilms using an O2 Deshusses and Johnson’s study,2 although the inherent microelectrode, Zhu et al.6 observed some high dissolved difference in substrate biodegradability for these VOCs O2 zones inside the biofilm, which suggested the exismay still play a role in the biofilter performance. Because tence of passages for the transport of O2 into the deeper ample data on biofilter performance for treating diethyl section of the biofilm in a gas-phase trickle-bed biofilter. ether have been collected from previous studies,3,4 this The lack of reports on O2 limitations in biofilters also was experiment was carried out only using the other three attributed to the lack of simple methods to identify and compounds (butanol, toluene, and hexane). The results demonstrate this phenomenon.11 on ether removal, however, are included in the discussion It should be noted that biofilter performance depends with respect to the effect of Henry’s constant. not only on the availability of VOCs but also on the A mixed culture taken from a local wastewater treatavailability of O2 and nutrient and on substrate biodement plant was used to seed the biofilters. The nutrient gradability. The objective of this study is to examine the solution contained all necessary macronutrients, microcorrelation between substrate availability or Henry’s connutrients, and buffers. The composition of the nutrient stant and biofilter performance through long-term experfeed, except for the concentration of nitrate (NO3⫺), was iments under various organic loadings and using VOCs described by Rihn et al.3 The concentration of NO3⫺ in covering a wide range of Henry’s constants. Implications the nutrient feed varied from 500 to 6000 mg N/L. It is of other limiting factors under various Henry’s constants noteworthy that the selection of NO3⫺ as the nutrient also will be discussed. Special attention is given to the nitrogen source is partly because of a lower biomass yield effect of Henry’s constant on the transfer of O2 in gasattributed to NO3⫺ over ammonia (NH3) as reported by phase biofilters, especially the potential of O2 limitation Smith et al.,14 and partly because it can be used as an in biofilters for treating hydrophilic compounds. indication of O2 limitation when denitrification occurs. Recently, nucleic acid-based molecular techniques have been used increasingly in environmental 12,13 research. These techniques can identify bacte- Table 1. Henry’s constants and other related physical properties for the selected VOCs. rial species by the unique sequence of molecDimensionless ular codes in their genes. One of the most Boiling Point Vapor Pressure Solubility Henry’s Constant useful methods for determining the structure (ⴗC) (mmHg at 20 ⴗC) (g/L at 20 ⴗC) (25 ⴗC) or diversity of bacterial communities is denaturing gradient gel electrophoresis (DGGE). In Isobutanol 107.9 10 95 0.0005 this study, DGGE technology was used to ex- Diethyl ether 35 442 69 0.034 amine microbial communities with the em- Toluene 110.8 22 0.52 0.29 phasis on determining the type and presence n-Hexane 68.7 120 0.013 53 of denitrifying organisms in the biofilters. 410 Journal of the Air & Waste Management Association
Volume 54 April 2004
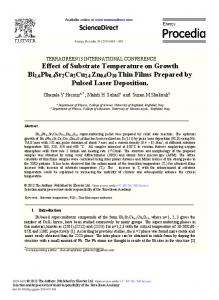
Zhu et al. EXPERIMENTAL APPARATUS The experimental system is shown in Figure 1. Three parallel trickle-bed biofilters, designated as butanol-fed column, toluene-fed column, and hexane-fed column, were utilized in this study. Each biofilter was constructed of seven circular glass sections with an i.d. of 76 mm and a total length of 130 cm. Each section was equipped with a sampling port that extended to the center of the column. The reactor was packed with 6-mm porous ceramic pellets (Celite R-635 Biocatalyst Carrier) to a depth of ⬃61 cm. The biofilters were housed in a constant temperature chamber. The temperature was maintained at 27 °C during this study. When in operation, the air supplied to the biofilters was purified with complete removal of H2O, oil, CO2, VOCs, and particles. After purification, the airflow to each biofilter was metered using mass flow controllers. Liquid VOC was injected via a syringe pump into the airstream, where it was vaporized as it entered the biofilter through the topmost port. The nutrient feed was delivered into each biofilter through a spray nozzle controlled by a timing device. The experimental chamber was equipped with two nutrient delivery systems; therefore, it had the capability to provide two separate nutrient feeds to the biofilters. All three biofilters were operated in a concurrent mode with air and nutrient flows directed downward. The biofilter apparatus also is equipped with a water and air backwash system for biomass growth control. The backwash system consists of three 20-L tanks. When in use, the two outside tanks are initially filled with 18 L (three column volumes) of nutrient solution. The water from the clean water supply tank is passed upward through the column, achieving full fluidization. Compressed air is introduced if necessary to help break up and scour the media. The water then is allowed to recycle for
Figure 1. The trickle-bed biofilter system. Volume 54 April 2004
a period of time (1 hr throughout this study). Finally, the recycle is shut off, and 18 L of clean water is passed through the column as a rinse. In this study, backwashing frequencies varied from 0.5 to 2 times per week depending on the organic loadings. Chemical Analysis The VOC concentrations in the gas phase were measured by a gas chromatograph (GC; HP 5890, Series II, HewlettPackard) equipped with a flame-ionization detector (FID; Hewlett-Packard). Separation was done using a 2-mm-ID, 1.83-m glass column packed with 5% Carbowax on a 60/80 Carbopack B-DA (Supelco, Inc.). Injection volume was 0.5 mL. Critical measurements for the liquid phase included the concentrations of VOCs, NO3⫺, and volatile suspended solid (VSS). Concentration of VOCs in the liquid effluent was measured using the same GC-FID technique as used for VOCs in the gas phase except for an injection volume of 1 L. NO3⫺ concentrations were measured using a diode array spectrophotometer (HP8452, Hewlett-Packard). VSS analysis in the backwash water was performed according to Method 2540 E of the Standard Methods.15 DGGE Analysis Microbial community structure in different biofilters was profiled using DGGE. Samples of biofilm were taken from each biofilter upon completion of this study. DNA extractions were done in duplicate on each biofilter using a FastDNA and a FastPrep sample homogenizer kit provided by Bio101. Polymerase chain reaction (PCR) was used to amplify a 192-base pair portion of the V3 region of the 16S rDNA. Primers 534R (E. coli numbering system) and 341F (containing a GC clamp), described in Chang et al.,16 were selected based on their higher sensitivity and the superior ability of the resultant product to be resolved on a DGGE gel when compared with other universal primers. One drawback to this primer choice is that the targeted sequence is very short and, therefore, does not contain the most robust phylogenetic information. Shorter PCR products, however, are less likely to lead to the formation of undesirable chimeras.17 Primers were synthesized by Stratagene, Inc. PCR reactions were carried out in 25-mL volume using 1.25 units of Expand Hi Fidelity DNA polymerase (Roche) with a temperature program of 93 °C—2 min (initial denaturing), followed by 35 cycles of 92 °C—1 min, 55 °C—1 min, 68 °C— 45 sec, followed by 72 °C—2 min (final extension). DGGE was performed to separate the PCR products using a D-Code 16/16-cm acrylamide gel system (BioRad). Gradient was formed between 15 and 55% denaturant (100% denaturant defined as 7 M urea plus 40% Journal of the Air & Waste Management Association 411
Zhu et al. vol/vol formamide). The PCR products were loaded onto the DGGE gel, and a charge of 35 V was run across the gel for 20 hr. The buffer, which consisted of 0.5 ⫻ TAE (20 mM Tris-acetate, 0.5 mM EDTA, pH 8.0), was maintained at a constant temperature of 60 °C. The central 1-mm2 portions of the bands of interest were excised with razor blades re-amplified using the same primer and conditions, and the products were purified using Gene Clean Spin columns (Bio-101) for DNA sequencing, which was done off-site by Davis Sequencing using an ABI Prism 377 DNA Sequencer (Perkin-Elmer). Sequences were screened for chimeric origin by use of the RDP CHECK CHIMERA program.18 Also, because of the presence of multiple PCR products migrating to the same point in the DGGE gel, not all DGGE bands generated high-quality sequence data. Illegible sequence data were discarded. Sequences were compared with the organisms in the Ribosomal Database Project using the Sequence Match tool, and reference sequences from the most similar organisms thus were obtained for subsequent phylogenetic comparison.18 Sequences were aligned using ClustalX followed by manual adjustment.19 A phylogenetic tree was constructed using maximum likelihood analysis as implemented by Paup* version 4.0b8 (Sinauer Associates, Inc.). Bootstrap values were determined using the same program with 50 replicates. Henry’s Constant and Oxygen Limitation Under aerobic conditions, O2 serves as the primary electron acceptor for VOC oxidation and biomass growth. Williamson and McCarty proposed a relationship for determining whether the reaction within a biofilm is fluxlimited by a substrate or by O2.20,21 The O2 limitation within the biofilm will occur if
Cs ⬎
D o v s MW s C D s v o MW o o
(1)
where Co and Cs are concentrations of O2 and substrate in the liquid film or at the biofilm surface, Do and Ds are the diffusion coefficients of O2 and substrate in liquid phase or in the biofilms, vo and vs are the stoichiometric reaction coefficients, and MWo and MWs are molecular weights of O2 and the substrate. Assuming Henry’s law applies at the liquid-gas interface and under ideal gas conditions, this criterion for O2 limitation within the biofilm in a gasphase biofilter can be related to Henry’s constant as
ps ⬎
10 3 D w,o v s RT C w,o H D w,s v o MW o
(2)
where ps is the VOC partial pressure in the gas phase (ppmv), Cw,o is the O2 concentration in the liquid film or 412 Journal of the Air & Waste Management Association
at the biofilm surface (mg/L), Dw,o and Dw,s are the diffusion coefficients of O2 and the VOC substrate in the liquid phase or in the biofilms, H is the dimensionless Henry’s constant of the VOC substrate, R is the ideal gas law constant (0.082 atm L/mol K), and T is absolute temperature (K). This criterion was used in this study to assess the possibility of O2 limitation in trickle-bed biofilters and to help in understanding the experimental results. RESULTS AND DISCUSSION VOC Removal Efficiency Considering the likely influence of organic loadings, the effect of Henry’s constant on biofilter performance was examined under a series of organic loading rates. The overall performance of the three biofilters with respect to VOC removal is shown in Figure 2. All three trickle-bed biofilters were started up concurrently using an empty bed retention time of 25 sec, inlet gas flow rates of 6 L/min, nutrient liquid flow rates of 1 L/day, influent NO3⫺ concentration of 500 mg N/L, and a VOC injection rate of 0.1 mL/hr, resulting in influent VOC loading rates of ⬃2 kg COD/m3-day or 32, 35, and 27 g VOC/m3 hr for the butanol-, toluene-, and hexane-fed columns, respectively. The results revealed that the VOC removal efficiency increased with decreasing values of Henry’s constants or increases in VOC solubility. The average removal efficienciesobservedforthebutanol-,toluene-,andhexanefed columns were 99.8, 86.5, and 38.4%, respectively. On day 99 of operation, the VOC injection rate was doubled to 0.2 mL/hr, increasing the VOC loading rate to ⬃4 kg COD/m3-day or 65, 69, and 53 g VOC/m3 hr for the butanol-, toluene-, and hexane-fed columns, respectively. The influent NO3⫺ concentration also was increased to 1000 mg/L. The butanol removal efficiency remained above 97% while removal efficiencies for toluene and hexane decreased significantly. When the VOC loading rate was doubled further on day 203, however, a dramatic drop in the butanol removal efficiency from 98 to 64% was observed. This deterioration in performance was found to be caused by limitations in NO3⫺ availability caused by the occurrence of denitrification in the biofilm, which can be explained by the calculation of NO3⫺ consumption within the biofilter. NO3⫺ can serve as either a growth-controlling nutrient or an electron acceptor when O2 is limited. The NO3⫺ consumption for biomass growth can be calculated through the determination of biomass yield. In this study, excess biomass was removed through periodic biofilter backwashing. Assuming no net biomass accumulation within the biofilter, the net biomass yield during this period was ⬃0.045 g VSS/g COD based on measurement Volume 54 April 2004
Zhu et al.
Figure 2. The overall biofilter performance with respect to butanol, toluene, and hexane removal.
of biomass loss in the effluent liquid and in the backwash water. Therefore, the NO3⫺ consumption for biomass growth was calculated at 81 mg N/L, assuming that nitrogen makes up 14% of the biomass. However, the effluent NO3⫺ concentration was below 1 mg N/L with an influent NO3⫺ concentration of 1000 mg N/L, suggesting that denitrification was occurring in this column. To overcome NO3⫺ limitation, the NO3⫺ concentration in the nutrient feed was further increased to 2000 mg/L on day 216 of operation. The butanol removal efficiency increased from 64 to 70%. But the effluent NO3⫺ concentration, on average, still dropped to 59 mg/L. A further increase in the concentration of NO3⫺ became
necessary. At the same time, VOC removal decreased in the toluene- and hexane-fed columns when the influent NO3⫺ was raised to 2000 mg/L. Unlike in the butanol-fed column, no significant denitrification was observed within the toluene- and hexane-fed biofilters. Because nutrient demands for biomass growth were less than 100 mg N/day (Table 2), the effluent NO3⫺ concentrations within the toluene and hexane columns remained close to 2000 mg N/L. This drop in performance suggests that inhibition may have occurred at high NO3⫺ concentrations within these two biofilters. Similar inhibitory effects were observed in a previous study where ether was used as a substrate.4
Table 2. Summary of NO3⫺ consumption. Influent VOC Loading kg COD/m3 day
g VOC/m3 hr
Butanol column
2 4 8b
32 65
500 1000
384 961
32 62
Toluene column
2.3 4.6 9.2 2.2 4.5 9
130 35 69 138 27 53 106
1000–6000 500 1000 500 500 1000 500
1000–4615 68 122 89 35 67 50
81–116 52 69 62 21 22 20
Hexane column
Total Nitrate Consumption (mg N/day)
Estimated Usage for Biomass Growtha
Influent Nitrate (mg N/day)
(mg N/day)
a
Based on measurement of biomass loss (VSS analysis) in the effluent liquid and the backwash water, and assuming that there will be no net biomass accumulation within the biofilter and that nitrogen makes up 14% of the biomass; bSee Figure 4 for the details of the NO3⫺ balance at this loading. Volume 54 April 2004
Journal of the Air & Waste Management Association 413
Zhu et al. On day 231, two nutrient feed systems were utilized to provide flexible control of nutrient supplies for the butanol-fed column and the other two columns. The influent NO3⫺ concentration was increased further to 3000 mg N/L for the butanol-fed column and decreased to 500 mg N/L for the toluene- and hexane-fed columns. It can be seen from Figure 2 that the butanol removal efficiency increased immediately from 70% to over 90% corresponding to the increase in the influent NO3⫺ concentration. The effluent NO3⫺ concentration in this reactor was 289 mg N/L on average, suggesting the increase in the influent NO3⫺ concentration was necessary to provide sufficient NO3⫺ as both a nutrient and an electron acceptor. At the same time, after the influent NO3⫺ concentrations were reduced to 500 mg N/L, the performance in the tolueneand hexane-fed columns were stabilized or recovered. After day 270, however, the butanol removal efficiency gradually decreased, and the trend did not stop even after the influent NO3⫺ concentrated was increased further to 4000 mg N/L on day 288 and 6000 mg N/L on day 351. Nutrient analysis results suggested that there was a culture change and denitrifiers were accumulating in the biofilm during this period (for details analysis, see next section). The denitrification observed in the butanol-fed biofilter can be attributed to the extremely low Henry’s constant of butanol, which led to a high butanol concentration in the aqueous phase and the biofilm, resulting in O2 limitation in the biofilm. Further discussion with respect to O2 limitation and denitrification is presented later in this paper using both microbial and theoretical analysis. The effect of influent organic loading on the VOC removal rate under a constant gas flow rate for selected VOCs is summarized and illustrated in Figure 3. The performance of the biofilter in treating ether under identical experimental conditions as this study also is included
Figure 3. Effect of influent organic loading and Henry’s constant on the VOC removal. 414 Journal of the Air & Waste Management Association
here as summarized from the results of previous studies.4 It can be seen that the VOC removal efficiency generally increases with decreases in substrate’s Henry’s constant throughout the loading range of 2–9 kg COD/m3 day. The influent of organic loadings on biofilter performance also varied for different VOCs and seemed to be related more particularly to the substrate Henry’s constant. In the case of hexane with a Henry’s constant of 53, increasing the influent loading and concentration did not affect the removal rate. The VOC removal rate remained at nearly 0.9 kg COD/m3 day. For toluene, which has a Henry’s constant value of 0.29, the removal rate increased slightly with increasing loading rate. As for ether, which has a Henry’s constant value of 0.034, its removal rate increased proportionally with the increase in the influent loading. In the case of butanol, which has the lowest Henry’s constant among the four VOCs, the removal rate initially increased proportionally with increases in the influent loading rate; however, the removal efficiency was not as high or as stable as that observed for ether under high loading rates. These results demonstrate that biofilter performance depends not only on the availability of VOCs but also on other limiting factors such as substrate biodegradability and O2 availability. However, the effects of these limiting factors also are related to substrate Henry’s constants. For example, the transfer of VOCs between the vapor and liquid phases or between the vapor phase and the biofilm is a rate-determining step for the treatment of VOCs with high Henry’s constants, such as hexane and toluene. The biodegradation step seems to be more important for treating substrates with low Henry’s constants, such as ether and butanol. However, O2 transfer may become a rate-limiting step in treating VOCs with extremely low Henry’s constant, such as butanol, especially at high organic loadings. The results of this study also suggested that an optimal Henry’s constant range for use of biofiltration might exist. Denitrification in an Aerobic Biofilter Although there have been reports of denitrification in trickle-bed biofilters for wastewater treatment, denitrification rarely has been observed in gas-phase biofilters. This is in part because the greater external resistance for O2 transfer in wastewater biofilm systems than in gas-phase systems.6 Du Plessis et al.22 did find reduction of nitric oxide (NO) to nitrous oxide (N2O) in an aerobic biofilter fed with a mixture of toluene and NO. However, no significant NO3⫺ reduction was observed in their study and toluene was not considered as carbon source for the denitrification of NO. Actually, nitrification was found when NO3⫺ was replaced with NH3 in the nutrient feed, suggesting that O2 limitation was not significant in their Volume 54 April 2004
Zhu et al. system because of a relatively high Henry’s constant for toluene. To our knowledge, this study demonstrates for the first time that in a gas-phase aerobic biofilter, NO3⫺ can serve as a major electron acceptor responsible for the degradation of significant, if not most, portion of a treated VOC. A NO3⫺ balance on the three biofilters is shown in Table 2. These data suggest that the amount of NO3⫺ utilized for biomass growth was reasonably close to the total NO3⫺ consumed in the toluene- and hexane-fed columns. NO3⫺ also was observed to only serve as a growth nutrient when ether was used as a substrate.4 However, in the butanol-fed column, the total NO3⫺ consumption was at least 10 times greater than the mass needed for biomass growth throughout this study, suggesting that denitrification was occurring in this reactor. Figure 4a presents a balance on nitrogen for the butanolfed column for a VOC loading of 8 kg COD/m3 day. During this period (days 203– 440), the total NO3⫺ consumption varied from 1000 to 4615 mg N/day and the amount of NO3⫺ used for biomass growth was only between 81 and 116 mg N/day, suggesting that most of the NO3⫺ was consumed as an electron acceptor. Based on this nitrogen balance and a stoichiometric relationship,
Figure 4. Influence of denitrification on butanol removal at the organic loading of 8 kg COD/m3 day. Volume 54 April 2004
the amount of butanol removed through both denitrification and aerobic degradation can be estimated and is illustrated in Figure 4b. It can be seen that with the increase of the influent NO3⫺ concentration, butanol removal through denitrification increased steadily throughout this period. When the influent NO3⫺ concentration was varied from 1000 to 3000 mg N/L, butanol removal through aerobic degradation remained relatively stable at ⬃50%, resulting in an increase in average butanol removal from 64 to 91%. After the influent NO3⫺ concentration was increased to above 3000 mg N/L, butanol removal that is attributable to aerobic degradation started to decrease. When the influent NO3⫺ concentration was 6000 mg N/L, only ⬃5% of the butanol was removal via aerobic respiration and over 92% of the total removal can be attributed to denitrification. This result suggested that there was a gradual culture change, and denitrifiers were accumulating during this period. By increasing the NO3⫺ concentration, more electron acceptors were provided for denitrifiers. Furthermore, the elevated influent NO3⫺ concentration also may have been inhibitory to some of the aerobic microorganisms. On the other hand, the butanol removal efficiency may have been much lower if no excess NO3⫺ was provided because the maximum butanol removal through aerobic degradation was only ⬃50% even before the culture change when the influent NO3⫺ was still at lower levels (see Figure 4b). The extremely low Henry’s constant for butanol appears to be a determining factor that resulted in O2 limitations within the biofilm and led to denitrification when NO3⫺ was available. In practice, the impact of O2 limitation may be overcome by reducing the organic loading. The results also suggest that an optimal NO3⫺ concentration may exist for achieving maximum VOC removal although more study is still required to quantify this criterion. Microbial Community Structure To better interpret the experimental data, the microbial community structure within the biofilm was examined at the end of the study using DGGE. Emphasis was placed on determining the type and presence of denitrifying organisms in these biofilters. Unpublished DGGE results from a previous study using ether as a substrate also are included here for comparison with the other three cultures. Figure 5 shows a phylogenetic comparison of the DGGE bands, which were successfully sequenced and screened for chimeras. Each biofilter produced a different DGGE banding pattern, indicating the different microbial structure of the communities. Phylogenetic analysis revealed a diverse distribution of band identity for all cultures, with the exception of the butanol culture, in which Journal of the Air & Waste Management Association 415
Zhu et al.
Figure 5. Neighbor-joining phylogenetic analysis with Jukes-Cantor correction factor of DGGE bands from the four biofilters. Bands are named as indicated in the figure. Bootstrap support based on 1000 replicates is shown for major nodes. GenBank accession numbers mark the sequences described in this study. Brackets indicate the major bacterial divisions identified: F-B-C is the abbreviation for FlexibacterBacterioides-Cytophaga division of bacteria.
all bands were closely related and clustered together (see Figure 5). It is important to keep in mind that denitrifiers do not exist as a monophyletic lineage, but many phylogenetically distinct groups are known. Within the tree shown in Figure 5, Pseudomonas, Halomonas, Paracoccus, and Burkholderia are all well-characterized denitrifyers.23–27 While all four biofilter communities contained microorganisms associated with known denitrifying organisms, the butanol culture was the only one in which all organisms identified were found to be clustered together with a high degree of association to one particular genus of denitrifiers. Nine out of 10 of the butanol DGGE bands were sequenced, and of these, all nine showed high similarity with Halomonas (77–92% similarity; see Figure 5). The abundance of these salt-tolerant organisms is consistent with the moderately halophilic environment that developed as a result of increased NO3⫺ addition to this column. Halomonas are capable of using O2, NO3⫺, and nitrite as electron acceptors. They also have high tolerance to saline environments (0.2–25% NaCl) and are white to yellow in color.23,24 These characteristics are all consistent with the conditions within the butanol-fed 416 Journal of the Air & Waste Management Association
column as well as with the morphology of the biomass observed in this column. This supports the conclusion that the dramatic consumption rate of NO3⫺ in that biofilter was indeed caused by the denitrification of NO3⫺ by these halophilic denitrifiers. Denitrification by Halomonas under microaerophilic to moderately aerobic conditions is not well documented, but this study gives strong evidence that these microorganisms are indeed capable of such metabolism. The beneficial characteristics of Halomonas, such as wide pH tolerance, and broad carbon utilization range, in addition to efficiency in denitrification, make them ideal candidates for application in biofilters as well as in other treatment processes.23 Worthy of note are two bands from the toluene-fed column showing 93–94% similarity to the genus Paracoccus, which are particularly well-characterized for their denitrifying abilities.25 These bands showed very high similarity to the strain Paracoccus denitrificans. This organism and its close relatives are the only known organisms capable of using NO3, nitrogen dioxide, or NO as an electron acceptor under autotrophic conditions. Paracoccus are facultative heterotrophs and can survive on hydrogen, methane, various reduced sulfur-containing compounds, as well as various sole carbon sources. However, Paracoccus are known to be capable of denitrification under only anaerobic conditions, not microaerophilic conditions.25,26 While all biofilters contained organisms related to denitrifiers, the fact that no evidence of denitrification was observed in the three biofilters with the highest Henry’s constants is attributable to lack of O2 limitation in those reactors. O2 limitation, in addition to high salt concentration in the butanol biofilter, most likely fostered the development of a distinct community efficient in denitrification. Henry’s Constant and O2 Limitation It can be seen from eq 2 that the occurrence of O2 limitation in a gas-phase biofilter is directly related to the value of Henry’s constant of the VOCs being treated. The values of threshold VOC concentrations, or the lowest VOC partial pressure in the air that leads to O2 limitation, for the four VOCs are listed in Table 3. The diffusivities of the VOCs and O2 in water were calculated using the Wilke-Chang equation. Throughout this study, the influent concentrations for the four VOCs were in a range of 50 –300 ppmv. Because the partial pressures for toluene and hexane were never greater than 461 and 89,500 ppmv, respectively, O2 limitation was never a problem for treating these two compounds. However, the concentration of butanol in the gas phase was always 2 orders of magnitude greater than 1.2 ppmv, which explains why O2 Volume 54 April 2004
Zhu et al. Table 3. Estimated threshold VOC concentrations for O2 limitation.
H Dw,o (cm2/sec) Dw,s (cm2/sec) vo
Butanol
Ether
Toluene
Hexane
0.0005 2.1E-5 9E-6
0.034 2.1E-5 9E-6
0.29 2.1E-5 1E-5
53 2.1E-5 8E-6
6 1 7.95 1.2
6 1 7.95 81
8 1 7.95 461
9.5 1 7.95 89,500
vs Cw,o (27 °C) pi,critical (ppmv)
became a limiting factor in this column. In the case of the ether-fed biofilter, although the influent ether concentration was greater than 81 ppmv most of the time, no O2 limitation was observed.4 This may be because the difference between the influent concentration and the threshold concentration for ether was much less significant (less than 1 order of magnitude) than that for butanol (2 orders of magnitude). It should be noted that the calculation in this section might not give a comprehensive evaluation of O2 limitation within the biofilm and along the biofilters. Because influent concentrations were used for this evaluation, it will reflect most accurately the situation at the inlets of the biofilters. Substrate, not O2, concentrations will decrease significantly because of biodegradation along the biofilters, making O2 limitation less likely to occur towards the outlets. However, it does provide a good understanding in regard to the trend and the relationship between substrate Henry’s constant and O2 limitation in trickle-bed biofilters. Biofiltration technology typically is applied for treating air steams containing VOCs in the concentration range of 50 –500 ppmv. Using eq 2 and typical values of Dws at 1 ⫻ 10⫺5 cm2/sec and vo at 8, it also can be calculated that typical O2 limitation will never occur for treating VOCs with H values greater than 0.3, and that O2 can become flux-limiting when treating VOCs with H values less than 0.03 in the above concentration range. For VOCs with H values between 0.03 and 0.3, whether O2 limitation will occur depends on the VOC concentration and other factors, such as medium types and biofilm structure. In future studies where VOCs with low Henry’s constants are treated, more attention should be given to O2 limitation and the denitrification processes. CONCLUSIONS A long-term experimental study was conducted that investigated the effects of substrate availability or their Henry’s constants on VOC removal in trickle-bed biofilters. Results from this study suggest that although removal of a VOC generally increases with a decrease in its Henry’s Volume 54 April 2004
constant, an optimal Henry’s constant range for biofiltration may exist. For the treatment of VOCs with high Henry’s constant values, such as hexane and toluene, the transfer of VOCs between the vapor and liquid phases or between the vapor phase and biofilm is a rate-determining step. However, O2 transfer may become a rate-limiting step in treating VOCs with low Henry’s constant, such as butanol, especially at high organic loadings. The results also showed that with the increase in influent VOC loading, VOC elimination capacity increased proportionally for the butanol-fed column when O2 limitation was not dominant. And the VOC elimination capacity increased slightly for the toluene-fed column and exhibited little change for the hexane-fed column, suggesting the mass transfer of VOC between vapor and liquid or between vapor and biofilm was a rate-determining step for the treatment of VOCs with high Henry’s constants, like toluene and hexane, but not for VOCs with low Henry’s constants, like butanol and ether. The results demonstrated that in a gas-phase aerobic biofilter, NO3⫺ can serve both as a growth-controlling nutrient and as an electron acceptor in a biofilm for the respiration of VOCs with low Henry’s constants. Microbial communities within the biofilters were examined using DGGE to provide a more complete picture of the effect of O2 limitation and denitrification on biofilter performance. ACKNOWLEDGMENTS This research was sponsored by a grant from the U.S. Army Construction Engineering Research Laboratory and by the Ford Motor Co. REFERENCES 1. De Header, B.; Overmeire, A.; Van Langenhove, H.; Verstraete, W. Ethene Removal from a Synthetic Waste Gas Using a Dry Biobed; Biotechnol. Bioeng. 1994, 44, 642-648. 2. Deshusses, M.A.; Johnson, C.T. Development and Validation of a Simple Protocol to Rapidly Determine the Performance of Biofilters for VOC Treatment; Environ. Sci. Technol. 2000, 34, 461-467. 3. Rihn, M.J.; Zhu, X.; Suidan, M.T.; Kim, B.J.; Kim, B.R. The Effect of Nitrate on VOC Removal in Trickle Bed Biofilters; Water Res. 1997, 31 (12), 2997-3008. 4. Zhu, X.; Rihn, M.J.; Suidan, M.T.; Kim, B.J.; Kim, B.R. Role of Nitrate in Trickle Bed Biofilters: Nutrient or Electron Acceptor. In Proceedings of the 69th Annual WEF Conference and Exposition, Dallas, TX, 1996. 5. Zhu, X.; Alonso, C.M.T. Suidan; Cao, H.; Kim, B.J.; Kim, R.J. The Effect of Liquid Phase on VOC Removal in Trickle-Bed Biofilters; Water Sci. Technol. 1998, 38 (3), 315-322. 6. Zhu, X.; Suidan, M.T.; Alonso, C.; Yu, T.; Kim, B.J., Kim, B.R. Biofilm Structure and Mass Transfer in a Gas Phase Trickle-Bed Biofilter; Water Sci. Technol. 2001, 43 (1), 285-293. 7. Alonso, C.; Suidan, M.T.; Kim, B.R.; Kim, B.J. Dynamic Mathematical Model for the Biodegradation of VOCs in a Biofilter: Biomass Accumulation Study; Environ. Sci. Technol. 1998, 32, 3118-3123. 8. Ockeloen, H.F.; Overcamp, T.J.; Grady, C.P.L., Jr. Engineering Model for Fixed Film Bioscrubbers; J. Environ. Eng. 1996, 122 (3), 191-197. 9. Kirchner, K.; Wagner, S.; Rehm, H.J. Exhaust Gas Purification Using Biocatalysts (Fixed Bacteria Monocultures)—The Influence of Biofilm Diffusion Rate (O2) on the Overall Reaction Rate; Appl. Microbiol. Biotechnol. 1992, 37, 277-279. 10. Deshusses, M.A.; Hamer, G.; Dunn, I.J. Transient-State Behaviour of a Biofilter Removing Mixtures of Vapours of MEK and MIBK from Air; Biotechnol. Bioeng. 1996, 49 (5), 587-598. Journal of the Air & Waste Management Association 417
Zhu et al. 11. Devinny, J.S.; Deshusses, M.A.; Webster, T.S. Biofiltration for Air Pollution Control; Lewis: Boca Raton, FL, 1999; pp 68-71. 12. Yaws, C.L. Chemical Properties Handbook: Physical, Thermodynamic, Environmental, Transport, Safety, and Related Properties for Organic and Inorganic Chemicals; McGraw-Hill: New York, 1999. 13. Verschueren, K. Handbook of Environmental Data on Organic Chemicals, 3rd ed.; Van Nostrand Reinhold: New York, 1999. 14. Smith, F.L.; Sorial, G.A.; Suidan, M.T.; Breen, A.W.; Biswas, P. Development of Two Biomass Control Strategies for Extended, Stable Operation of Highly Efficient Biofilters with High Toluene Loadings; Environ. Sci. Technol. 1996, 30, 1744-1751. 15. Standard Methods for the Examination of Water and Wastewater, 18th ed.; American Public Health Association: Washington, DC, 1992. 16. Chang, Y.-J.; Stephen, J.R.; Richter, A.P.; Venosa, A.D.; Bru ¨ ggemann, J.; Macnaughton, S.J.; Kowalchuk, G.A.; Haines, J.R.; Kline, E.; White, D.C. Phylogenetic Analysis of Aerobic Freshwater and Marine Enrichment Cultures Efficient in Hydrocarbon Degradation: Effect of Profiling Method; J. Microbiol. Meth. 2000, 40, 19-31. 17. Wang, G.C.-Y.; Wang, Y. The Frequency of Chimeric Molecules as a Consequence of PCR Co-Amplification of 16S rRNA Genes from Different Bacterial Species; Microbiology 1996, 142, 1107-1114. 18. Maidak, B.L.; Cole, J.R.; Lilburn, T.G.; Parker, C.T., Jr.; Saxman, P.R.; Farris, R.J.; Garrity, G.M.; Olsen, G.J.; Schmidt, T.M.; Tiedje, J.M. The RDP-II (Ribosomal Database Project); Nucl. Acids Res. 2001, 29, 173174. 19. Thompson, J.D.; Gibson, T.J.; Plewniak, F.; Jeanmougin, F.; Higgins, D.G. The CLUSTAL_X Windows Interface: Flexible Strategies for Multiple Sequence Alignment Aided by Quality Analysis Tools; Nucl. Acid Res. 1997, 24, 4876-4882. 20. Williamson, K.; McCarty, P.L.A. Model of Substrate Utilization by Bacterial Films; J.—Water Pollut. Control Fed. 1976, 48, 9-24. 21. Williamson, K.; McCarty, P.L. Verification Studies of the Biofilm Model for Bacterial Substrate Utilization; J.—Water Pollut. Control Fed. 1976, 48, 281-296. 22. Du Plessis, C.A.; Kinney, K.A.; Schroeder, E.D.; Chang, D.P.Y.; Scow, K.M. Denitrification and Nitric Oxide Reduction in an Aerobic Toluene-Treating Biofilter; Biotechnol. Bioeng. 1998, 58, 408-415. 23. Mormile, M.R.; Romine, M.R.; Garcia, M.T.; Ventosa, A.; Bailey, T.J.; Peyton, B.M. Halomonas campisalis sp. nov., a Denitrifying, Moderately Haloalkaliphilic Bacterium; System. Appl. Microbiol. 1999, 22, 551-558. 24. Vreeland, R.H. The Family Halomonadaceae. In The Prokaryotes; Balows, A., Tru ¨ per, H.G., Dworkin, M., Harder, W., Schleifer, K.H., Eds.; Springer: New York, 1992; pp 3181-3188.
418 Journal of the Air & Waste Management Association
25. Aragno, M.; Schlegel, H.G. The Mesophillic Hydrogen-Oxidizing (Knallgas) Bacteria. In The Prokaryotes; Balows, A., Tru ¨ per, H.G., Dworkin, M., Harder, W., Schleifer, K.H., Eds.; Springer: New York, 1992; pp 344-384. 26. Robertson, L.A.; Cornelisse, R.; De Vos, P.; Hadioetomo, R.; Kuenen, J.G. Aerobic Denitrification in Various Heterotrophic Nitrifiers; Antonie van Leeuwenhoek 1989, 56, 289-299. 27. Degraffenreid, N.; Shreve, G.S. The Effect of Cadmium on the Kinetics of Trichloroethylene Biodegradation by Pseudomonas (burkolderia) picketti PK01 under Denitrifying Conditions; Water Res. 1998, 32, 33983402.
About the Authors Xueqing Zhu is a research associate in the Department of Civil and Environmental Engineering at the University of Cincinnati in Cincinnati, OH. Makram T. Suidan is a Herman Schneider Professor of Environmental Engineering in the Department of Civil and Environmental Engineering at the University of Cincinnati. Amy Pruden, Chunping Yang, and Cristina Alonso were Ph.D. students in the Department of Civil and Environmental Engineering at the University of Cincinnati. Byung J. Kim is a principal investigator at the U.S. Army Engineer Research and Development Center in Champaign, IL. Byung R. Kim is a senior research engineer in the Physical and Environmental Sciences Department of Ford Research and Advanced Engineering in Dearborn, MI. Address correspondence to: Makram T. Suidan, Department of Civil and Environmental Engineering, University of Cincinnati, Cincinnati, OH 45221; e-mail: makram.
[email protected].
Volume 54 April 2004