Notice: This manuscript has been authored by UT-Battelle, LLC, under Contract No. DE-AC0500OR22725 with the U.S. Department of Energy. The United States Government retains and the publisher, by accepting the article for publication, acknowledges that the United States Government retains a non-exclusive, paid-up, irrevocable, world-wide license to publish or reproduce the published form of this manuscript, or allow others to do so, for the United States Government purposes. The Department of Energy will provide public access to these results of federally sponsored research in accordance with the DOE Public Access Plan (http://energy.gov/downloads/doe-public-access-plan).
To be submitted to Phys. Rev. B
Effect of surface ionic screening on polarization reversal scenario in ferroelectric thin films: crossover from ferroionic to antiferroionic states Anna N. Morozovska1,2 *, Eugene A. Eliseev3, Anatolii I. Kurchak4, Nicholas V. Morozovsky1, Rama K. Vasudevan5, Maksym V. Strikha4,6, and Sergei V. Kalinin5 † 1
Institute of Physics, National Academy of Sciences of Ukraine, pr. Nauky 46, 03028 Kyiv, Ukraine
2
Bogolyubov Institute for Theoretical Physics, National Academy of Sciences of Ukraine, 14-b Metrolohichna str. 03680 Kyiv, Ukraine
3
Institute for Problems of Materials Science, National Academy of Sciences of Ukraine, Krjijanovskogo 3, 03142 Kyiv, Ukraine 4
V.Lashkariov Institute of Semiconductor Physics, National Academy of Sciences of Ukraine, pr. Nauky 41, 03028 Kyiv, Ukraine 5
The Center for Nanophase Materials Sciences, Oak Ridge National Laboratory, Oak Ridge, TN 37831 6
Taras Shevchenko Kyiv National University, Radiophysical Faculty pr. Akademika Hlushkova 4g, 03022 Kyiv, Ukraine Abstract
Nonlinear electrostatic interaction between the surface ions of electrochemical nature and ferroelectric dipoles gives rise to the coupled ferroionic states in nanoscale ferroelectrics. Here, we investigated the role of the surface ions formation energy value on the polarization states and polarization reversal mechanisms, domain structure and corresponding phase diagrams of ferroelectric thin films. Using 3D finite elements modeling we analyze the distribution and hysteresis loops of ferroelectric polarization and ionic charge, and dynamics of the domain states. These calculations performed over large parameter space delineate the regions of single- and poly- domain ferroelectric, ferroionic, antiferroionic and non-ferroelectric states as a function of surface ions formation energy, film thickness, applied voltage and temperature. We further map the analytical theory for 1D system onto effective Landau-Ginzburg free energy and establish the correspondence between the 3D numerical and 1D analytical results. This approach allows performing the overview of the phase diagrams of ferroionic systems and exploring the specific of switching and domain evolution phenomena.
* †
corresponding author, e-mail:
[email protected] corresponding author, e-mail:
[email protected]
1
I. INTRODUCTION Ferroelectric phase stability requires effective screening of the polarization bound charge at surfaces and interfaces with non-zero normal component of polarization [1, 2, 3]. Traditionally, the theoretical analysis of bulk ferroelectric state assumes either complete screening of polarization by (effective) electrodes, or considers the emergence of the multidomain states as a pathway to minimize depolarization energy [1-3]. Rapid growth of thin-film applications of ferroelectrics in 90ies necessitated analysis of the microscopic mechanisms active at ferroelectric interfaces, preponderantly effects stemming from non-zero space separation between polarization and screening charges [4, 5, 6, 7, 8]. These effects are often introduced via the dead layer [2] or physical gap [9] concepts, postulating the presence of the thin non-ferroelectric layer or gap separating ferroelectric and metal and have been shown to agree with ab initio calculations [10, 11]. Because of the long-range nature of the depolarization effects the incomplete surface screening of ferroelectric polarization leads to pronounced finite size effects [12] and nontrivial domain structure dynamics [1] in the presence of thin dead layers and gaps. These in turn causes unusual phenomena near the electrically opened surfaces such as correlated polarization switching, formation of flux-closure domains in multiaxial ferroelectrics [13, 14, 15, 16], domain wall broadening in uniaxial [17, 18] and multiaxial ferroelectrics [15, 16]. Further examples of these behaviours include the crossover between different screening regimes in ferroelectric films [19, 20] and p-n junctions induced in 2D-semiconductors [21] separated by the ultra-thin gap from the moving domain wall - surface junctions. However, the dead layer approximation completely ignores many characteristic details of the thermodynamics of screening process. In particular, the stabilization ferroelectric state in ultrathin perovskite films can take place due to the chemical switching (see e.g. [22, 23, 24]), and the screening via ionic adsorption is intrinsically coupled to the thermodynamic of surface electrochemical processes. This coupling results in non-trivial effects on ferroelectric phase stability and phase diagrams [25, 26]. Similar effects are expected for screening by electrodes with finite density of states [27]. However, the surface state of materials in contact with atmosphere is usually poorly defined, due to the presence of mobile electrochemically active and physically sorbable components in ambient environment [28, 29]. The effect of adsorption of oxygen and hydrogen on the work function, reversible polarization value, dipole moment of the unit cell and free energy of the semiconductor ferroelectrics had been investigated experimentally and theoretically [30, 31, 32, 33], albeit total volume of research in this area is extremely small. However, no comprehensive or general approaches have been developed. The early theoretical analyses, though studied the properties of ferroelectric material in detail, typically ignored the nonlinear tunable characteristics of surface screening charges [30 − 33]. A complementary thermodynamic approach was developed by Stephenson and Highland (SH) [25, 26], who consider an ultrathin film in equilibrium with a chemical environment that supplies ionic species (positive and negative) to compensate its polarization bound charge at the surface. 2
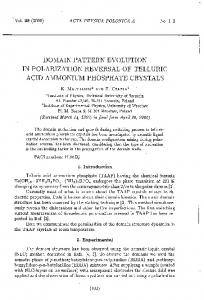
Recently, we modified the SH approach allowing for the presence of the gap between the ferroelectric surface covered by ions and the SPM tip [34, 35, 36, 37], and developed the analytic description for thermodynamics and kinetics of these systems. The analysis [34 − 36] leads to the elucidation of the ferroionic states, which are the result of nonlinear electrostatic interaction between the surface ions with the charge density obeyed Langmuir adsorption isotherm and single-domain ferroelectric polarization. The properties of ferroionic states were described by the system of coupled equation. Here, we study the stability of ferroionic states with respect to the domain structure formation and polarization reversal scenarios in thin ferroelectric films covered by ions. Our results, presented below, reveal unusual dependences of the film polar state and domain structure properties on the ion formation energies and their difference, and, even more, unexpected, on the applied voltage. That say one can expect to be faced with the electric field-induced phase transitions into ferroionic state in thin films covered with ion layer of electrochemically active nature. The manuscript is structured as following. Basic equations with boundary conditions are given in section II. Numerical results presented in section III demonstrate the effect of surface ions formation energy on stable polarization states, evolution of domain structure and surface charge during polarization reversal. To get insight into numerical results we presented simplified analytical modeling of ferro-ionic system behavior based on the free energy with renormalized coefficients in section IV. Distinctive features of polarization reversal in thin ferroelectric films covered by ions are discussed in section V. Electrostatic problem and derivation of the free energy with renormalized coefficients are given in Appendixes A and B, respectively. Parameters used in calculations and auxiliary figures are listed in Supp. Mat.[38]. II BASIC EQUATIONS WITH BOUNDARY CONDITIONS Here we consider the system consisting of electron conducting bottom electrode, ferroelectric (FE) film, surface ions layer with charge density σ(ϕ) , ultra-thin gap separated film surface and the top electrode (either ion conductive planar electrode or flatted apex of SPM tip) providing direct ion exchange with ambient media, as shown in Fig. 1(a). Mathematical statement of the problem is listed in Refs.[35 − 36] as well as in Appendix A.
3
top electrode
Exchange
z = −λ
gap
ϕ=U ϕ=0 (a)
σ(ϕ) P3
z=0
Charge density σ0 (n.u.)
ambient
__ ∆G1∆G2
1 0.5 0
-0.5
FE z=h z
bottom electrode
(b)
-1
T=300 K -1
-0.5
0
0.5
1
Potential ϕ (rel.units)
FIGURE 1. (a) Layout of the considered system, consisting of electron conducting bottom electrode, ferroelectric (FE) film, surface ions layer with charge density σ(ϕ) , ultra-thin gap separated film surface and the top electrode providing direct ion exchange with ambient media (from bottom to the top). (b) Schematic dependence of the equilibrium surface charge density σ0 vs. acting potential ϕ calculated for ∆G100 < ∆G 200 (blue curve),
∆G100 = ∆G200 (black curve) and ∆G100 > ∆G200 (red curve) (Adapted from Ref. [35]). We account for the presence of the ultra-thin dielectric gap between the probe tip and the ferroelectric surface. At that, the linear equation of state D = ε 0 ε d E relates the electrical displacement D and electric field E in the gap ( ε 0 is a universal dielectric constant and ε d ~ 1 is the relative permittivity of the physical gap media (vacuum, air or inert gas environment)). A wide band-gap ferroelectric film can be considered dielectric. Quasi-static electric field inside the ferroelectric film ϕ f satisfies electrostatic equations for each of the medium (gap and ferroelectric film). The boundary conditions (BCs) for the system are the equivalence of the electric potential to the applied voltage U at the top electrode (or SPM tip apex modeled by the flat region z = −λ) and the equivalence of the normal component of electric displacements to the ionic surface charge density σ[ϕ(r )] at z = 0; the continuity of the electric potential and normal component of displacements D3 = ε 0 E3 + P3 and D3 = ε 0ε d E3 at gap - ferroelectric interface z = 0 ; and zero potential at the bottom conducting electrode z = h [see Fig. 1].
The polarization components of uniaxial ferroelectric film depend on the inner field E as
(
)
P1 = ε 0 ε11f − 1 E1 ,
(
)
P2 = ε 0 ε11f − 1 E2
and
(
)
b − 1 E3 , P3 (r, E3 ) = P3 f (r, E3 ) + ε 0 ε 33
where
background
permittivity ε b33 ≤ 10 [ 39]. The dielectric permittivity ε 33f is related with the ferroelectric polarization P3 via the soft mode. The evolution and spatial distribution of the ferroelectric polarization P3 f (further abbreviated as P3 ) is given by the time-dependent LGD equation: Γ
∂P3 ∂ 2 P3 + αP3 + βP33 + γP35 − g = E3 , ∂t ∂z 2
4
(1)
In Eq.(1), the kinetic coefficient Γ is defined by phonon relaxation; α = α T (TC − T ) , β and γ ≥ 0 are the coefficients of LGD potential F (Pi , X ij , σ ) expansion on the higher polarization powers [ 40]; T is the absolute temperature, TC is Curie temperature. The BCs for polarization at the film surfaces z = 0 and z =
∂P h are of the third kind P3 Λ 3 = 0 and include extrapolation lengths Λ ± [ 41, 42]. ∂z z =0,h Equation for the surface charge is analogous to the Langmuir adsorption isotherm used in interfacial electrochemistry for adsorption onto a conducting electrode exposed to ions in a solution [43]. To describe the dynamics of surface ions, we use a linear relaxation model for their charge density, τ
∂σ + σ = σ 0 [ϕ] , where the dependence of equilibrium charge density σ 0 [ϕ] on electric potential ϕ is ∂t
controlled by the concentration of surface ions θi (ϕ) at the interface z = 0 in a self-consistent manner [25, 26]: eZ θ (ϕ) eZ p σ 0 [ϕ] = ∑ i i ≡ ∑ i 1 + atm Ai Ai p exc i i
1 ni
−1
∆Gi00 + eZ i ϕ , exp k BT
(2)
where e is an elementary charge, Z i is the charge of the surface ions/electrons, 1 Ai is the saturation densities of the surface ions, at that i ≥ 2 to reach the charge compensation, pexc is the partial pressure of ambient gas relative to atmospheric pressure p atm , ni is the number of surface ions created per gas molecule, ∆Gi00 is the standard free energy of the surface ion formation at p exc = 1 bar and U = 0. Schematic step-like dependence of the surface charge density σ0 on the potential ϕ is shown in Fig. 1(b). The surface charge is small or zero at ϕ = 0 , and then is abruptly increases for potential values ϕ i ≈ − ∆Gi00 (eZ i ) . The abrupt step-like dependence is left-shifted with respect to ϕ = 0 for
∆G100 < ∆G200 (blue curve), almost symmetric for ∆G100 ≈ ∆G200 (black curve) and right-shifted for ∆G100 > ∆G200 (red curve). For equal ∆G100 = ∆G200 ≡ ∆G the Langmuir isotherm is the even function of ∆G , σ 0 (ϕ, ∆G ) ≡ σ 0 (ϕ,−∆G ) provided that other parameters correspond to the charge neutrality at zero
potential. Notably, the developed solutions are insensitive to the specific details of the charge compensation process [ 44], and are sensitive only to the thermodynamic parameters of corresponding reactions [ 45]. III. EFFECT OF SURFACE IONS FORMATION ENERGY ON POLARIZATION REVERSAL AND DOMAIN STRUCTURE. FEM RESULS Using 3D finite element modeling (FEM) we studied the polarization states in the ferro-ionic system. Following the terminology introduced in Refs.[34 − 36] we classified the possible polar state in the ferro5
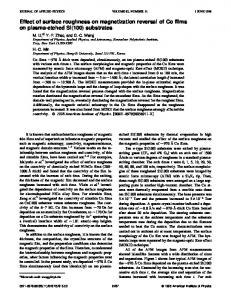
ionic system based on the free energy minima and hysteresis loops shaping. A general property of the ferroelectric film covered with ions is that it can be in the single-domain (SD) or poly-domain (PD) ferroelectric (FE), ferroionic (FI), antiferroionic (AFI) and ionic non-ferroelectric (NFE) equilibrium states depending on the applied voltage U, temperature T, film thickness h and ion formation energies
∆Gi00 (see Figs 2).
SD-FE (down)
Polarization
Polarization
Polarization
PD-FE
SD-FE (up) Applied voltage
(b)
Applied voltage FI (down)
Polarization
FI (up)
Polarization
Applied voltage
(c)
NFE
AFI
Polarization
(a)
AFI (d)
Applied voltage
(e)
Applied voltage
(f)
Applied voltage
FIGURE 2. (a)-(c) Polar states classification in the ferro-ionic system based on the polarization distribution and hysteresis loop form. Characteristic hysteresis loops for poly-domain ferroelectric (PD-FE) state (a), positive (b) and negative (c) single-domain ferroelectric (SD-FE) states with dominant "upward" and "downward" polarizations, positive (d) and negative (e) ferroionic (FI) states with almost "upward" and "downward" polarizations; and (f) mixed antiferroionic (AFI) and ionic non-ferroelectric (NFE) state are shown. Polarization distribution corresponding to definite points at the hysteresis loop is shown by insets with upward or downward oriented arrows for a homogeneously polarized film, two upward and downward oriented arrows for a poly-domain state, and empty square for a zero homogeneous polarization.
The FE state is defined as the state with robust ferroelectric hysteresis between at least two (or more) absolutely stable ferroelectric polarizations, which have "positive" or "negative" projection with respect to the film surface normal [see Figs. 2(a)-(c)]. Due to the nonlinear voltage dependence of the surface ions charge density [Eq.(2)], the polarization screening by the ions result in one or more unstable positive or negative polarization states. FE states exist at film thickness above the critical value, 6
h ≥ hcr (T ) , at fixed temperature T < TC .Usually the value hcr (T ) depends on the screening conditions [1, 15, 46]. Due to the presence of the gap between the film surface and the tip electrode, FE states can be poly-domain (PD-FE) with a rather thin and tilted hysteresis loop at small amplitudes of applied voltage [see Figs. 2(a)]. Also FE states can be almost single-domain (SD-FE) with symmetric, dominantly positive or negative polarizations and correspond to a wide square-like hysteresis loop at higher voltage amplitudes [see Figs. 2(b) and 2(c)]. Noteworthy SD-FE states can be more stable than the PD-FE ones for ∆G100 ≠ ∆G 200 , because positive and negative orientations of polarization are energetically equivalent only at zero applied voltage U = 0. The physical origin of SD-FE states voltage asymmetry is the electric
(
)
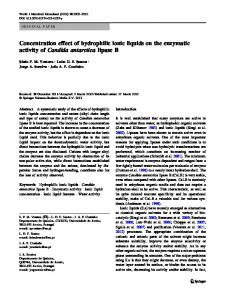
field E eff ~ ∆G100 − ∆G200 h produced by surface ions with the charge density σ(U). The field Eeff was introduced earlier [34 - 36] and its analytical form will be discussed in the next section. When this field of electrochemical nature is above certain critical value, SD-FE state becomes absolutely stable, while PDFE state becomes metastable. The FI state appears with increase of Eeff as supported by the voltage bistability of ionic states and its boundary with SD-FE stable is conditional (resembling relative definition of ferroelectric and pyroelectric). FI state is characterized by a strongly asymmetric, horizontally shifted or vertically imprinted (or "minor") hysteresis loop between two polarization states (one is stable and another is metastable). At that the polarization orientation in the states can be the same (e.g. positive or negative in both states), and the values should be different (e.g. one big and another small) [compare Fig. 2(d) and 2(e)]. FI states appear because one of polarization orientations loses its stability when the film thickness h becomes less than the critical value hcr (T ) , and can exist for significantly different values of ∆Gi00 (e.g. for ∆G100 − ∆G 200 ≥ 0.2 eV) even in ultrathin films (h ≤ 2 nm) at high temperatures. [2]. NFE state follows the FI state under the temperature increase or further decrease of the film thickness well below the critical value hcr (T ) . NFE state appears when two metastable polarization orientations [shown in Fig. 1(f) by upward and downward arrows] disappear at the energy relief. NFE state has no hysteresis properties at U = 0 in the thermodynamic limit and reveal electret-like polarization state P3 ~ E eff (σ ) induced by the field Eeff [see Fig. 2(f)]. A double hysteresis loop opening appeared at high applied voltages U corresponds to the novel antiferroionic (AFI) state. Since the energies of upward and downward polarization orientations gradually reach each other with the temperature increase the diffuse boundary between AFI and FI states is defined by the electrochemical properties of surface ions, in particular by the ion formation energies ∆Gi00 . Stable polarization states were calculated numerically in dependence on the surface ions formation energies ∆Gi00 at zero applied voltage (U = 0). Corresponding diagrams are shown in Figs. 3(a), (b) and (c) for 100-nm, 50-nm and 10-nm PZT films, respectively. Here, the calculations are performed for 7
permittivity of the dielectric gap ε d = 1, its thickness λ = 0.4 nm and saturation area of the surface ions A1 = A2 = 10−18 m2, other parameters are listed in Table SI in Suppl. Mat [38].
Green circles in the diagrams Figs. 3(a)-(b) correspond to the PD-FE state, blue and orange circles are negative and positive SD-FE states, which continuously transform into FI states. Dashed curves correspond to the contours of constant intrinsic electric field Eeff induced by ions. Solid curves are drawn by eye. Note the that the domain states in the regions between dashed and the solid curves [some of the circles are semi-colored in Fig. 3(a)-(b)] are very sensitive to the initial seeding (random polarization distribution at t=0), and the film in the average (even being poly-domain) can have a nonzero unipolarity degree, i.e. the fraction (sizes and/or number) of domains with negative polarization orientation is not equal to the fraction with positive one. A comparison of the polarization states diagram of 100-nm film [Fig. 3(a)] with the one of 50-nm film [Fig. 3(b)] shows that the region of PD-FE states (green circles between the solid curves) that extends from the diagonal ∆G100 = ∆G200 becomes much thinner and smaller with the film thickness decrease. For 50-nm film the region narrows to the diagonal at ∆G100 = ∆G200 ≤ 0.7 eV and only then slightly enlarges at 0.7 < ∆Gi00 ≤ 1 eV. The regions of positive and negative SD-FE states, which are induced by the intrinsic field Eeff , expand with the increase of the difference ∆G100 − ∆G 200 . Also the region of SD-FE state significantly increases with the film thickness h decrease because
(
)
E eff ~ ∆G100 − ∆G200 h . Note that the regions of FI state are located far from the diagonal at ∆G100 − ∆G 200 ≥ 0.8 eV and slightly expand with h increase.
The diagram for the thinnest 10-nm film is very different from the ones for 50- and 100-nm films [see Fig. 3(a)]. FE states are absent for the case, because 10-nm film is paraelectric at σ = 0. Light green, blue and orange circles in the diagram (c) correspond to the electret-like NFE states, and FI states with negative and positive polarizations, respectively. The film is in a paraelectric state along the diagonal, ∆G100 = ∆G200 . A wide almost square region of NFE states corresponds to ∆Gi00 ≥ 0.2eV. Note that NFE states in the regions between dashed and solid lines are very sensitive to the mesh details, and the film on the average (being in a NFE state) has a non-zero average polarization [all of the circles are semi-colored in Fig. 3(c)]. Alternatively, NFE states can be metastable (or slowly relaxing one), the dynamics difficult to capture via numerical model. Stable "up" and "down" FI states are caused by Eeff increase and located in the two rectangles with rounded edges, 0 ≤ ∆Gi00 ≤ 0.15 eV. Note that the unusual physical picture shown in Fig. 3(c) corresponds to the stable polarization states at zero voltage U = 0.
8
Ion 2 formation energy ∆G2 (eV)
0.8
FI PD-FE SD-FE FI
0 0
0.2
0.4
0.6
0.8
1
(c) h=10 nm
1
PE
NFE
0.2
FI
6 0
0.2
0.4
0.6
0.8
Ion 1 formation energy ∆G1 (eV)
P3
FI
NFE
0.2
0.4
0.6
0.8
1
0.6
0.4
0.2
0
(d)
+50
0.8
0 Eeff (kV/cm)
-50
h=10 nm h=50 nm
0
1
FI
PD-FE
FI
FI
0
FI
0 0
NFE
0.4
0.2
Ion 1 formation energy ∆G1 (eV)
0.8
0.6
SD-FE
0.4
FI
PD-FE
FI
1
FI
0.6
PD-FE
SD-FE
h=10 nm
0.2
0.8
h=100 nm
0.4
(b) h=50 nm
h=50 nm
0.6
Ion 1 formation energy ∆G1 (eV)
Ion 2 formation energy ∆G2 (eV)
1
(a) h=100 nm
SD-FE
Ion 2 formation energy ∆G2 (eV)
Ion 2 formation energy ∆G2 (eV)
1
0.2
0.4
h=100 nm 0.6
0.8
1
Ion 1 formation energy ∆G1 (eV)
FI
FIGURE 3. Polarization states in dependence on the surface ions formation energies ∆Gi00 calculated for PZT film thickness h = 100 nm (a); 50 nm (b) and 10 nm (c). In the diagrams (a, b), dark green circles correspond to the poly-domain ferroelectric state (PD-FE), single-domain ferroelectric (SD-FE) states with opposite (negative and positive) polarization orientations are represented by blue and orange circles, respectively. SD-FE states continuously transform into ferroionic (FI) states (represented by blue and orange circles). In the diagram (c), black, light yellow-green, blue and orange filled circles correspond to the paraelectric-like (PE) state, electret-like nonferroelectric (NFE) states and ferroionic (FI) states with opposite polarization directions, respectively. Solid
[
]
curves are drawn by eye. (d) Effective intrinsic field E 0 ∆Gi00 , h (in kV/cm) depending on the surface ions formation energies ∆Gi00 calculated for PZT film thickness h = 10, 50 and 100 nm (legends at the curves) at T =
9
300 K; other parameters are listed in Table SI. Empty rings indicate the points, where the dependences P(U ) are shown in Fig. 4 and Figs. S1-S4.
The voltage dependences of polarization P(U ) and surface charge σ(U ) were calculated at amplitudes (20 V) of applied voltages for a 10-nm PZT film (corresponding applied field is 2 GV/m). Results for P(U) and σ(U) are shown in Fig. 4(a) and Fig. 4(b), respectively. These graphs indicate that symmetric, slightly or strongly asymmetric, and double hysteresis loops with pronounced coercive voltage (about 10 V) exist at ∆Gi00 ≤ 0.5eV. It is worthy of note that the spontaneous ferroelectric polarization disappears at zero voltage for ∆Gi00 > 0.2eV [as it is shown in Fig. 3(c)].
{0.5, 0.1} U (V)
σ (C/m2)
σ (C/m2)
σ (C/m2)
U (V) U (V) {0.5, 0.5} NFE {0.9, 0.5} AFI
U (V)
U (V)
FI
{0.9, 0.1} U (V)
(a) Polarization P
FE
NFE {0.9, 0.9}
U (V) FI
FI
{0.1, 0.1} U (V)
{0.5, 0.1} U (V)
σ (C/m2)
{0.1, 0.1} U (V)
P (C/m2)
FI
P (C/m2)
FE
σ (C/m2)
U (V)
U (V)
U (V)
P (C/m2)
{0.9, 0.5}
σ (C/m2)
{0.5, 0.5}
NFE
σ (C/m2)
AFI
P (C/m2)
{0.1, 0.5}
P (C/m2)
P (C/m2)
FI
{0.5, 0.9}
NFE
U (V) {0.1, 0.5} FI
U (V)
U (V)
{0.1, 0.9}
σ (C/m2)
U (V)
{0.9, 0.9}
σ (C/m2)
{0.5, 0.9}
P (C/m2)
{0.1, 0.9}
FI
NFE
NFE
P (C/m2)
P (C/m2)
FI
{0.9, 0.1} U (V)
(b) Surface charge σ
FIGURE 4. Dependences of average polarization P(U ) (a) and surface charge σ(U ) (b) on applied voltage U
{
}
calculated at fixed values ∆G100 , ∆G 200 indicated in the labels (in eV) for a 10-nm PZT film. The voltage varies from −20 to +20 V. Polarization varies from −0.45C/m2 to +0.45C/m2. Surface charge varies from −0.35C/m2 to +0.35C/m2. Arrows indicate the direction of the loops pass-tracing. Other parameters are the same as in Fig. 2.
Comparison of the loops shown in Fig. 4(a) with the points on the diagram Fig. 3(c) corresponding to the same pair of ion formation energies
{∆G
00 1
, ∆G 200
}
leads to the following
conclusions. If the film is in a FI state at U = 0, it remains in the state with the voltage amplitude increase, at that the polarization reversal along asymmetric hysteresis loop follows the single-domain scenario. When the film is in a NFE state at U = 0 it can remains NFE with the voltage increase at ∆G100 − ∆G200 ≤ 0.1 eV. However if the difference increases, ∆G100 − ∆G200 > 0.2 eV, the film in NFE
10
state unexpectedly becomes FI with the voltage increase [see Figs. S1-S2]. Hysteresis loops of P(U ) and σ(U ) calculated for more pairs of {∆G100 , ∆G 200 } and h = 10 nm are shown in Figs. S1-S2. From the figures one can see that almost symmetrical hysteresis loops of P(U ) and σ(U ) appear at voltages amplitudes greater than 10 V and equal ion formation energies ∆G100 = ∆G 200 ≤ 0.4 eV. At equal ∆G100 = ∆G 200 = 0.5еV the double hysteresis loop occurs indicating the transition to AFI states. The double loops degrade and eventually disappear with increasing the value of ∆G100 = ∆G 200 [see plots in Figs. 4 for ∆G100 = ∆G 200 = 0.9eV]. The physical reason for abovementioned crossover from the single to double hysteresis loops is the voltage dependence of ionic charge magnitude [see Fig. 1(b)]. Here, the magnitude of ion charge increases, because its density depends exponentially on the voltage [see Eq.(2)]. This inevitably means that the critical thickness for the film transition from the NFE state to poly-domain or single-domain FE, FI or AFI states depends on the voltage U. Moreover, the critical thickness decreases with the U increase according to our calculations. Thus, the electric field-induced transition to the FI or AFI phases of thin films covered with a layer of ions is possible due to the field stimulation of the electrochemical reaction of ion formation. For instance the 10-nm film revealed the unusual field-induced transition into FI and AFI states induced by the strong field dependence of the ion charge density. Note that electric field induced FE-state has been observed in ferroelectrics since 90ies [ 47, 48, 49]. The physical origin of the AFI double hysteresis loops characteristic to AFI state can be explained by the dependence of the surface charge density on electric potential at ∆G100 = ∆G200 ~ 0.5 eV, which has the form of Langmuir absorption isotherm [shown in Fig. 1(b)]. Since the surface charge is responsible for the polarization screening in a ferroelectric film, high charge densities (corresponding to high acting electric potential eϕ >> k B T ) can provide an effective screening, and the low ones (corresponding to small potentials eϕ ≤ k B T ) can provide a weak incomplete screening only. At room temperatures the 10nm PZT film is in the FI state for 0 ≤ ∆Gi00 ≤ 0.1 eV, and relatively weak ionic screening of its depolarization field is enough to support the state. Corresponding hysteresis loop has a single ferroelectric-like shape with relatively high remanent polarization and coercive voltage. Polarization behavior changes drastically with ∆Gi00 increase, when the film approaches the AFI or NFE states. A high screening degree leads to higher critical thickness of the transition [Ошибка! Закладка не определена., 1, 15]. Thus, additional screening by ions is urgently required to maintain the thin film in a polarized or antipolarized state. As one can see from Fig. 1(b), the screening increase appears at nonzero potential ϕ that is in turn proportional to the applied voltage U. The critical voltage corresponding to the screening degree enough to suppress the thickness-induced paraelectric transition opens the double hysteresis loops of polarization, which in turn induce the double loops of concentration hysteresis. The 11
situation for thicker films (e.g. 25 nm thick and more) appeared more usual, since the single loop opens at high voltages for all ∆Gi00 , and its width and asymmetry much weaker depends on ∆Gi00 values [see Fig. S3]. Detailed comparison of Fig. 4(a) and 4(b) brings forth the question of how to explain the strong decrease (up to the absence) of the surface charge at high voltages [(10 – 20)V], if the polarization saturates at the same time [e.g. compare the plots of
{∆G
00 1
P(U ) and
σ(U ) calculated for
}
, ∆G200 = {0.1,0.1} ]? To disclose the reason we calculate the polarization, surface charge, electric
potential and field at the surface of ferroelectric 10-nm PZT film, where the surface ions are located, for a wider range of applied voltages [see Figs. S4]. It appeared that the potential becomes very small (and hence the ion charge is small), and the potential and field drop is located in the ultra-thin physical gap of thickness λ = 0.4 nm [see Fig. S4(f)]. On the other hand, the field in a ferroelectric film is much smaller and display hysteretic behavior [Fig. S4(e)]. Figure S5 is for the same 10-nm PZT film in a deep paraelectric phase (at high temperature). We have further calculated the voltage dependence of the total charge at bottom ( z = h ) and top ( z = −λ ) electrodes, QB (U ) and QT (U ) , respectively [see Figs. 5]. It appeared that the value and hysteresis shape of QB (U ) almost coincide with the dependence P(U ) in the considered quasi-static limit (i.e. at very low frequencies of applied voltage). However QT (U ) is linear and so it principally differs from P(U ) due to the surface charge hysteresis σ(U ) , as well as due to the electric field drop in the ultrathin dielectric gap that "conduct" only the displacement currents. Counter-clockwise path-tracing of P(U ) loops corresponds to clockwise path-tracing of σ(U ) loops.
12
Charge density (C/m2)
(a)
(c)
Applied voltage U (V) ∆G1=0 eV, ∆G2=1 eV
Charge density (C/m2)
__ σ(U) __ P(U)=QB(U) __ QT (U)
(b)
∆G1=1eV, ∆G2=0 eV
__ σ(U) __ P(U)=QB(U) __ QT (U) Applied voltage U (V) ∆G1=∆G2=0.5 eV
__ σ(U) __ P(U)=QB(U) __ QT (U)
Applied voltage U (V)
Charge density (C/m2)
Charge density (C/m2)
∆G1=∆G2=0 eV
(d)
__ σ(U) __ P(U)=QB(U) __ QT (U) Applied voltage U (V)
FIGURE 5. Dependences of average polarization P(U ) and surface charge σ(U ) on applied voltage U calculated
{
}
for a 10-nm PZT film with fixed values ∆G100 , ∆G 200 indicated in the labels at plots (a)-(d). Arrows indicate the direction of the loops path-tracing Temperature T=300 K, other parameters are the same as in Fig. 2.
On of the conclusive remarks of the section is that Figures 2-4 argue that the boundaries between PD-FE, SD-FE, FI and AFI states is not sharp, similarly to the difference between ferroelectric and pyroelectric states. However we can actually separate them based on the thickness evolution of free energy for polarization, as will be demonstrated below. IV. FREE ENERGY OF FERRO-IONIC SYSTEM Here, we develop simplified analytical model to get insight into numerically analyzed behaviors of FI states. Since the stabilization of single-domain polarization in ultrathin perovskite films takes place due to the chemical switching (see e.g. [25, 26, 22-26]), we can consider the ferroelectric film in the SD-FE, FI, AFI, NFE or PE states and assume that polarization distribution P3 ( x, y, z ) is smooth. In this case, the
13
behavior of the polarization averaged over film thickness P = P3 and surface charge density σ can be described via the coupled nonlinear algebraic equations derived in Refs. [34 - 36]. Here we consider the stationary case, when σ = σ 0 , and also p exc = p atm . The free energy G minimization of which gives the coupled equations for polarization dynamics, has the form: 2 ε ε (Ψ − U )2 Ψ G[P, Ψ ] β γ α b Ψ = h R P 2 + P 4 + P 6 − ΨP − ε 0 ε 33 − 0 d + ∫ σ 0 [φ]dφ S 4 6 2h 2 λ 2 0
Coefficient α R = α T (TC − T ) +
g 33 h
1 1 + Λ+ Λ−
(3)
is the coefficient α renormalized by "intrinsic" gradient
correlation size effects (the term ~ g 33 h ). The first term in Eq.(3) is Landau-Ginzburg polarization energy. The second term, ΨP , represents the energy of interaction of polarization P with overpotential b Ψ. The terms ε 0 ε 33
ε ε (Ψ − U ) Ψ2 and 0 d are the energies of electric field in the ferroelectric film, and in 2h 2 λ 2
Ψ
∫ σ [φ]dφ ,
the gap, correspondingly. The last term,
0
is the surface charge energy. The formal
0
minimization,
∂G[P, Ψ ] ∂G[P, Ψ ] = 0 and = 0 , couples the polarization and overpotential as following ∂P ∂Ψ
α R P + βP 3 + γP 5 =
Ψ , h
(4a)
and
Ψ=
λ(σ − P ) + ε 0 ε d U h. ε 0 ε d h + λε b33
(
(4b)
)
The energy given by Eq. (3) has an absolute minimum at high Ψ. According to the Biot's variational principle [ 50], we can further use the incomplete thermodynamic potential, partial minimization of which over P will give the coupled equations of state, and, at the same time, it has an absolute minimum at finite P values. In Appendix B we derived the P-dependent thermodynamic potential, F [P ] . Assuming that eZ i Ψ k B T 0 for small thicknesses and/or high temperatures [see global minimum in Fig. 7(b) for 10-nm films at room temperature]. Dependence of the absolutely stable polar state P1 on the 16
surface ions formation energies ∆Gi00 calculated for the film thickness h = 100, 50 and 10 nm are shown in Figs. 7(c),(d) and (e) respectively. Notice, that the polar states Pi are significantly ∆Gi00 -dependent only at 0 ≤ ∆Gi00 ≤ 0.1 eV. Stable, metastable and unstable polar states in dependence on the surface ions formation energies ∆Gi00 calculated for PZT film thickness h = 10, 50, 100 and 300 nm and T = 600, 300 K are shown in Figs. S7-S9.
0.75 0.5 0.25 0
� 0.25 � 0.5
� 0.75
h=100 nm, ∆G1=1 eV ∆G2=0 ∆G2≥0.1eV P3 P2 P1 P1
P3
P2
P1 – stable P2 – (meta)stable P3 – unstable
-0.6 -0.4 -0.2 0 0.2 0.4 0.6
(a) Energy ∆G2 (eV)
1
Polarization (C/m2)
1
0.58 1
0.8
0.8
(c) h=100 nm P1 (C/m2)
0.6 0.4
0.75 0.5 0.25
P1
0 � 0.25
0.2 0.4 0.6 0.8
P1
� 0.5
Energy ∆G1 (eV)
0
0.43
h=50 nm h=10 nm
� 0.75
(b)
� 0.6 � 0.4 � 0.2 0
0.2 0.4 0.6
Polarization (C/m2)
0.20
0.8
(d) h=50 nm P1 (C/m2)
0.4
1
∆G2=0 ∆G2≥0.1eV
P1
(e) h=10 nm P1 (C/m2)
0.6 0.4
0.2
0
P2
0.45 1
0.6
0.2 0
Free energy (10-7J/m3)
Free energy (10-7J/m3)
1
0.2 0
0.2 0.4 0.6 0.8
1
Energy ∆G1 (eV)
0
0
0
0.2 0.4 0.6 0.8
1
Energy ∆G1 (eV)
-0.20
FIGURE 7. Dependences of the free energy on average polarization calculated in the case of screening by ions, zero applied voltage and different values of PZT film thickness h = 100 nm (a), 50 (solid curves) and 10 (dashed curves) nm (b). Each curve corresponds to ∆G100 = 1eV and ∆G200 = 0 (red) or ∆G200 = (0.1 – 1)eV (black an other colors, which coincide). (c)-(e) Dependence of the absolutely stable polar state P1 on the surface ions formation energies ∆Gi00 calculated for h = 100, 50 and 10 nm (legends at the plots). Color scale bar is polarization in C/m2. Temperature T = 300 K, U = 0 and other parameters are the same as in Fig. 3.
Because the coefficients AR , BR and C R depend on the ion formation energies ∆Gi00 as per Eqs. (5), the free energy (5) is ∆Gi00 -dependent, and Figs. 8 demonstrate how strong and nontrivial the dependence is for different film thicknesses. For 300-nm film, the two deep absolute and local minima, 17
and one high maximum (barrier), which depth and position are ∆G200 -dependent at 0 ≤ ∆G 200 ≤ 0.1 eV and fixed ∆G100 = 1eV [Fig. 8(a)]. The minima become much shallower and barrier almost disappear with the film thickness decrease up to 50 nm [compare the maps in Fig. 8(b) and 8(c)]. Only one absolute minima
0.15
0.27
h=300 nm ∆G1=1 eV
0.125
0.15
Energy ∆G2 (eV)
Energy ∆G2 (eV)
exists for 10-nm film [Fig. 8(d)].
0.1
0.075 0.05
0.025 0
0.6 0.4 0.2
0.2
0.4
0.6
-0.64
2
0.125 0.1 0.075 0.05 0.025 0
(c)
0.6 0.4 0.2
0
0.2
0.4
2
0.6
0.075 0.05 0.025 0.6 0.4 0.2
0.15 0.125
0.2
0.4
2
0.6
-0.55 13.5
h=10 nm ∆G1=1 eV
0.1 0.075 0.05 0.025
-0.46
Polarization (C/m )
0
Polarization (C/m )
(b) 2.63
h=50 nm ∆G1=1 eV
0.1
Energy ∆G2 (eV)
0.15
0.125
0
Polarization (C/m )
(a)
Energy ∆G2 (eV)
0
1.22
h=100 nm ∆G1=1 eV
0
(d)
0.6 0.4 0.2
0
0.2
0.4
2
0.6
Polarization (C/m )
-0.71
FIGURE 8. Dependence of the free on the average polarization and surface ions formation energy ∆G 200 calculated for ∆G100 = 1eV, PZT film thickness h = 300 nm (a), 100 nm (b), 50 nm (c) and 10 nm (d). Color scale bar is the energy in 107 J/m3. Temperature T = 300 K, U = 0 and other parameters are the same as in Fig.3.
Figure 9 illustrates the dependence of the free energy on the average polarization P and film thickness h calculated for ∆G 200 = 0 [Fig. 9(a)] and ∆G 200 = 0.1 eV [Fig. 9(a)] at fixed ∆G100 = 1eV and room temperature. Two nonequivalent minima of polarization (P1 and P2) are separated by a barrier (P3 state) at ∆G 200 = 0 and fixed h above 100 nm, and the only minimum remains for thin films of e.g. 10 nm thick [see polarization points in Fig. 9(a)]. Two almost equivalent minima of polarization (P1 and P2) are separated by a barrier (P3 state) at ∆G 200 = 0.1 eV and fixed h more than 50 nm, and they transforms into a saddle point with the film thickness decrease [see polarization points in Fig. 9(b)]. In fact, Figs. 9 argues 18
that the difference between SD-FE and FI states is not sharp, similarly to the difference between ferroelectric and pyroelectric states, but we can actually separate them based on the thickness evolution of free energy for polarization. For thick films there are 2 minima, and they are almost the same as in the bulk. For small thickness we start to see the mergence of the minima and disappearance of corresponding polarization state and so the ferro-ionic system undergoes second order transition with the thickness decrease.
300
∆G1=1 eV ∆G2=0eV P3
P1
0.27 P2
Free energy
Thickness h (nm)
103
100 30 10
(a)
P1 � 0.6
� 0.4
� 0.2
0
0.2
Polarization (C/m2)
0.4
0.6
300
P1
∆G1=1 eV ∆G2=0.1eV
100
(b)
0.27
P2
P3
Free energy
Thickness h (nm)
103
30 10 � 0.6
� 0.4
� 0.2
0
-0.64
0.2
2
Polarization (C/m )
0.4
0.6
-0.64
FIGURE 9. Dependence of the free energy on the average polarization and PZT film thickness calculated for
∆G100 = 1eV, ∆G 200 = 0 (a) and ∆G 200 = 0.1 eV (b). Color scale bar is the energy in 107 J/m3. Temperature T = 300 K, U = 0 and other parameters are the same as in Fig. 3.
The temperature and ∆G200 dependences of three polarization states for 100-nm film, corresponding to the roots of algebraic equation AR P + BR P 3 + C R P 5 = E eff for the case of the purely second order 19
phase transitions ( AR < 0 , BR > 0 , C R = 0 ), are shown by red, magenta and blue curves in Fig. 10(a). Each curve in the group (denoted by single color) corresponds to the definite value of ∆G200 within the range (0 - 0.9) eV. The only one stable polar state, P ≈ E eff AR that exists in a 10-nm film [because
AR > 0 for the case] is shown Fig. 10(b). Corresponding dependences of the polarization states on the surface ions formation energy ∆G 200 .calculated for T = 300 K and 600 K are shown in Figs. 10(c) and 10(d), respectively.
Polarization (C/m2)
0.5
∆G200
0.25 0
� 0.25
unstable states ∆G200
� 0.5
h=100 nm ∆G1=1 eV
� 0.75 0
(a)
NFE
FI
200
400
600
Temperature (K)
0.6
Polarization (C/m2)
FE
0.75
0 � 0.2
h=50
h=25
h=50
� 0.4
h=100 h=300
� 0.6 0
0.05
0.1
0.15
0.2
Ion formation energy ∆G2 (eV)
(c)
� 0.1
∆G200
� 0.15 � 0.2
h=10 nm ∆G1=1 eV
� 0.25 200
400
600
Temperature (K)
Polarization (C/m2)
Polarization (C/m2)
h=10
h=100
0.1
� 0.05
(b)
h=50
h=300
0.2
T=300 K ∆G1=1 eV
h=100
0.4
0
� 0.3 0
h=300
h=300 h=300
0
h=25 h=100
h=10
� 0.1
h=300
h=50
T=600 K ∆G1=1 eV
� 0.2
(d)
0
0.05
0.1
0.15
0.2
Ion formation energy ∆ G2 (eV)
0.25
0.3
FIGURE 10. (a-b) Temperature dependences of the average polarization calculated in the case of screening by ions, zero applied voltage and different values of film thickness h = 100 nm (a) and 10 nm (b). Each curve in the one-colored group corresponds to the definite value of ∆G 200 = (0, 0.05, 0.1, 0.15, 0.2, 0.9) eV. The arrows indicate the direction of ∆G 200 increase. Unstable branches (inside the ellipse) are shown by blue colors. (c-d) Dependence of the polarization states on the surface ions formation energy ∆G 200 .calculated for T = 300 K (c) and 600 K (d). Different curves correspond to PZT film thickness h = 10, 25, 50, 100 and 300 nm (as indicated by legends in nm). Stable polar states [P1 and P2 in Fig. 6(a,b)] are shown by red and magenta colors. Unstable states [P3 in Fig. 6(a,b)] existing for h ≥ 50 nm; they are shown by blue colors. The energy ∆G100 = 1eV, U = 0 and other parameters are the same as in Fig. 3.
20
IV. DISCUSSION AND OUTLOOK We established the role of the surface ions formation energies on the polarization states and its reversal scenarios, domain structure and corresponding phase diagrams of ferroelectric thin films. At that it appeared that the role of the physical gaps on the domain formation and stability is critical. Using 3D finite elements modeling we analyze the distribution and hysteresis loops of ferroelectric polarization and ionic charge, and dynamics of the domain states. Obtained results delineate the regions of single- and poly-domain ferroelectric, ferroionic, antiferroionic and non-ferroelectric states as a function of surface ions formation energies ∆Gi00 , film thickness h, applied voltage U and temperature T. We revealed the unusual dependence of the film polar state and domain structure parameters on the ion formation energy value and, that is more unexpected, on the applied voltage. In particular we observed the voltage-induced phase transitions into the single-domain ferroionic or antiferroionic states in a thin film covered with ion layer of electrochemically active nature, when the energies ∆Gi00 are significantly different. Ferroionic poly-domain states have not been realized in ultrathin films. At that the physical origin of the double "antiferroionc" hysteresis loops of polarization and surface charge revealed at close ions formation energies ( ∆G100 − ∆G200 ≤ 0.05 eV) can be explained by the dependence of the surface charge density on electric potential, which has the form of Langmuir absorption isotherm. We further map the analytical theory for 1D system onto an effective Landau-Ginzburg free energy and establish the correspondence between the 3D numerical and 1D analytical results at zero applied voltage. The results argues that the difference between the single domain ferroelectric and different ferroionic states is not sharp, similarly to the difference between ferroelectric and pyroelectric states, and we can actually separate them based on the thickness dependence of ferro-ionic system free energy. For thick films (h ≥ 100 nm) there are 2 minima, and they are almost the same as in the bulk. For small thickness (h < 50 nm) we start to see the mergence of the minima and disappearance of corresponding polarization state. In result the ferro-ionic system undergoes the sort of the second order transition taking place with the thickness h decrease. This approach allows getting the overview of the phase diagrams of ferro-ionic systems, and exploring the specific features of polarization reversal and domain evolution phenomena. On the other hand many important questions remain for further studies. At first, if the concentration of the ions becomes smaller, the distance between them increases as its square root. When the distance between the surface ions becomes compatible (or even smaller) than the film thickness, each of the ions should be considered as a point charged defect and the continuous approximation for their charge density σ 0 [ϕ] becomes invalid. Complementary atomistic calculations should be performed n the case of small ion concentration and/or high saturation densities of the surface ions defining their steric limit (saturation area per one ion). 21
Secondly a detailed semi-phenomenological and semi-microscopic study of the influence of the electrochemical charges parameters, such as their type (oxygen anions and vacancies vs. other charges such as protons, hydroxyls, etc), enthalpy and/or formation energies seem to be urgent. Notice that the study can reveal that the steric limit value and all other properties related with their thermal activation (analog of the and α(ϕ) ) including the net form of the potential dependence of the occupied cites (analog of the and θ i (ϕ) ) that in principle can be different from Langmuir isotherm (e.g. Frumkin isothermal function [ 52]). In the third, the dynamical processes, including the polarization and electromechanical response relaxation and their periodic change (cross-over between hysteretic and non-hysteretic behaviors) under the periodic applied voltage are poorly studied. An expected results analysis is impossible without an establishment of the correct hierarchy of different charge species relaxation times. Acknowledgements. The publication contains the results of studies conducted by President’s of Ukraine grant for competitive projects (grant number F74/25879) of the State Fund for Fundamental Research (A.N.M., E.A.E., A.I.K.). S.V.K. acknowledges the Office of Basic Energy Sciences, U.S. Department of Energy. Part of work was performed at the Center for Nanophase Materials Sciences, which is a DOE Office of Science User Facility.
22
APPENDIX A. ELECTROSTATIC EQUATIONS WITH BOUNDARY CONDITIONS Quasi-static electric field inside the ferroelectric film is defined via electric potential as E3 = − ∂ϕ f ∂x3 , where the potential ϕ f satisfies electrostatic equations for each of the medium (gap and ferroelectric film) acquires the form: ∆ϕd = 0 , b ∂2 1 ∂P3 f f ε 33 , + ε ∆ ϕ = 11 ⊥ f ε 0 ∂z ∂ z2
(inside the gap − λ ≤ z ≤ 0 )
(A.1a)
(inside the ferroelectric film 0 < z < h )
(A.1b)
where ∆ is 3D-Laplace operator is ∆, ∆ ⊥ is 2D-Laplace operator. Boundary conditions (BCs) to the system (A.1) have the form: ϕd
z = −λ
=U ,
(ϕ
d
− ϕf )
z =0
=0,
ϕf
z =h
=0,
(A.2a)
∂ϕ f ∂ϕ d b ε 0 ε d + P3 f − ε 0 ε 33 − σ =0 . ∂z ∂z z =0
(A.2b)
APPENDIX B. FREE ENERGY WITH RENORMALIZED COEFFICIENTS If we assume that polarization distribution P3 (x, y, z ) is smooth enough, the coupled nonlinear algebraic equations for the polarization averaged over film thickness P = P3 and surface charge density σ are valid [34-37]: Γ
∂P Ψ (U , σ, P ) , + α R P + βP 3 + γP 5 = ∂t h
The overpotential is given by expression
τ
∂σ + σ = σ 0 [Ψ (U , σ, P )] . ∂t
Ψ (U , σ, P ) =
λ(σ − P ) + ε 0 ε d U h b ε 0 ε d h + λε 33
(
)
(B.1)
and the function
−1
∆Gi00 + eZ i ψ eZ i θ i (ψ ) eZ i 1 + exp ≡∑ σ 0 [ψ ] = ∑ . Electric potentials acting in the dielectric gap Ai k T Ai i i B
( ϕd ) and in the ferroelectric film ( ϕ f ) linearly depends on the coordinate z and overpotential, namely ϕd = U −
z+λ (U − Ψ ) and ϕ f = (h − z ) Ψ (see Fig. 1). λ h
Next we consider the stationary case when one can put σ = σ 0 [Ψ (U , σ, P )] in Eqs.(B.1) and (3). Corresponding free energy G[P, Ψ ] , which formal minimization,
∂G[P, Ψ ] ∂G[P, Ψ ] = 0 and = 0 , leads ∂P ∂Ψ
to Eqs.(B.1), has the form: 2 ε 0 ε d (Ψ − U )2 Ψ G[P, Ψ ] αR 2 β 4 γ 6 b Ψ P + P + P − ΨP − ε 0 ε 33 = h − + ∫ σ 0 [φ]dφ S 4 6 2h 2 λ 2 0
23
(B.2)
The energy (B.2) has absolute minima at high Ψ values. So, according to the Biot's variational principle, let us find for the incomplete thermodynamic potential, which partial minimization over P will give the equations of state, and, at the same time, it has an absolute minimum at finite P values. For the purpose the first of Eq.(B.1) can be considered as an expression for the overpotential dependence on P,
(
)
i.e., Ψ[ P] = h α R P + βP 3 + γP 5 . Substituting here and the above expression for the overpotential Ψ λ(σ0 [Ψ ] − P ) + ε 0ε dU we derived the single equation for the average polarization: = ε 0 ε d h + λε b33 h
)
(
λ α R P + βP + γP = b ε 0 ε d h + λε 33 3
5
(
)
(
)
−1
∆Gi00 + eZ i h α R P + βP 3 + γP 5 eZ i λ P − ε 0 ε dU 1 exp − + ∑ b k BT ε 0 ε d h + λε 33 i =1, 2 Ai
(
)
(B.3) Corresponding potential that minimization over P gives Eq.(9b) has the form: P2 ε dU P4 P6 λ P + α + β + γ + R b 4 6 ε d h + λε b33 ε 0 ε d h + λε 33 2 F [P ] = ∆Gi00 + eZ i h α R p + βp 3 + γp 5 eZ i P λ dp 1 + exp − ∑ b ∫ A k BT h ε ε + λε i 0 33 i =1, 2 0 d
(
(
)
(
)
−1
∆G 00 ∆G 00 + eZ i Ψ ≈ 1 + exp i Assuming that 1 + exp i k BT k BT condition
eZ i Ψ > Landau-Khalatnikov time 0.4 1 - 10 8.85×10⁻¹² 1.6×10⁻¹⁹ Z 1 = +2 , Z 2 = −2
n1 = 2 , n2 = −2
A1 = A2 = 10−18 - 10−19
(eV)
2
0-1
{
}
FIGURE S1. Dependences P(U ) calculated at fixed ∆G100 , ∆G 200 indicated in the labels for a 10-nm PZT
film. Permittivity of the dielectric gap is ε d =1, its thickness λ=0.4 nm and saturation area of the surface ions
A1 = A2 = 10−18 m2, T= 300 K, other parameters are listed in Table SI.
3
{
}
FIGURE S2. Dependences σ(U ) calculated at fixed ∆G100 , ∆G 200 indicated in the labels for a 10-nm PZT
film. Permittivity of the dielectric gap is ε d =1, its thickness λ=0.4 nm and saturation area of the surface ions
A1 = A2 = 10−18 m2, T= 300 K, other parameters are listed in Table SI.
4
{
}
FIGURE S3. Dependences P(U ) calculated at fixed ∆G100 , ∆G 200 indicated in the labels for a 25-nm PZT film. Other parameters are the same as in Fig.S2.
5
(a)
(b)
(c)
(d)
(e)
(f)
FIGURE S4. Dependences of P(U ) (a), σ(U ) (b), σ(Ψ ) (c), ϕ(U ) (d) and E (U ) in the film (e) and in the
{
}
gap (f) vs. the voltage U applied to the top electrode calculated at fixed ∆G100 , ∆G 200 = {0.1,0.1}eV for a 10-nm PZT film [plots (a)-(d), respectively]. ϕ(U ) is calculated at the ferroelectric surface, where the surface ions are located. E (U ) is calculated right below (nonlinear, e) and above (linear, f) the ferroelectric surface Other parameters are the same as in Fig.S2.
6
(a)
(b)
(c)
(d)
(e)
(f)
FIGURE S5. Dependences of P(U ) (a), σ(U ) (b), σ(Ψ ) (c), ϕ(U ) (d) and E (U ) in the film (e) and in the
{
}
gap (f) vs. the voltage U applied to the top electrode calculated at fixed ∆G100 , ∆G 200 = {0.1,0.1}eV for a 10-nm paraelectric film [plots (a)-(d), respectively]. ϕ(U ) is calculated at the ferroelectric surface, where the surface ions are located. E (U ) is calculated right below (nonlinear, e) and above (linear, f) the ferroelectric surface.
7
h=25 nm
0.2
h=50 nm h=100 nm
0
� 0.2 � 0.4 0
(a)
0.6
h=10 nm
Effective field (V/nm)
Effective field (V/nm)
0.4
Eeff(0,∆G)
h=25 nm h=10 nm
Eeff(∆G,0) 0.05
0.1
0.15
Ion formation energy ∆G (eV)
(
0.4
{0.05,1} {0.01,1}
0.2
{0,1}
Ec
0
-Ec
{1,0}
-0.2 -0.4 -0.6 10
0.2
FIGURE S6. (a) Effective field E 0 ∆G100 , ∆G200
{0.1,1}
(a)
{1,0.01} {1,0.05} {1,0.1} 20
50
100
200
Film thickness h (nm)
500
) induced by surface ions calculated in dependence on the
surface ions formation energies ∆Gi00 . Different curves correspond to PZT film thickness h= 10, 25, 50 and 100
(
)
(
)
nm (as indicated by legends). Solid curves are E 0 0, ∆G 200 , and dotted curves are E 0 ∆G100 ,0 . (b) Thickness
[
]
{
}
dependence of effective field E 0 ∆Gi00 , h calculated for several ∆G100 , ∆G 200 values (legends near the curves in eV) and PZT parameters. Positive and negative coercive fields ± EC [h] are shown by dashed curves. Permittivity of the dielectric gap is ε d =1, its thickness λ=0.4 nm and saturation area of the surface ions
A1 = A2 = 10−18 m2, U=0, T= 300 K, other parameters are listed in Table SI.
8
FI NFE
Polarization (C/m2)
0.5
∆G200
0.25 0
unstable states
� 0.25
∆G200
� 0.75
h=300 nm
(a)
0.6
Polarization (C/m2)
200
0
FI
0.4
� 0.2
600
� 0.4
∆G200
�0.8 0
(c)
200
400
∆G200 h=100 nm
0
200
400
600
Temperature (K)
0
NFE
unstable states
� 0.6
unstable states
� 0.5
(b)
∆G200
0.2
∆G200
0.25 0
NFE
FI
� 0.75
Temperature (K)
FE
0
400
0.5
� 0.25
� 0.5
FE
0.75
Polarization (C/m2)
Polarization (C/m2)
FE
0.75
h=50 nm 600
� 0.05 � 0.1
� 0.2 � 0.25
(d)
Temperature (K)
∆G200
� 0.15
� 0.3 0
h=10 nm 200
400
600
Temperature (K)
FIGURE S6. Temperature dependences of the average polarization calculated in the case of screening by ions, zero applied voltage and different values of film thickness h = 300 nm (a), 100 nm (b), 50 nm (c) and 10 nm (d). Each curve in the one-colored group corresponds to the definite value of ∆G 200 = (0, 0.05, 0.1, 0.15, 0.2, 0.9) eV. Arrow indicates the direction of ∆G 200 increase. An arrow indicates the direction of ∆G 200 increase. Unstable branches are shown by blue colors. Permittivity of the dielectric gap is ε d =10, its thickness λ=0.4 nm,
∆G100 = 1eV, and saturation area of the surface ions A1 = A2 = 10−18 m2, U=0, other parameters are listed in Table SI.
9
0.6 0.4 0.2 0
(a)
0
Energy ∆G2 (eV)
1
(c)
Energy ∆G2 (eV)
0.8
1
0
T=600 K h=300 nm P2 (C/m2)
0.2 0.4 0.6 0.8
Energy ∆G1 (eV)
1
0.6
0.2 0.4 0.6 0.8
Energy ∆G1 (eV)
1
0.2 0
1
0.2 0
0.4
(b)
0.4
0
0.6
0
0.20
T=600 K h = 100 nm P1 (C/m2)
0.8
-0.25
0.25
T=600 K h=300 nm P1 (C/m2)
0.8
Energy ∆G2 (eV)
Energy ∆G2 (eV)
1
0.2 0.4 0.6 0.8
Energy ∆G1 (eV)
1
0.16
T=600 K h = 10 nm P1 (C/m2)
0.8 0.6
0
0.4 0.2
-0.20
0
(d)
0
0.2 0.4 0.6 0.8
Energy ∆G1 (eV)
1
-0.16
FIGURE S7. Dependence of the stable polar states on the surface ions formation energies ∆Gi00 calculated for PZT film thickness h= 300, 100 and 10 nm at T= 600 K (legends at the curves). Saturation area of the surface ions
A1 = A2 = 10−18 m2, dielectric gap thickness λ=0.4 nm, its permittivity ε d =10, and U=0, and other parameters are listed in Table SI. Color scale bar is polarization in C/m2. All existing stable and metastable polar states at given thickness and temperature are shown (denoted as the roots P1 and/or P2 of Eq.(14)). Unstable polar sates (denoted as the root P3 of Eq.(14)) are shown in Fig.S8.
10
0.6
Energy ∆G2 (eV)
T=300 K h=100 nm P1 (C/m2)
0.8
1
0.58
0.4 0.2
(a)
0
0.2 0.4 0.6 0.8
Energy ∆G1 (eV)
Energy ∆G2 (eV)
1
0.43
1
0.6
0
0.2 0.4 0.6 0.8
Energy ∆G1 (eV)
1
0
T=300 K h=50 nm P2 (C/m2)
0.6
-0.58
0.4 0.2
0
(c)
0.2 0.4 0.6 0.8
1
(d)
Energy ∆G2 (eV)
0.6
0
Energy ∆G1 (eV)
1
0.6
-0.45
0.20
T=300 K h=10 nm P1 (C/m2)
0.8
0.4
0.2 0.4 0.6 0.8
1
0.29
T=300 K h=25 nm P1 (C/m2)
0.8
0
0
Energy ∆G1 (eV) 1
0.4
0.2
(e)
0
0.8
0.2
0
0.2
1
0.45
0.4
0
0.4
(b)
T=300 K h=50 nm P1 (C/m2)
0.8
0.6
Energy ∆G2 (eV)
0
-0.43
T=300 K h=100 nm P2 (C/m2)
0.8
Energy ∆G2 (eV)
Energy ∆G2 (eV)
1
0.2
0
0.2 0.4 0.6 0.8
Energy ∆G1 (eV)
1
-0.29
(f)
0
0
0.2 0.4 0.6 0.8
1 -0.20
Energy ∆G1 (eV)
FIGURE S8. Dependence of the stable polar states on the surface ions formation energies ∆Gi00 calculated for PZT film thickness h= 100, 50, 25 and 10 nm at T= 300 K (legends at the curves). Saturation area of the surface ions A1 = A2 = 10−18 m2, dielectric gap thickness λ=0.4 nm, its permittivity ε d =10, and U=0, and other parameters are listed in Table SI. Color scale bar is polarization in C/m2. All existing stable and metastable polar states at given thickness and temperature are shown.
11
1
0.6 0.4 0.2
0.2 0.4 0.6 0.8
Energy ∆G1 (eV)
1
0.6 0.4 0.2 0
0.2 0.4 0.6 0.8
Energy ∆G1 (eV)
1
0.6 0.4 0.2 0
(j)
0.2 0.4 0.6 0.8
Energy ∆G1 (eV)
1
0.2 0
(c)
T=300 K h=10 nm P1 - stable P2, 3 - absent
0.8 0.6 0.4 0.2 0
0.2 0.4 0.6 0.8
Energy ∆G1 (eV)
1
0
0.8 0.6 0.4 0.2 0
0.2 0.4 0.6 0.8
Energy ∆G1 (eV)
1
0.4 0.2 0
(k)
1
0
0.2 0.4 0.6 0.8
Energy ∆G1 (eV)
1
0.6 0.4 0.2 0
0.2 0.4 0.6 0.8
Energy ∆G1 (eV)
0.6 0.4 0.2 0
0
1
1
T=300 K h=100 nm P1 - stable
0.8 0.6 0.4 0.2 0
(i)
0
0.2 0.4 0.6 0.8
Energy ∆G1 (eV)
1
T=300 K h=300 nm P1,2 – stable -P3 - unstable
0.8 0.6 0.4 0.2 0
(l)
0.2 0.4 0.6 0.8
Energy ∆G1 (eV)
1
T=300 K h=100 nm P3 - unstable
0.8
T=300 K h=50 nm P1 - metastable
0.8
1
T=300 K h=50 nm P3 - unstable
0.6
0
0.2 0.4 0.6 0.8
Energy ∆G1 (eV)
(f)
Energy ∆G1 (eV)
1
T=300 K h=100 nm P2 - metastable
1
0.2 0.4 0.6 0.8
0.8
(h)
0 1
(e)
Energy ∆G2 (eV)
Energy ∆G2 (eV)
1
0
0
(b)
Energy ∆G2 (eV)
Energy ∆G2 (eV)
T=300 K h=50 nm P2 - stable
0.8
(g)
0
1
1
0
0.2
0.4
Energy ∆G2 (eV)
Energy ∆G2 (eV)
T=600 K h≤ 100 nm P1 - stable P2, 3 - absent
0.8
(d)
0.4
0.6
1
1
0
0.6
T=600 K h=300 nm P3 - unstable
0.8
Energy ∆G2 (eV)
(a)
0
0.8
Energy ∆G2 (eV)
0
1
T=600 K h=300 nm P2 - stable
Energy ∆G2 (eV)
Energy ∆G2 (eV)
T=600 K h=300 nm P1 - metastable
0.8
Energy ∆G2 (eV)
Energy ∆G2 (eV)
1
0
0.2 0.4 0.6 0.8
Energy ∆G1 (eV)
1
FIGURE S9. Stable, metastable and unstable polar states in dependence on the surface ions formation energies
∆Gi00 calculated for PZT film thickness h= 10, 50, 100 and 300 nm and T= 600, 300 K (legends at the curves). Saturation area of the surface ions A1 = A2 = 10−18 m2, dielectric gap thickness λ=0.4 nm, its permittivity ε d =10, and U=0, and other parameters are listed in Table SI.
12