PHYSICAL REVIEW B 75, 245204 共2007兲
Effect of temperature- and composition-dependent deep level energies on electrical compensation: Experiment and model of the Cd1−xZnxTe system Michael Prokesch* and Csaba Szeles eV PRODUCTS a division of II-VI Incorporated, 373 Saxonburg Boulevard, Saxonburg, Pennsylvania 16056, USA 共Received 24 January 2007; revised manuscript received 2 April 2007; published 13 June 2007兲 The effect of temperature and composition dependences of deep level ionization energies in semi-insulating compound semiconductors is investigated and illustrated in the example of the ternary Cd1−xZnxTe system. Those dependences are determined by the behavior of the band extrema in an absolute energy scale and the actual nature of a particular defect, which controls its relation to the host crystal states. Examples for the interpretation of experimental temperature and composition dependences of critical charge transport parameters are given. DOI: 10.1103/PhysRevB.75.245204
PACS number共s兲: 71.55.Gs, 07.85.Fv
I. INTRODUCTION
Despite significant commercial success and nearly half a century of research in the field of wide-band-gap compound semiconductors, fundamental understanding of electrical compensation and charge transport controlling defects and associated electronic processes in this material class is not adequate.1,2 A general problem is the extremely limited availability of reliable and relevant direct defect data, which is caused by either technical or even fundamental limitations. This is especially true for deep energy levels corresponding to point defects of completely different nature and properties 共e.g., foreign impurities like transition metals, native defects, defect complexes, etc.兲 that can control the semiconductor’s properties already at concentrations well below the detection limits of standard spectroscopic techniques. In semiinsulating semiconductors, the dominating role of these defects in the control of electrical compensation leads to some—often overlooked—implications that can significantly complicate the modeling of electrical and charge transport properties. This concerns the interpretation of experimental temperature and composition dependences of critical charge transport parameters, which we will try to illustrate in this work in the example of semi-insulating 共SI兲 CdZnTe, a ternary compound of special importance for applications in room-temperature photon and particle detection.3
II. DEEP LEVEL COMPENSATION
Electrically compensated Cd1−xZnxTe, as used for radiation detector fabrication, can be obtained with a roomtemperature 共RT兲 resistivity of several 1010 ⍀ cm. This requires “majority” carrier concentrations below 106 cm−3. The theoretical maximum resistivity max is reached when the drift-mobility-concentration products of free electrons and holes 共nn and p p兲 are equal, which gives
max =
1
, 2qni冑n p
shallow shallow deep ⱕ 兺 ND_j + 兺 ND_k , 兺i NA_i j k shallow shallow deep ⱕ 兺 NA_i + 兺 NA_l , 兺j ND_j i l
共2兲
which simply means that the total concentration of all shalshallow , must be smaller than the total conlow acceptors, NA_i shallow deep and ND_k . centration of all shallow and deep donors, ND_j At the same time, the total concentration of the shallow doshallow , has to be smaller than the total concentration nors, ND_j shallow deep and NA_l . Condition 共2兲 remains of all acceptors, NA_i fully valid if defects with multiple charge states are individually indexed for each of their energy levels. Note that the formulation given in Ref. 5 is a special scenario within this condition. It is to be pointed out, however, that a simple comparison of the total numbers of donors and acceptors does not necessarily predict the conduction type of SI material as this also depends on the actual DL ionization energies. III. BAND EDGES IN ABSOLUTE ENERGY SCALE
共1兲
where q is the elementary charge and ni = 冑np the intrinsic carrier concentration. Equation 共1兲 follows directly from = 1 / q共nn + p p兲 for nn = p p. Using the parameters 1098-0121/2007/75共24兲/245204共7兲
from Ref. 4 at 296 K and 10% Zn—which is the technologically most interesting and commercially readily available Cd1−xZnxTe composition—one obtains max ⬃ 1 ⫻ 1011 ⍀ cm. At this point, the conduction type would be indefinite and the hole concentration pˆ = ni冑n / p ⬃ 6 ⫻ 105 cm−3, which is about 20 times higher than the corresponding electron concentration 共inverse mobility ratio兲. In practice, semi-insulating CZT will have a slightly lower RT resistivity and be either slightly n-type or slightly p-type. In any event, such low free-carrier concentrations cannot be achieved by matching of shallow level defect concentrations by any technologically practical means but requires the contribution of deep 共close to midgap兲 levels. We suggest the following formulation as a general condition to obtain SI semiconductor crystals by deep level 共DL兲 compensation:
For many modeling purposes knowledge of the temperature 共T兲 and composition 共mole fraction x兲 dependence of the band gap EG共T , x兲 is sufficient. This dependence is experimentally accessible by, e.g., photoluminescence and reflec-
245204-1
©2007 The American Physical Society
PHYSICAL REVIEW B 75, 245204 共2007兲
MICHAEL PROKESCH AND CSABA SZELES
tance or optical transmission measurements and can be expressed as an approximating matrix: EG共T,x兲 = EG共0K,CdTe兲 + a1x + a2x2 −
a 3T 2 , a4 + T
共3兲
where the ai are experimental or adjusted parameters.4 However, a more comprehensive and relevant modeling of the electrical compensation and charge transport properties requires knowledge of the temperature and composition dependences of the band extrema and relevant defect levels with respect to a host-crystal-independent reference level— i.e., on an absolute energy scale.6 Though some data on band offsets in heterostructures are available 共e.g., Ref. 7 and references therein兲, there is only limited experimental information about the temperature and composition behavior of band edges in individual bulk compounds. An often overlooked problem is that the energy levels of certain point defects may or may not closely follow either of the band-edge dependences EC共T , x兲 or EV共T , x兲, which can lead to significantly different temperature and/or concentration dependences of the relevant ionization energies. This depends on the nature of the respective defect and with which band a certain energy level communicates. This is of critical importance when spectroscopic energy data of deep level defects, which are usually obtained by methods like photo electron paramagnetic resonance 共photo-EPR兲 or optically detected magnetic resonance 共ODMR兲 at very low temperatures 共e.g., Refs. 8 and 9兲 are used for the modeling of RT of even hightemperature defect equilibria 共at crystal growth, ingot cooldown, or annealing temperature兲. Defects that play an important role in charge trapping at RT may not even have an energy level in the forbidden gap at crystal growth temperature. This effect has to be also considered in the analysis of temperature-dependent high-precision resistivity measurements of SI material 共see Sec. V兲. Our approach to this problem is to define the valanceband edge of the pure binary CdTe at 0 K as the reference energy 共e.g., zero兲 and add a linear temperature correction: EV共T,x兲 = EV共0K,CdTe兲 + ␣TT.
共4兲
The linear temperature coefficient ␣T = −10−4 eV/ K has been taken from a theoretical work.10 On the other hand, following common anion reasoning,11 the composition-related valence-band offset should be rather small in the CdTe-ZnTe system. Though x-ray photoelectron spectroscopic results on CdTe-ZnTe heterostructures may indicate a small offset 共e.g., ⬃0.1 eV in Ref. 12兲, those strainaffected interface data may not be representative of bulk binary crystals, possible effects of interface dipoles on band lineups aside.13 Furthermore, this small valence-band offset is in the error range of zero-strain offset estimates.14 In addition, the interesting Zn concentration range in the Cd1−xZnxTe system—relevant for detector applications—is typically 共5–15兲%, so that even a 共hypothetical兲 0.1 eV offset between the two binaries would translate to only a ⬃10 meV shift of the absolute valence-band maximum position at a given temperature. This is small compared to the ⬃47 meV RT band-gap variation over the same composition range, so
FIG. 1. Theoretical temperature dependences of the fundamental band edges 共CB and VB兲 according to Eqs. 共3兲–共5兲, hydrogenic donor and acceptor levels 共DH and AH兲 according to Eq. 共6兲, and intrinsic Fermi level 共Ei兲 according to Eq. 共7兲 for Cd0.9Zn0.1Te in an absolute energy scale. CMP: congruent melting point.
that the complete omission of the Zn concentration dependence, which would add a term to Eq. 共4兲 can be justified. Eventually, with Eqs. 共3兲 and 共4兲, the conduction-band edge in absolute energy scale is defined as EC共T,x兲 = EV共T,x兲 + EG共T,x兲.
共5兲
IV. TEMPERATURE DEPENDENCE OF IONIZATION ENERGIES A. Delocalized, hydrogenic defects
Delocalized, hydrogenic donor and acceptor states are made of the respective band states and therefore, can be expected to energetically follow the temperature and composition dependences of the band extrema EC共T , x兲 or EV共T , x兲. The ionization energies of those 共usually shallow兲 defects are therefore temperature independent, in a first approximation. This is illustrated in Fig. 1 in an absolute energy scale. The ionization energy of an ideal hydrogenic level can be estimated by ef f ⬃ EH
m* ⫻ 13.6 eV − E pot , m 0 r
共6兲
where m * / m0 is the relative carrier effective mass in the respective band and r is the static dielectric constant of the semiconductor, which we assume to be temperature independent in a first approximation. E pot describes the lowering of the effective ionization energy in case of high net-doping concentrations 共e.g., Ref. 15兲. However, E pot should be practically zero in semi-insulating material. Also shown in Fig. 1 is the intrinsic Fermi level, which is, per definition, EI共T,x兲 = EV共T,x兲 +
冉 冊
m* EG共T,x兲 3 − kBT ln *e , 2 4 mh
共7兲
where kB is the Boltzmann constant and m*e and m*h are the electron and hole effective masses. The intrinsic Fermi level
245204-2
PHYSICAL REVIEW B 75, 245204 共2007兲
EFFECT OF TEMPERATURE- AND COMPOSITION-…
is at midgap for T = 0 but—due to the smaller effective mass of the electrons—deviates to the upper half of the forbidden gap as the temperature increases, though it moves down in absolute energy. B. Transition metals
Some foreign impurities like transition metals 共TMs兲 generate highly localized states with energy levels that are generally independent of the host crystal and may even serve as a guide to predict band-gap discontinuities in semiconductor heterojunctions.6 Consequently, they are not expected to closely follow any EC共T , x兲 or EV共T , x兲 trends. Instead, we assume them to be temperature independent on an absolute energy scale; i.e., their ionization energies will critically depend on the actual energy position of the respective band edge at a given temperature. C. Native defects
We are not aware of any detailed theoretical investigation of the temperature and compositional dependences of the energy levels of native defects, so we apply the following reasoning. Native defects 共NDs兲 are built up entirely from host atom orbitals, which also generate the band states. The assumption that, e.g., the cation vacancy and Te antisite 共TeCd兲 states in CdZnTe are primarily built up by Te orbitals would imply at least some coupling to the valence band共s兲, or, in general, defects that are built up from anion orbitals are assumed to follow the valence-band dependences EV共T , x兲. In this case, their ionization energies change with the temperature 共and composition of the ternary compound兲 if the associated energy levels communicate with the conduction band 共donor states兲 but are rather temperature independent if they generate acceptor states. The opposite is applied to defects built up by cation orbitals. Though this type of behavior seems to be suggested by some experimental data on certain native defects in II-VI compounds,16 there may be additional contributions from the whole Brillouin zone, which can be expected to blur the “trends” by producing at least some degree of localization of the wave functions of the corresponding states,17 so that, in practice, a perfect temperature independence of the ionization energy should never be expected. Also, a closer look at the ways some of the data, collected in Ref. 16, were actually obtained or derived may leave at least some question marks.18 Note that the here mentioned defects are purely hypothetical examples at this point; e.g., the TeCd antisite is a popular theoretical candidate to participate in the compensation in some form.19 However, we are not aware of any direct spectroscopic evidence of the existence of isolated antisite defects in any of the II-VI compounds 共e.g., by means of EPR, ODMR, etc.兲. Isolated interstitial defects—if they were stable at RT— could exist in two different configurations in the zinc-blende lattice and may even undergo cyclic conversions between the tetrahedral sites surrounded by four Cd/ Zn atoms and those surrounded by four Te atoms.20 Direct detection of this de-
FIG. 2. Theoretical temperature dependence of the fundamental band edges 共CB and VB兲 according to Eqs. 共3兲–共5兲, idealized transition metal levels 共TM-i and TM兲 as explained in the text, and a “cation-orbital native defect” 共CO-ND兲 in Cd0.9Zn0.1Te in an absolute energy scale. CMP: congruent melting point.
fect type, however, has been only successful after generation of Frenkel pairs by particle irradiation at very low temperatures and even the farthest separated pairs annihilated well below RT by migration of the interstitial.21 It is important to note that in those experiments a metastable nonequilibrium has been produced and the crystal will minimize its total energy as soon as thermally possible. However, if the interstitial defect is generated as part of a self-compensation process 共e.g., in response to impurity doping at high temperatures兲, the existence of RT stable point-defect complexes involving interstitial defects cannot be excluded. Point-defect complexes should show a behavior somewhere in between the extreme cases outlined above. As an example, A center-like complexes 共cation vacancy bound to a donor impurity兲 may behave slightly different dependent on whether the participating donor state is delocalized or arises from a transition-metal-like impurity. Moreover, the influence of the actual donor on the electron distribution of the A center should be less significant if the donor occupies a cation site like most group-III elements and transition metals in II-VI materials, because in this case the donor represents only the next-nearest neighbor of the dominating vacancy defect. Sometimes, simple configurational considerations can already explain the trend of differences in measured A center ionization energies with respect to the “undisturbed” vacancy defect.9 In general, the distortion of the vacancy’s electron distribution by the donor atom can be expected to be rather small. In fact, reported A-center energies closely follow the isolated vacancy,16 of course ignoring possible experimental uncertainties or misinterpretations. Figure 2 compares the situations for a transition-metallike impurity 共TM兲 and an idealized native defect built of cation orbitals 共ND兲. The two energy levels coincide at RT, and both could serve to pin the Fermi level at midgap but they behave very different when the temperature changes. The change in the ionization energies will be strongest if the TM is a donor and the ND is an acceptor. On the other hand, if the TM impurity is an acceptor, it would still show some temperature dependence, whereas a native donor’s ionization energy would be temperature independent. Also shown in
245204-3
PHYSICAL REVIEW B 75, 245204 共2007兲
MICHAEL PROKESCH AND CSABA SZELES
all positive charges 共ionized donor states, ND_n, and free holes, p兲. The km and kn indicate the actual charge states 共1 , 2 , . . . 兲. The individual concentrations of each species are given by the Fermi statistics. As an example, the ionized + concentration ND_j of a single donor j with total concentration ND_j and degeneracy gD_j is entirely determined by the energy difference between its 0/⫹ transition level ED_j and the Fermi energy EF: + ND_j 共T,x兲 = ND_j
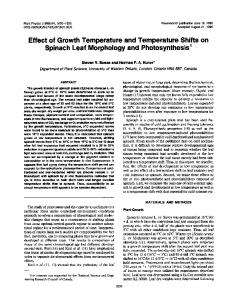
FIG. 3. Temperature-dependent bulk resistivity measurement on CdZnTe 共13.8% Zn兲. Open circles: experimental data. Straight lines: scenario fits 共1兲–共3兲; see Sec. V for details. The linear-scale inset shows the very small differences between the fits in a 15 K temperature window.
Fig. 2 is an intermediate TM level 共TM-i兲—i.e., a level that could significantly influence the detector properties at RT by contributing detrapping to the charge transport with time constants in the order of the experimental time scale 共typically the transit time of the carriers in the detector device兲. However, this energy level would only move into the forbidden gap at some point during crystal cooldown from the growth temperature. At high temperature the defect level is in the conduction band. 共The right temperature edge in Fig. 2 corresponds to the congruent melting point of Cd0.9Zn0.1Te.兲 V. TEMPERATURE-DEPENDENT RESISTIVITY
Traditional four-probe techniques 共e.g., van der Pauw measurements of resistivity and Hall coefficient兲 are often not applicable to SI material because of significant surface contributions, so that a guarded low-bias two-probe measurement sometimes represents the only way to obtain reliable bulk resistivity data.4 Figure 3 shows the result of a temperature-dependent resistivity measurement on an SI-CdZnTe crystal sample. The bulk resistivity changes by almost five orders of magnitude in the 共258– 358兲 K temperature range. Even though it was straight forward to incorporate a drift mobility correction in our model routines, this was not a critical contribution. The actual temperature dependence of the carrier mobilities in SI material does not significantly affect the 共T兲 slope, so that a pure 共T兲 measurement directly yields information about the temperature dependence of the free-carrier concentrations. The calculation of the free-carrier and ionized-defect concentrations is based on the solution of the charge-neutrality condition, which may be expressed as 共−km兲 共+kn兲 = p + kn 兺 ND_n ; n + km 兺 NA_m m
共8兲
n
i.e., the number of all negative charges 共ionized acceptor states, NA_m, and free electrons, n兲 has to equal the number of
冉
1
ED_j共T,x兲 − EF共T,x兲 1 + gD_j exp − k BT
冊
, 共9兲
where kB is the Boltzmann constant and T is the temperature. 共Note the general temperature and composition dependence of the dopant level.兲 Similar equations apply for ionized acceptors. The degeneracy factors, however, may be different for donors and acceptors depending on the band structure of a given semiconductor.22 Once the neutrality equation is solved for EF, all individual ionized fractions including the free-carrier concentrations can be obtained. The free-electron concentration n is given by
冉
冊
EC共T,x兲 − EF共T,x兲 n 共T,x兲 = exp − , NC k BT
共10兲
where EC is the conduction-band minimum energy according to Eqs. 共3兲–共5兲 and NC is the conduction-band density of states. Each term of the neutrality equation 共8兲—including the free-carrier concentration terms—contributes one order; i.e., for instance, a three-level model corresponds to a fifthorder polynomial equation in EF, though in many practical cases all shallow donors and acceptors can be summarized in a single net shallow doping term, comprising only the difference of the total shallow acceptor and shallow donor concentot tot − NDS 兲, which reduces the overall numerical eftrations 共NAS fort. In presence of a multitude of deep levels, the 共T兲 dependence may be governed by more than one defect species, and if no additional experimental information is available, the same experimental 共T兲 dependence can be fitted by an infinite variety of scenarios involving different ionization energies. Here, we want to show that already in the most simple 共although very important practical scenario兲 case of one dominating deep level species, the obtained ionization energy will depend on the actual nature of the defect 共e.g., TM or ND兲. Furthermore, a 共T兲 measurement does not provide any information on the donor or acceptor nature of the deep level; i.e., the same data can be fitted by either a deep donor or deep acceptor model. In order to resolve this ambiguity, additional experimental data, such as majority-carrier-type measurements, have to be obtained and used within one consistent defect model. On the other hand, the 共T兲 measurement is extremely sensitive to even small 共⬍0.01 eV兲 changes in the 共effective兲 deep level ionization energies in compensated SI material and, hence, provides a sensitive tool to study those: In Fig. 3, the experimental 共T兲 data are fitted with different scenarios where a net concentration of shallow donors and acceptors is
245204-4
PHYSICAL REVIEW B 75, 245204 共2007兲
EFFECT OF TEMPERATURE- AND COMPOSITION-…
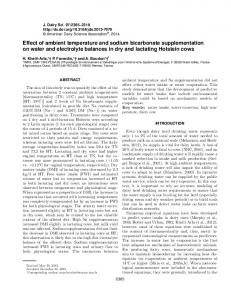
FIG. 4. Illustration of confidence range for 共T兲 fits. Open circles: experimental data from Fig. 3. Straight line: scenario 共1兲 with 20-meV lower effective ionization energy. Dotted line: theoretical behavior of pure 共intrinsic兲 material.
compensated by a single species of deep acceptors and donors. The Zn mole fraction of this crystal sample was 0.138 and the general material parameters were taken from Ref. 4. The experimental data are actually a double set consisting of a primary and a control resistivity measurement at each temperature. If the 共T兲 dependence is the only experimental data set to be explained, the absolute deep level defect and net shallow level doping concentrations are of no importance to the fit. In case of a simple three-level model with a deep donor 共DD兲, a shallow acceptor 共SA兲, and a shallow donor 共SD兲 the controlling parameters are the deep level ionization energy and 0 , which is the ratio of the the “overcompensation ratio” ⌽D/S total deep level concentration to the shallow-shallow compensation offset—e.g.,
0 = ⌽D/S
tot NDD tot tot NAS − NDS
.
共11兲
0 ⬎ + 1. Note that the material is semi-insulating for ⌽D/S The following three scenario fits, yielding almost undistinguishable graphs, are shown in Fig. 3: 共i兲 native cation orbital donor with a temperature-independent ionization en0 = 7.93, 共ii兲 native anion orbital acergy of 0.79 eV and ⌽D/S ceptor with a temperature-independent ionization energy of 0 = 17.0, and 共iii兲 transition-metal-like 0.79 eV and ⌽D/S donor with a 0 / + transition level, fixed in absolute energy scale at a position corresponding to 0.64 eV below the 296 K conduction-band edge of CdZnTe with 13.8% Zn 0 = 1.02. and ⌽D/S Of course, all the ambiguity can be removed when additional experimental data are available and included in the same model that will allow to eliminate some of these scenarios. Here, however, we only want to emphasize the fact that one and the same 共T兲 data set can be fitted with different RT ionization energies of the compensating deep level in dependence on the actual nature of the assembly defect states in the sample.
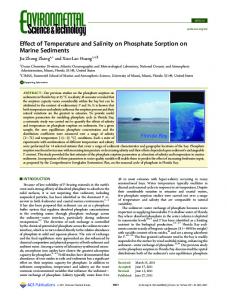
FIG. 5. Measured Zn segregation along the growth axis of a typical gradient-freeze CdZnTe ingot 共nominal 10% Zn兲. Solid circles: experimental data. Solid line: Gulliver-Scheil fit according to Eq. 共12兲 with kZn = 1.32.
Figure 4 illustrates the sensitivity of such scenario fits to small changes in the effective ionization energy: The straight line corresponds to scenario 共i兲 with a 20 meV lower deep 0 donor ionization energy of 0.77 eV 共⌽D/S = 4.13兲, which obviously yields a poor fit. Also shown in Fig. 4 is the theoretical temperature dependence for the ideal intrinsic case. VI. COMPOSITION DEPENDENCE OF IONIZATION ENERGIES
Cd1−xZnxTe crystals, grown from the melt by directional solidification, can show a significant Zn segregation from tip 共first to freeze兲 to heel 共last to freeze兲 so that all molefraction- 共x-兲 related quantities, especially, the band gap according to Eq. 共3兲, become functions of the axial position in the ingot. Figure 5 shows an axial Zn concentration profile of a typical Cd1−xZnxTe ingot with nominal 10% Zn, grown with the high-pressure electrodynamic gradient-freeze technique at eV Products.23 The mole-fraction data were obtained from Fourier-transform infrared 共FTIR兲 transmission measurements by comparing the wavelengths at a certain threshold absorption coefficient at the fundamental edge with those of calibration standards.24 The experimental profile shows a decrease of the Zn concentration from about 14% in the tip to 6% in the heel and can be fitted by Gulliver-Scheil segregation:25,26 x共z兲 ⬀ 共1 − z兲kZn−1 ,
共12兲
which may imply complete mixing of the melt and no significant Zn diffusion in the solid 共z: solidified fraction兲. The obtained Zn segregation coefficient is kZn ⬃ 1.32. Following the same arguments as for the temperature dependence in Sec. IV, we expect a much stronger composition dependence of the ionization energies of transition-metal-like defects than for defects with shallow, delocalized states. According to Eq. 共6兲, the ionization energies of ideal hydrogenic defects depend primarily on the static dielectric constant of the semiconductor and on the effective masses of the carriers in the respective bands, which may be both compo-
245204-5
PHYSICAL REVIEW B 75, 245204 共2007兲
MICHAEL PROKESCH AND CSABA SZELES
FIG. 6. Absolute energy scale presentation of the axial position dependence of the fundamental RT band edges 共CB and VB兲 and a deep localized donor level 共TM兲 according to the Zn segregation profile from Fig. 5. The deep donor ionization energy decreases from tip to heel 共arrows兲. CB-0: conduction-band edge at tip composition.
FIG. 7. RT resistivity profile measurement along the growth direction of the CdZnTe ingot from Fig. 5. Up and down tipped triangles: experimental data from Ref. 4 共two adjacent axial rows of test parts兲. Straight lines: theoretical profiles for 共a兲 composition independent and 共b兲 composition-dependent deep level ionization energies 共see Sec. VII for details兲.
sition dependent. However, the uncertainty in the available experimental data 共sometimes already for either of the pure binaries兲 is usually too large to implement a reasonable correction for the small composition ranges of interest. Eventually, other effects may influence the ionization energies more dramatically—e.g., spontaneous AX or DX center formation, which can be caused by energetically favorable configurational deviations of an impurity atom from the ideal substitutional lattice position in dependence on its chemical nature and the composition of the host crystal.27 In the following, we keep the shallow level ionization energies independent of the composition but fix the transition metal levels in an absolute scale while shifting the band edge energies EV共x兲 and EC共x兲 according to the actual composition. For native defects, we proceed the same way as we did for the temperature dependences in Sec. IV; i.e., those that are built up primarily from cation orbitals are assumed to follow the conduction band. Their ionization energies change with the composition if the associated energy levels communicate with the valence band but are composition independent if they generate donor states. The opposite is applied to anion-orbital defects. This “convention” highlights the dramatic effect that the nature of deep level defects can have on the tip-to-heel resistivity profiles. Figure 6 illustrates the change of the absolute-scale RT band-edge energies from tip to heel of a gradient-freezegrown CdZnTe ingot according to Eqs. 共3兲–共5兲 and the Zn segregation profile from Fig. 5 as a function of the solidified fraction.
temperature normalized 共to 296 K兲 axial bulk resistivity profile was measured.4 Two calculated model profiles are also shown in Fig. 7: Both profiles are obtained from a deep donor compensation model and with the same overcompensation ratio of 0 = 10.1, constant over the entire crystal length, which ⌽D/S corresponds to the ideal case of no segregation of foreign impurities and/or native defects along the growth axis of the single-phase crystal. For curve 共a兲, we assumed a concentration-independent deep donor ionization energy of 0.79 eV 共e.g., Cd orbital native defect兲 and obtained a rather poor match with the experimental profile. In the case of curve 共b兲, the deep donor level is assumed to be generated by a TM-like impurity and has a 0 / + transition level, fixed in absolute energy scale at a position corresponding to 0.79 eV below the 296 K conduction-band edge of CdZnTe with 10% Zn; i.e., the ionization energy is composition dependent and matches the one used for profile 共a兲 only in one point 共10% Zn at z ⬃ 0.71兲. Note, however, that even if profile 共b兲 yields a fair fit to the experimental resistivity data, it is not a proof of the TM character of the deep level as the same curve can be generated by tip-to-heel segregation of impurities and/or native defects. Also, the ionization energy used is not a meaningful parameter that can be extracted from a resistivity profile alone as the same fit can be obtained with any 0 . ionization energy by appropriately “adjusting” ⌽D/S
VII. TIP-TO-HEEL RESISTIVITY PROFILES
Figure 7 shows an experimental resistivity profile, obtained at RT along the growth direction of the CdZnTe ingot from Fig. 5. Two axial rows of 共5 ⫻ 5 ⫻ 2兲 mm3 test crystals have been cut out from tip to heel. The samples were fabricated into test devices in guard electrode configuration, and a
VIII. SUMMARY
The effect of temperature and composition dependences of deep level ionization energies on electrical compensation has been investigated in the example of the ternary Cd1−xZnxTe system. In order to achieve a more realistic interpretation of our experimental results, we implemented a temperature- and composition-dependent definition of the band-edge energies with respect to a host-crystalindependent reference level into the model calculations. The
245204-6
PHYSICAL REVIEW B 75, 245204 共2007兲
EFFECT OF TEMPERATURE- AND COMPOSITION-…
different, possible relations between the energy states of deep level defects of different nature and the band states are discussed. We demonstrated the dramatic effect of the actual defect nature on the fit results obtained from experimental temperature- and composition-dependent measurements of the electrical bulk resistivity. The potential impact of temperature-dependent ionization energies on high-
This work has been supported in part by the U.S. Army Armament Research, Development, and Engineering Center 共ARDEC兲 under Contract No. DAAE 30-03-C-1171.
*Corresponding author. Electronic address:
[email protected]
14 H.
de Nobel, Philips Res. Rep. 14, 430 共1959兲. F. Neumark, Mater. Sci. Eng., R. 21, 1 共1997兲. 3 T. E. Schlesinger, J. E. Toney, H. Yoon, E. Y. Lee, B. A. Brunett, L. Franks, and R. B. James, Mater. Sci. Eng., R. 32, 103 共2001兲. 4 M. Prokesch and Cs. Szeles, J. Appl. Phys. 100, 014503 共2006兲. 5 G. F. Neumark, Phys. Rev. B 26, 2250 共1982兲. 6 J. M. Langer and H. Heinrich, Phys. Rev. Lett. 55, 1414 共1985兲. 7 W. Faschinger, J. Cryst. Growth 197, 557 共1999兲. 8 G. D. Watkins, in Defect Control in Semiconductors, edited by K. Sumino 共Elsevier, Amsterdam, 1990兲, p. 933. 9 K. Irmscher and M. Prokesch, Mater. Sci. Eng., B 80, 168 共2001兲. 10 S. Krishnamurthy, A.-B. Chen, A. Sher, and M. van Schilfgaarde, J. Electron. Mater. 24, 1121 共1995兲. 11 W. R. Frensley and H. Kroemer, Phys. Rev. B 16, 2642 共1977兲. 12 B. Späth, J. Fritsche, F. Säuberlich, A. Klein, and W. Jaegermann, Thin Solid Films 480–481, 204 共2005兲. 13 W. A. Harrison and J. Tersoff, J. Vac. Sci. Technol. B 4, 1068 共1986兲. 1 D. 2 G.
temperature compensation models has been pointed out. ACKNOWLEDGMENT
Mathieu, A. Chatt, J. Allegre, and J. P. Faurie, Phys. Rev. B 41, 6082 共1990兲. 15 M. Prokesch, K. Irmscher, H. Makino, and T. Yao, Mater. Sci. Semicond. Process. 4, 601 共2001兲. 16 B. K. Meyer and W. Stadler, J. Cryst. Growth 161, 119 共1996兲. 17 C. Wetzel, W. Walukiewicz, E. E. Haller, J. Ager III, I. Grzegory, S. Porowski, and T. Suski, Phys. Rev. B 53, 1322 共1996兲. 18 J. W. Allen, Semicond. Sci. Technol. 10, 1049 共1995兲. 19 S.-H. Wei and S. B. Zhang, Phys. Rev. B 66, 155211 共2002兲. 20 K. H. Chow and G. D. Watkins, Phys. Rev. B 60, 8628 共1999兲. 21 G. D. Watkins, J. Cryst. Growth 159, 338 共1996兲. 22 J. A. van Vechten, in Handbook on Semiconductors III, edited by S. P. Keller 共North-Holland, Amsterdam 1980兲. 23 Cs. Szeles, S. E. Cameron, S. A. Soldner, J.-O. Ndap, and M. D. Reed, J. Electron. Mater. 33, 742 共2004兲. 24 FTIR measurements and mole-fraction conversion by J.-O. Ndap, eV Products, 2005. 25 G. H. Gulliver, J. Inst. Met. 9, 120 共1913兲. 26 E. Scheil, Z. Metallkd. 34, 70 共1942兲. 27 D. J. Chadi and C. H. Park, Mater. Sci. Forum 196–201, 285 共1995兲.
245204-7