Parallelismâ, Communications in Computer and Information Science, vol. 257, (2011) ... He received the BS degree in Computer Science under the Bachelor's.
International Journal of Multimedia and Ubiquitous Engineering Vol.9, No.4 (2014), pp.199-208 http://dx.doi.org/10.14257/ijmue.2014.9.4.21
Effective Monitoring Memory Operations for Dynamic Race Detection through Hierarchical Filtering Method Ok-Kyoon Ha1 and Yong-Kee Jun2 1
Engineering Research Institute, Gyeongsang National University 2 Department of Informatics, Gyeongsang National University {jassmin, jun}@gnu.ac.kr Abstract
Data races are the hardest defect to handle in multithreaded programs due to the nondeterministic interleaving of concurrent threads. It incurs the expensive costs of dynamic data race detection to monitor all of memory operations to shared memory locations. This paper presents a hierarchical filtering method that removes unnecessary monitoring memory operations from three levels of binary image, and evaluates empirically the effectiveness of the filtering method for dynamic data race detection. The empirical results using a set of benchmarks show that our filtering method reduces the average runtime overhead to over 50% of dynamic data race detection. Keywords: Dynamic data race detection, monitoring, memory operations, filtering
1. Introduction Multithreaded programming is becoming a natural consequence to achieve improved performance of applications in multi-core systems. However, it is still difficult to ensure the reliability of the programs due to concurrency bugs which cause the potential for subtle interactions between concurrent threads, because the concurrency bugs are hard to reproduce with traditional sequential testing or debugging methods due to the non-deterministic interleaving of concurrent threads. Data races [1-2] are the most notorious class of concurrency bugs that occur when two concurrent threads access a shared memory location without proper synchronization, and one of them is a write. It is important to detect data races for debugging multithreaded programs, because they may lead to non-intended results. Detection techniques can be classified into static analysis [3-5] which analyzes source codes without any execution and dynamic analysis [6-16] which locates data races from an execution of multithreaded program. Dynamic analysis for detecting data races usually uses an instrumentation framework to insert extra codes into target sources or binaries for monitoring every memory and thread operation. Binary instrumentation is more useful than source code instrumentation, because it is possible to precisely trace the execution of target programs without source codes and its analysis. Generally, dynamic race detectors can reduce additional runtime overhead by improving detection algorithm or inserting minimal monitoring codes [13]. This paper presents a hierarchical filtering method that removes unnecessary monitoring of memory operations for inserting minimal monitoring codes. For the minimal insertion of monitoring codes, we use three levels of binary image which consists of binary object images, sections, and instructions. We evaluate empirically the effectiveness of our method by applying the experimentation of
ISSN: 1975-0080 IJMUE Copyright ⓒ 2014 SERSC
International Journal of Multimedia and Ubiquitous Engineering Vol.9, No.4 (2014)
dynamic data race detection with a set of benchmarks. The empirical results show that our filtering method reduces the average runtime overhead to over 50% of dynamic data race detection. 1 2 3 4 5 6 7 8 9 10 11 12 13 14 15 16 17 18
… int SV = 0; /* a shared variable */ const int temp1 = 3; … void *func1 (void *t) { … SV = temp1+4; … } … int main (void) { … res = pthread_create(&t1, NULL, func1, NULL); int temp; temp = SV+1; res = pthread_join(t1, NULL); printf("Final SV, temp: %d, %d\n", SV, temp); …
T1
fork ( )
T2 W R
SV :=
:= SV
join ( )
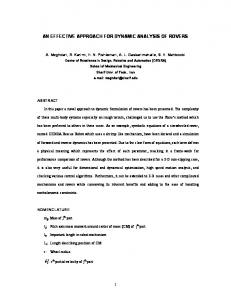
} (a) A multithreaded program using Pthread
(b) A data race in the program
Figure 1. An example of a data race in a multithreaded program
2. Background This section illustrates data races in multithreaded programs which are widely used for high performance for multi-core or multi-processor systems, and introduces instrumentation techniques for dynamic data race detection. 2.1. Data Races in Multithreaded Programs Multithreaded programming is becoming a natural consequence to achieve the improved performance of applications in multi-core systems. We usually use the POSIX thread for standard (Pthread) as a model of concurrent threads for multithreaded programs. Pthread is widely used not only on C/C++ applications, but also on many Unix-like operating systems (e.g., Linux, Solaris, Mac OS, FreeBSD, etc.), because it provides various APIs and libraries for creating and manipulating threads. A thread T of execution in a multithreaded program is a sequence of programed instructions, and a block of T that is partially serially executed is represented as a thread segment, denoted by t. Therefore, a thread can be represented as a set of thread segments, denoted by T = t1, t2, , tn (n 1). A thread segment t contains a finite sequence that consists of at least one event e, denoted by , and denotes the sequence of events generated on a thread segments t. A thread segment t is delimited by thread operations, where the thread operations take one of following forms: ●
200
init( ) models the creation of a thread segment t and the start of the execution of thread T.
Copyright ⓒ 2014 SERSC
International Journal of Multimedia and Ubiquitous Engineering Vol.9, No.4 (2014)
●
fork( ) models the creation of a thread segment tj on a new thread Tj from the current thread segment ti and the start of a new thread segment ti’ on the same thread Ti.
●
join( ) models the termination of a thread segment tj and Tj, and the creation of a new thread segment ti’ from the same thread Ti.
Figure 1 shows an example of a multithreaded program using Pthread. In Figure 1(a), the program is spawned a new thread for the execution of func1 by the pthread_create( ) of line 12, and the program is joined by the pthread_join( ) of line 15. Figure 1(b) represents an execution of the program shown in Figure 1(a) as a directed acyclic graph, called a partial order execution graph (POEG). A vertex of POEG means a fork or a join operation for concurrent threads, and an arc represents a thread execution. The access R and W drawn with disks upon the arcs represent a read and a write access to a shared memory location for variable SV. A data race may occur in the program of Figure 1(a) during its any execution, because two concurrent threads access a shared memory location without any proper synchronization. With POEG, we can easily understand the partial order or happens-before relation of accesses occurred in an execution instance of the program. Because the instruction of line 14 is executed between creating and joining a new thread, both the instructions, line 7 and line 14, are concurrently executed on each thread. Thus, they consist of a data race. From the POEG of Figure 1(b), both accesses R and W which represent a read of SV (line 14 in Figure 1(a)) and a write to SV (line 7 in Figure 1(a)), respectively, are involved in a data race, because it shows that R on thread T1 and W on thread T2 are concurrent without any proper synchronization. Detecting such data races in multithreaded programs is important to guarantee the reliability of the programs. However, it is difficult to figure out whether a program runs into data races, because a lot of the data races are hard to reproduce with traditional sequential testing or debugging methods due to the non-deterministic interleaving of concurrent threads. Thus, sophisticated techniques are employed to monitor and analyze the program executions for debugging instead of identifying the bug manually. 2.2. Data Race Detection in Multithreaded Programs We have much previous work which progresses some techniques for data race detection. These techniques have focused on static and dynamic analysis. Static analysis techniques [3][5] are sound, but imprecise because they report unfeasible races by analyzing only source code without any execution, therefore they lead to many false positives. Moreover, using these techniques for detecting feasible races in a multithreaded program with dynamically allocated data is NP-hard problem [1-2]. Dynamic analysis includes trace based post-mortem techniques and on-the-fly techniques, which report only feasible data races occurred in an execution of the programs. Post-mortem techniques [6], collect occurred accesses information into a trace file during an execution of a program. Then, these techniques analyze the traced information or replay the program to detect feasible data races. However, this approach is inefficient because it requires large time and space cost for tracing accesses and threads. On-the-fly methods [7-16] dynamically detect data races with still less overhead in storage space than other dynamic techniques, because unnecessary information are removed as the detection advances. On-the-fly methods are based on three different analysis methods: lockset analysis, happens-before analysis, and hybrid analysis. Figure 2 illustrates the classification of data race detection techniques using a hierarchical structure.
Copyright ⓒ 2014 SERSC
201
International Journal of Multimedia and Ubiquitous Engineering Vol.9, No.4 (2014)
Data Race Detection
Static Analysis
Dynamic Analysis
Post-mortem Methods
Happens-before Analysis
On-the-fly Methods
Lockset Analysis
Hybrid Analysis
Figure 2. The classification of race detection techniques Lockset analysis [14, 16] reports data races of monitored program by checking violations of a locking discipline, and happens-before analysis [7-10] reports data races between current access and maintained previous accesses by comparing their happens-before relation based on the usage of a logical time stamp, such as vector clocks. The lockset analysis is simple and can be implemented with low overhead. However, lockset analysis may lead to many false positives, because it ignores synchronization primitives which are non-common lock such as signal/wait, fork/join, and barriers. The happens-before analysis is precise, since it does not report false positives and can be applied to all synchronization primitives. However, it is quite difficult to be efficiently implemented due to the performance overheads. The hybrid method [11-13] tries to reduce the main drawback of pure lockset analysis and to get more improved performance than pure happens-before analysis. Most hybrid detectors improved accuracy on reporting data races by partially applying the happens-before analysis on lockset analysis, but still report false positives. The technique for reducing false positives cannot guarantee the credibility of a race free execution of a multithreaded program with one input. Several dynamic data race detect ion techniques are performed in automatic tools with their significant advantages. These techniques used in detectors have some limitations, because they analyze only the dynamic execution of a program with a single input. Most dynamic detectors try to cover the limitations by considering the ordering of synchronization operations, such as fork-join, locks, signal-waits, and barriers, obtained in an actual execution of the program, but they still provide limited advantages (e.g. supporting particular synchronization primitives, improving the efficiency or the preciseness of execution overhead, etc). Dynamic analysis for detecting data races usually uses an instrumentation framework to insert extra codes into target sources or binaries for monitoring every memory and thread operation.
3. Motivation Program instrumentation [17-20] is a technique that inserts extra codes into target applications to monitor the execution of the program and to collect runtime information, while attempting to preserve the visible behavior of the original codes. By the instrumentation, the extra codes can be inserted at various stages, such as source code modification stage, compile-time stage, and link-time stage, and the original codes are transferred to modified executable codes to analyze runtime information. The instrumentation approach can be
202
Copyright ⓒ 2014 SERSC
International Journal of Multimedia and Ubiquitous Engineering Vol.9, No.4 (2014)
classified into source code instrumentation and binary instrumentation that use either static or dynamic method. Source code instrumentation [17] is used to modify source code by inserting appropriate code. The source code instrumentation is simple and can be apply multiple compilers and platforms. However, it is difficult proper considering to change data cache behavior, interactions with optimizing compilers, and the runtime overhead of instrumentation library calls. Binary instrumentation [18-20] inserts the extra codes into binaries considering a program form which consists of the codes and data to execute the program, like binaries lack source code, often lack symbols, and debugging information [20]. Binary instrumentation also uses either static or dynamic method. Static binary instrumentation occurs in a phase that rewrites object or executable codes before the program is ran. Dynamic binary instrumentation is a popular technique to analyze the runtime behavior of applications, because it does not require any modifying the target binaries and covers all the execution of the application. However, the overheads of dynamic binary instrumentation can be high for complex programs, such as multithreaded programs. Thus, it is hard to be implemented because of the difficulty of the code rewriting at run-time. Nonetheless, dynamic analysis for complex programs can be built with the dynamic binary instrumentation frameworks, such as DynamoRIO [21], Valgrind [212], and Pin [23-24]. The executable binaries are loaded into memory area and replaced as an objective image. Usually, the binaries are executed with several dynamic linked libraries (DLL) such as standard libraries, and it is mapped with the address area of a process for the execution of the program when the main function is loaded. Each objective image which mapped with the address area of a process consists of diverse sections that include distinct information for the execution. These sections are commonly consists of Code Section which includes executable machine codes, Data Section which saves the information of variables, and Debug Section for supporting debugging. The Code Section is a main target to monitor accesses to memory locations because the instructions for the read or the write of data are mainly existed in the section. Thus, it is important to make the minimal insertion of the monitoring codes in Code Section to reduce additional runtime overhead of dynamic data race detection.
4. The Filtering for Dynamic Data Race Detection We present a hierarchical filtering method that removes unnecessary monitoring operations at the each of three levels, Image Level (IML), Section Level (SEL), and Instruction Level (INL), to reduce runtime overhead of dynamic data race detection. This section introduces the key idea of our filtering method. 1 2 3 4 5 6 7 8 9 10 11 12 13
… ..globl SV .bss .align 4 .type .size … ..globl temp1 .section .align 4 .type .size …
Copyright ⓒ 2014 SERSC
SV, @object SV, 4
.rodata temp1, @object temp1, 4
21 22 23 24 25 26 27 28 29 30 31 32 33
… main: … call movl movl addl movl movl movl movl call
pthread_create %eax, -12(%ebp) SV, %eax $1, %eax %eax, -8(%ebp) -16(%ebp), %eax $0, 4(%esp) %eax, (%esp) pthread_join
…
203
International Journal of Multimedia and Ubiquitous Engineering Vol.9, No.4 (2014)
14 15 16 17 18 19 20
func1: …
34 35 movl addl movl movl
call
printf
…
temp1, %eax $4, %eax %eax, SV $0, %eax
Figure 3. Symbolic binaries for the program shown in Figure 1(a)
4.1. The Filtering for IML The objective images which have been loaded into a memory area include target binaries for user application, system libraries, and other APIs. However, detecting data race focuses only on the user applications and its libraries rather than system libraries and others. Therefore, we selectively filter out memory operations which related standard libraries and other APIs by using the path of linked images and the name of libraries. Figure 3 indicates symbolic binaries for the program shown in Figure 1(a). The binaries linked with system libraries, like pthread_create, pthread_join, and printf (e.g., lines 24, 32, and 34 in Figure 3). We simply filter out such the system libraries for IML. Thus, we never insert any monitoring codes for the system libraries. 4.2. The Filtering for SEL There exist several dynamic section areas in Data Section, such as global variable area, static variable area, and heap area, that the areas are used to read or write data during the execution of the program. Moreover, the special areas are located for read only data and constant variables. Therefore, we simply filter out such the read only memory areas for SEL. For example, in Figure 3, the variable temp1 is read only data, because it was declared as a constant variable, although it is a global variable similar to SV. The constant variables are indicated as .rodata in the data section of the binaries (see the line 9 in Figure 3). We easily filter out such the read only data for SEL by using this information of the section. Therefore, the instruction of line 16 in Figure 3 is excluded from a point to insert monitoring code for data race detection. 4.3. The Filtering for INL The memory operations should be monitored with each instruction to precisely insert corresponding monitoring codes into the Code Section. We analyze the opcode and operand of instructions to decide which operations access shared memory locations. Figure 4 depicts memory allocations for important areas of the executable binaries shown in Figure 3. The local variables, temp in Figure 1(a), are usually allocated in stack area. Thus, we can simply filter out the local variables which related only stack area of memory allocations.
204
Copyright ⓒ 2014 SERSC
International Journal of Multimedia and Ubiquitous Engineering Vol.9, No.4 (2014)
Code Area
…
… main : movl % esp, %ebp pushl %ecx call printf …
Stack Area
…
… temp …
Data Area
…
… SV temp1 …
…
Figure 4. Memory mapping for the execution of the binaries shown in Figure 3 For example, we can estimate two memory locations, ebp and esp in Figure 3, which are the pointer to stack area of memory by analyzing operand of the instructions and comparing their address with information of stack area. Thus, the almost of memory operations are excluded from the conflicting accesses to memory locations. With our hierarchical filtering, we filter out unnecessary memory operations for dynamic data race detection. Therefore, we are possible to insert monitoring codes into the target binaries of Figure 3 with considering only a shared variable SV.
5. Evaluation We evaluated empirically the effectiveness of our filtering method by applying the experimentation of dynamic data race detection with a set of benchmarks. We employed a state-of-the-art algorithm for dynamic data race detection and seven benchmarks for the experiments. The empirical results show that our hierarchical filtering method practically reduces the runtime overhead for dynamic data race detection. 5.1. Implementation and Experimentation For the evaluation of our filtering method, we employed FastTrack [ 8] algorithm which is a state-of-the-art for dynamic data race detection. We use seven benchmarks of PARSEC 2.1 suite [25] which targets different areas with applications such as data mining, financial analysis, and computer vision. All benchmarks were executed with Sim-Medium simulation inputs of the PARSEC benchmark suite to produce proper runtime overhead. We implemented FastTrack algorithm as a detector on top of the Pin instrumentation framework which uses a just-in-time compiler to recompile target program binaries for dynamic instrumentation. Our hierarchical filtering method was implemented on a detector as a modified version of FastTrack. The experimentations were carried on a system with Intel Xeon Quad-core 2CPUs and 8GB main memory under Linux operating system. The benchmarks were compiled with gcc 4.4.4, and the average runtime overhead of benchmarks was measured for five executions. 5.2. Results and Analysis Figure 5 depicts the reduced runtime overhead of data race detection by each filtering for three levels. The graph in Figure 1 shows that IML and SEL reduce average runtime overhead to 16.6% and 6.1% of the original overhead of FastTrack, respectively. From the
Copyright ⓒ 2014 SERSC
205
International Journal of Multimedia and Ubiquitous Engineering Vol.9, No.4 (2014)
Runtime Overhead (%)
figure, the most effective level for filtering is INL, because the filtering for INL reduces the runtime overhead to 37.7% of the original FastTrack, in the average case. We compared the hierarchical filtering which combines the filtering method of three levels to get more practice, such as IML+SEL and IML+SEL+INL. The compared results appear in Figure 6. From the results, the step of IML and the step of IML+SEL reduced the average runtime overhead to 17% and 23% of FastTrack, respectively. In the Final step, IML+SEL+INL, it reduced average runtime overhead to under of 50% of FastTrack, excluding dedup benchmark. In case of blackscholes, the average runtime overhead is only about 10% of the original overhead of FastTrack by our hierarchical filtering method. These empirical results from Figure 5 and Figure 6 show that our hierarchical filtering method practically reduces runtime overhead for dynamic data race detection. 120
IML
SEL
streamcluster
swaptions
INL
100
80
60
40
20
0 blackscholes
canneal
dedup
fluidanimate
x264
Benchmarks
Figure 5. The ratio of runtime overheads for each filtering level
Runtime Overhead (%)
canneal
dedup
blackscholes
fluidanimate
streamcluster
swaptions
x264
100 90
80 70 60 50 40 30 20 10 0
None
IML
IML+SEL
IML+SEL+INL
The steps of hierarchical filtering
Figure 6. The measured runtime overheads for hierarchical filtering
206
Copyright ⓒ 2014 SERSC
International Journal of Multimedia and Ubiquitous Engineering Vol.9, No.4 (2014)
6. Conclusion It is important to locate data races for debugging multithreaded programs. However, the dynamic detection techniques are needed large amount of runtime overhead. This paper presented a hierarchical filtering method that removes unnecessary monitoring memory operations from three levels of binary image. The empirical results using a set of benchmarks show that our hierarchical filtering method offers the practical dynamic data race detection for multithreaded programs due to fact that it reduces the average runtime overhead to over 50% of pure dynamic data race detection.
Acknowledgements This research was supported by Basic Science Research Program through the National Research Foundation of Korea (NRF) funded by the Ministry of Education (NRF-2013R1A1A2011389).
References [1] R. H. B. Netzer and B. P. Miller, “What are Race Conditions?: Some Issues and Formalization”, ACM Lett. Program. Lang. Syst., vol. 1, (1992), pp. 74-88. [2] E. Pozniansky and A. Schuster, “Efficient On-the-fly Data Race Detection in Multithreaded C++ Programs”, SIGPLAN Not., vol. 38, no. 10, (2003), pp. 179-190. [3] D. Engler and K. Ashcraft, “Racerx: effective Static Detection of Race Conditions and Deadlocks”, Proceedings of the 9th ACM Symposium on Operating System Principles (SOSP), (2003), New York, NY, USA. [4] M. Naik, A. Aiken and J. Whaley, “Effective Static Race Detection for Java”, Proceedings of the 2006 ACM SIGPLAN Conf. on Programming Language Design and Implementation (PLDI), (2006) Ottawa, Canada. [5] J. W. Voung, R. Jhala and S. Lerner, “Relay: Static Race Detection on Millions of Lines of Code”, Proceedings of the 6th Joint Meeting of the European Software Engineering Conference and the ACM SIGSOFT Symposium on the Foundations of Software Engineering (ESEC-FSE), (2007) Dubrovnik, Croatia. [6] P. A. Emrath and D. A. Padua, “Detecting Nondeterminacy in Parallel Programs”, IEEE Software, vol. 9, (1992), pp. 69-77. [7] T. Elmas, S. Qadeer and S. Tasiran, “Goldilocks: A Race and Transaction-aware Java Runtime”, Proceedigns of the 2007 ACM SIGPLAN Conference on Programming Language Design and Implementation (PLDI), (2007), San Diego, CA, USA. [8] C. Flanagan and S. N. Freund, “FastTrack: Efficient and Precise Dynamic Race Detection”, Communication of the ACM, vol. 53, no. 11, (2010), pp. 121-133. [9] O. K. Ha and Y. Jun, “Efficient Thread Labeling for On-the-fly Race Detection of Programs with Nested Parallelism”, Communications in Computer and Information Science, vol. 257, (2011), pp. 424-436. [10] O. K. Ha, I. B. Kuh, G. M. Tchamgoue and Y. K. Jun, “On-the-fly Detection of Data Races in OpenMP Programs”, Proceedings of the 10th Workshop on Parallel and Distributed Systems: Testing, Analysis, and Debugging (PADTAD), (2012) Minneapolis, MN, USA. [11] A. Jannesari, B. Kaibin, V. Pankratius and W. F. Tichy, “Helgrind+: An Efficient Dynamic Race Detector”, Proceedings of the 2009 IEEE International Symposium on Parallel & Distributed Processing (IPDPS), (2009), Rome, Italy. [12] E. Pozniansky and A. Schuster, “Multirace: Efficient On-the-fly Data Race Detection in Multithreaded C++ Programs”, Concurrency and Computation: Practice & Experience - Parallel and Distributed Systems: Testing and Debugging (PADTAD), vol. 19, no. 3, (2003), pp. 327 - 340. [13] K. Serebryany and T. Iskhodzhanov, “ThreadSanitizer: Data Race Detection in Practice”, Proceedings of the Workshop on Binary Instrumentation and Applications (WBIA), (2009), New York, NY, USA. [14] S. Savage, M. Burrows, G. Nelson, P. Sobalvarro and T. Anderson, “Eraser: A Dynamic Data Race Detector for Multithreaded Programs”, ACM Trans. Comput. Syst., vol. 15, (1997), pp. 391-411. [15] M. Christiaens and K. De Bosschere, “Trade, A Topological Approach to On-the-fly Race Detection in Java Programs”, Proceedings of the 2001 Conference on Virtual Machine Research and Technology Symposium, (2001), Berkeley, CA, USA. [16] H. Nishiyama, “Detecting Data Races using Dynamic Escape Analysis based on Read Barrier”, Proceedings of the 3rd Conference on Virtual Machine Research and Technology Symposium, (2004), Berkeley, CA, USA.
Copyright ⓒ 2014 SERSC
207
International Journal of Multimedia and Ubiquitous Engineering Vol.9, No.4 (2014)
[17] J. Dongarra, A. D. Malony, S. Moore, P. Mucci and S. Schende, “Performance Instrumentation and Measurement for Terascale Systems”, Lecture Note in Computer Science, vol. 2660, (2003), pp. 53-62. [18] A. R. Bernat and B. P. Miller, “Anywhere, Any-time Binary Instrumentation”, In Proceedings of the 10th ACM SIGPLAN-SIGSOFT Workshop on Program Analysis for Software Tools (PASTE), (2011), Szeged, Hungary. [19] K. Hazelwood and A. Klauser, “A Dynamic Binary Instrumentation Engine for the ARM Architecture”, In Proceedings of the 2006 International Conference on Compiler, Architecture and Synthesis for Embedded Systems (CASES), (2006), Seoul, Korea. [20] A. R. Bernat, K. Roundy and B. P. Miller, “Efficient, Sensitivity Resistant Binary Instrumentation”, In Proc. of the 2011 Int’l Symposium on Software Testing and Analysis (ISSTA), (2011), Toronto, Canada. [21] D. L. Bruening, “Efficient, Transparent, and Comprehensive Runtime Code Manipulation”, Ph D. Thesis, Massachusetts Institute of Technology, (2004). [22] N. Nethercote and J. Seward, “Valgrind: A Framework for Heavyweight Dynamic Binary Instrumentation”, In Proceedings of the 2007 ACM SIGPLAN Conference on Programming Language Design and Implementation (PLDI), (2007), San Diego, California, USA. [23] M. Bach, M. Charney, R. Cohn, E. Demikhovsky, T. Devor, K. Hazelwood, A. Jaleel, C. K. Luk, G. Lyons, H. Patil and A. Tal, “Analyzing Parallel Programs with Pin”, Computer, vol. 43, no. 3, (2010), pp. 34-41. [24] H. Patil, C. Pereira, M. Stallcup, G. Lueck and J. Cownie, “Pinplay: A Framework for Deterministic Replay and Reproducible Analysis of Parallel Programs”, In Proceedings of the 8th Annual IEEE/ACM International Conference on Code Generation and Optimization (CGO), (2010), Toronto, Canada. [25] C. Bienia, S. Kumar, J. P. Singh and K. Li, “The PARSEC Benchmark Suite: Characterization and Architectures Implications”, Proceedings of the 17th International Conference on Parallel Architectures and Compilation Techniques (PACT), (2008), Toronto, Canada.
Authors Ok-Kyoon Ha He received the BS degree in Computer Science under the Bachelor’s Degree Examination Law for Self-Education from National Institute for Lifelong Education, and the MS and PhD degree in Informatics from Gyeongsang National University (GNU), South Korea. He is now a Research Fellow of Engineering Research Institute (ERI) in GNU. He worked as the manager of IT department in Korea industry for several years. His research interests include parallel/distributed programming and its debugging, embedded system programs, and dependable systems. Dr. Ha is a member of Korean Institute of Information Technology (KIIT) and Korea Institute of Information Scientist and Engineers (KIISE). Yong-Kee Jun He received the BS degree in Computer Engineering from Kyungpook National University, and the MS and PhD degree in Computer Science from Seoul National University. He is now a full professor in the Department of Informatics, Gyeongsang National University, where he had served as the first operating director of GNU Virtual College. He is now the head of GNU Computer Science Division and the director of the GNU Embedded Software Center for Avionics (GESCA), a national IT Research Center (ITRC) in South Korea. As a scholar, he has produced both domestic and international publications developed by some professional interests including parallel/distributed computing, embedded systems, and systems software. Prof. Jun is a member of Association for Computing Machinery (ACM) and IEEE Computer Society.
208
Copyright ⓒ 2014 SERSC