New innovative algorithms for effective prognosis are designed and developed .... Chiu, B., Keogh, E., Lonardi, S.: Probabilistic discovery of time series motifs. In:.
Effective Prognosis using Wireless Multi-Sensors for Remote Healthcare Service Rahul Krishnan Pathinarupothi1 and Ekanath Rangan2 1
Amrita Center for Wireless Networks & Applications (AmritaWNA) Amrita School of Engineering, Amritapuri 2 Amrita School of Medicine Amrita Institute of Medical Sciences, Kochi Amrita Vishwa Vidyapeetham Amrita University, India
Abstract. Remote healthcare delivery is one of the most promising solutions to tackle global trends in falling health care access and quality of service. A wireless network of sensors, IoT devices, and cloud is presented here. New innovative algorithms for effective prognosis are designed and developed based on motifs and profile matrices. The system consisting of the sensor network and algorithms together enable delivering remote healthcare services. Key words: Body sensor network, sensor data summarization, consensus abnormal motif
1 Introduction Telemedicine and remote health monitoring are gaining attention in ensuring better access to quality healthcare services for the growing population. The use of body sensors for vitals monitoring has gained large scale acceptance with the high proliferation of smartphones. The physiological parameters such as blood pressure (BP), blood glucose, oxygen saturation (SpO2), electrocardiogram (ECG) etc. are monitored, processed and send from the smartphone for further analysis to doctors in remote hospitals, where they can suggest interventions. Though such innovations are of great benefit to patients, it increases the load on the doctors, technicians and nurses. To obtain a fast and accurate summarization of huge amount of sensor data is still an open challenge. Some of the earlier works on data summarization [1], [2] focused on quantizing continuous time series data into most frequently occurring patterns that they call motif. There has been recent work [3] where sensor data summarization has been used to identify abnormal activities from prior experience database for monitoring people in old age homes. However, the challenge of identifying abnormal motifs has not been explored much for multi-sensor time series data. Working in collaboration with medical practitioners we have developed a novel express data summarization technique specifically designed for large scale sensor based healthcare monitoring applications. This is achieved by identifying
2
Rahul Krishnan et al.
what we call Consensus Abnormality Motif (CAM) that represents the most frequent deviations from the normal values. In the following sections, we present a formal model and evaluation of this summarization technique.
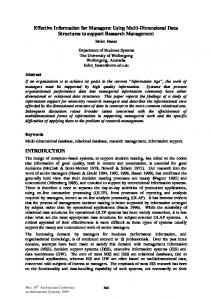
2 Multi-sensor Architecture We consider N physiological sensors attached to a patient as shown in Fig. 1. The data is first quantized into K finite severity levels by the severity quantizer. Each sensor value is quantized as An + +, An +, An , An −, An − −, etc., where n represents the sensor type while the symbols + and - represents above-normal and sub-normal severity levels in comparison to the normal value. For instance, A represents normal range of values, A+++ represents higher than normal, while A— suggests subnormal level. It may be noted that the number of severity levels, K, depends upon the type of sensors too. It might be easier to visualize this as a matrix where the columns represent time-ordered tuple of quantized sensor t+2 values (At1 +, At+1 etc.) and rows represent values from different sensors 1 , A1 during the same time. This matrix is passed to the multiplexer to form a multisensor matrix (MSM) in which temporally related values from different sensors are sequentially arranged, while preserving the synchronous ordering of sensors. For example, the first two rows in the MSM represents the quantized values for t+1 t+1 time t and t+1 as: At1 +, At2 ,..., Atn −− and At+1 1 +, A2 ,..., An −−. The output of the MUX is fed to the Physician Assist Filter (PAF) which helps in CAM discovery and analysis. The PAF-CAM engine has three functionalities, namely: PAF-CAM pre-processing, PAF-CAM discovery and PAF-CAM alerting engine. These form the basic building blocks for the smart summarization technique that we describe next. Quantizer MUX PAF-CAM Pre-Proc PAF-CAM Discovery PAF-CAM Alert
SPM
MSM A+++
0
0
2
A++
0
3
1
A+
2
4
1
A
5
0
3
A-
0
0
0
A++
A--
0
0
0
A+
A
CAM
A+
A++
A+++
A
A+
A
SSV
2
6
6
A
A++
A
AMI
Time
dBP
sBP
Glucose
1
A+
A++
A+
2
A
A+
A+++
3
A
A+
A+++
4
A+
A++
5
A
6 7
14
Fig. 1. Smart Summarization and analytics architecture based on PAF-CAM technique.
3 Smart Summarization In the first part of the PAF-CAM pipeline, i.e., the pre-processing engine, each column of MSM is analysed to calculate the weighted-frequency of occurrence of
Effective Prognosis
3
each symbol and is used to derive the Severity Profile Matrix (SPM). Suppose a predefined weight wnk is assigned for the k th severity level of nth sensor, and the frequency of occurrence of a symbol Atn is fnk , then the (k, n)th element of SPM would be wnk ∗fnk . After forming the SPM, PAF-CAM discovery engine calculates the Consensus Abnormal Motif, which is a collection of symbols that summarizes the severity level of the nth sensor data over a time duration of D. The CAM is calculated by comparing the weighted-frequencies in the SPM along a column and then assigning the corresponding CAM as the symbol having the highest value. In effect, CAM also removes fluctuations in the sensor signals since the CAM is dominated by the highest frequency component parameterized by the severity. This makes CAM an error resilient summarization technique thereby providing the doctors with reliable and relevant data. The next module in the PAF-CAM pipeline is the alerting engine that calculates a Sensor Severity Value (SSV) which is the highest wnk ∗ fnk value for the nth sensor. The SSV represents the summarized severity level of a given sensor data over a time duration D. Furthermore, we calculate an Alert Measure Index (AMI), which is an aggregate score that represents the combined severity of all sensors and is used to classify the patients severity level. Based on AMI, the PAF-CAM alerting engine alerts the doctors and caregivers if the values are above a preset threshold. AM I =
n X
max(wik ∗ fik )
(1)
i=1
In the following section, we describe how we have used this method to identify patients requiring urgent attention in remote healthcare monitoring.
(a)
(b)
Fig. 2. (a) The weekly SSV for 10 patients shows wide variation in individual sensor data values for glucose and BP. (b) MI for 10 patients over a period of 7 days.
4 Evaluation and results We obtained the vitals data of ten patients from an anonymized patient database that included systolic blood pressure (sBP), diastolic blood pressure (dBP) and blood glucose levels over a seven day monitoring period. Each day of data consists
4
Rahul Krishnan et al.
of one reading for sBP, dBP and fasting glucose. Here, variables N = 3 and D = 7 days were used. We assumed k = 6; with A+++, A++, A+, A (normal), A- and A–. For each sensor, the individual range for each symbol was decided based on known levels of severity. For the calculation of SPM, the weights wnk used were: A+++ (3), A++ (2), A+ (1), A (0), A- (1), A– (2). The zero weighted normal values ensure that only abnormalities are detected from the SPM. After deriving the SPM, the corresponding CAM, SSV and AMI were calculated. Figure 2 (a) shows the weekly SSV for all the patients. The normal value would be zero and hence a deviation from the baseline shows higher severity. Figure 2 (b) shows the AMI for all the ten patients. It can also be observed that the effect of individual SSVs are very evident in the overall AMI. We can infer from these results that patient 4 shows unusually high severity level while 5, 6 are in the higher range. Most of the other patients in this study showed higher than normal AMI, though it is at least two times less severe than patients 4, 5 and 6. This technique of classifying patients based on their severity level would prove highly useful for doctors, nurses and technicians, who would otherwise have to identify the most severe signs of a patient by going through a huge amount of data. Though these are early results from PAF-CAM technique, we believe that the simplicity and usability of this can be extended to many other areas of prognosis too.
5 Conclusion We have presented initial work towards the development of a fast, effective and usable prognosis support technique using consensus abnormal motifs. The physician assist filters help in summarization of large amount of sensor data into insightful prognosis-supporting reports that can reduce the work load on doctors. In the near future, we intend to use the PAF-CAM algorithm to identify CAMs for known disease conditions to help in CAM matching. We also believe that the area of medical data summarization will gain further momentum as we head towards large scale deployment of remote monitoring systems.
References 1. Chiu, B., Keogh, E., Lonardi, S.: Probabilistic discovery of time series motifs. In: Proc. of the ninth ACM SIGKDD international conference on Knowledge discovery and data mining, pp. 493–498. ACM (2003) 2. Lonardi, J.L.E.K.S., Patel, P.: Finding motifs in time series. In: Proc. of the 2nd Workshop on Temporal Data Mining, pp. 53–68. (2002) 3. Hajihashemi, Z., Popescu, M.: Early illness recognition using frequent motif discovery. In: Proceedings of Annual International Conference of the IEEE Engineering in Medicine and Biology Society, pp. 3699–3702. IEEE (2015)