IEEE AFRICON 2009
23 - 25 September 2009, Nairobi, Kenya
Effects of Charging Algorithm and Converter Topology on Energy Efficiency MN Gitau and G Ebersohn Dept. of Electrical, Electronic and Computer Engineering University of Pretoria Pretoria, South Africa
[email protected] Abstract— Underground mining activities in South Africa depend on battery fed underground locomotives to haul ore. The batteries are predominantly lead-acid and have to be charged periodically. At the moment, most of the battery chargers in use in South African mines are based on ferroresonant or transductor charger technology. At the same time, the charging algorithms in use are time based and in general without a clearly defined equalization phase and charge termination criterion. This paper will show that by utilizing a charging algorithm with a clearly defined gassing and equalization phase, it is possible to significantly reduce total energy consumption in a charging bay. Further, the use of switch-mode chargers can have the desirable effect of increasing total power factor and hence lower the maximum kVA demand. Keywords-Switch-mode chargers, ferroresonant chargers, charging algorithms, reactive power demand, charger efficiency, charging efficiency
I.
INTRODUCTION
All battery-fed applications require battery chargers to charge the batteries once their stored charge has been depleted. In South Africa, most underground mining activities depend on battery-fed locomotives to haul the mineral bearing ore from the rock-face to a point where it can be transported to the surface for processing. Other industrial and commercial activities that require battery chargers include those that make use of battery-fed electric fork-lifts. In the power industry, large battery banks are found in most power generation stations. These are required to supply some of the auxiliary equipment and also to restart generators following repairs or scheduled maintenance operations. The telecommunication industry also makes use of battery banks in their exchanges and data centers while renewable energy systems may require battery banks to store energy when supply exceeds demand. The process of charging a battery is complex as it entails converting electrical into chemical energy [1-3]. It can be broadly divided into three phases namely: bulk charging phase, gassing phase and equalization phase [1, 3-6]. The energy efficiency of the charging process is dependent on
factors that include charger copper efficiency and more importantly, the charge efficiency during each one of the three phases of the charging cycle. Additionally, charger topology does influence the distortion and displacement reactive power demand and hence total kVA demand [7-11]. Increase in kVA demand inevitably leads to higher losses and equipment ratings and thicker cables to cater for higher RMS currents. The South African power utility ESKOM has been operating for a number of years a scheme whereby they reward companies that reduce their active power consumption as part of their demand-side management program. At the same time, ESKOM’s tariffs for industrial customers take into account the maximum kVA demand in addition to the kWh consumed. Furthermore, there is likelihood that in the near future, ESKOM’s tariffs for industrial customers will also take into account the harmonic injection into the grid as is the case in a number of countries [7-8, 10]. A broader definition of energy efficiency that includes not just the copper efficiency of the charger, but also the efficiency of the charging process as well as the impact of distortion and displacement reactive power demand on energy efficiency [9, 11-16] is hence considered. This paper will present the findings of an investigation that was carried out on behalf of one of the mining companies in South Africa to determine the performance of their chargers for underground mines lead-acid traction batteries [6]. In particular, it will discuss the effects of charger topologies and charging algorithms on overall energy efficiency. II.
CHARGING ALGORITHMS
The most basic charging profiles are: decreasing (taper) characteristics (W type), increasing characteristics (S type), limited characteristics, constant characteristics and assembled characteristics [1-2]. For traction applications, the most commonly used charging profiles are constant-current- (i.e. Iprofile), constant-current constant-voltage (i.e. I-U profile), constant-current constant-voltage constant-current (i.e. I-U-I profile) and taper or constant effect (W profile) [1-3]. Modifications of these profiles are also in common use [1-2, 6]. Traction batteries charging profiles that are currently in use in the South African underground mining sector mainly fall into the assembled category I-U-I and I-I-I [6]. Fig. 1 presents an
978-1-4244-3919-5/09/$25.00 ©2009 IEEE
1
IEEE AFRICON 2009
23 - 25 September 2009, Nairobi, Kenya
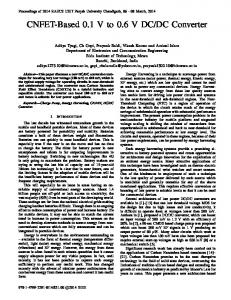
Fig. 3 presents the charging profile that was introduced during the course of the investigations in order to address the identified shortcomings of the current charging algorithms. These shortcomings include low specific gravity of electrolyte at the end of the bulk charging phase and poor energy efficiency during the equalization phase. Additional problems included inability of the chargers to take into account battery condition or age as well as electrolyte temperature. For a battery to be fully charged, it is necessary to return the charge that had been removed during discharge and also to return the specific gravity of the electrolyte to a level that corresponds to a fully charged battery. If the latter is not accomplished, then a sizeable amount of energy stored in the battery will not be available for use.
PROPOSED CHARGING REGIME FOR 60 CELL, 800Ah MINING BATTERIES (FOLLOWING 80% DOD) 1.280
180
140
Current [A]
1.260
Voltage [V]
1.240
120
1.220
100
1.200 1.180
80 60 40
Specific gravity [kg/l]
1.160
Temperature [C]
SPECIFIC GRAVITY
160 CURRENT/VOLTAGE/TEMPERATURE
assembled charging profile comprising of constant-current (during phase 1), constant-voltage (phase 2) and constantcurrent characteristic during phase 3 of the charging cycle. Fig. 2 on the other hand presents an assembled charging profile that utilizes the constant-current characteristic during each one of the three phases of the charging cycle. Measurements of a number of variables were carried out and will be used to determine the performance of the various charger plus charger profile combinations.
1.140
20
1.120
0
1.100 0.0 0.5 1.0 1.5 2.0 2.5 3.0 3.5 4.0 4.5 5.0 5.5 6.0 6.5 7.0 7.5 8.0 8.5 9.0 9.5 10.0 10.5 11.0 11.5 12.0 TIME [Hrs] TEMPERATURE
CURRENT
VOLTAGE
SPECIFIC GRAVITY
(a) Ideal output current and voltage, electrolyte temperature and specific gravity profiles
(b) Logged input active, reactive and apparent power and power factor Fig. 3: Proposed charging characteristics
1.80E+02 1.60E+02
V
1.40E+02 I [A], V [V]
1.20E+02 1.00E+02 8.00E+01
I
6.00E+01 4.00E+01 2.00E+01 0.00E+00 -2.00E+01 0
2
4
6
8
10
12
Time (Hours)
Fig. 1: Charging current and voltage characteristics for charger employing and assembled I-I-I charging profile 1.80E+02 V
1.60E+02 1.40E+02
I (A),V (V)
1.20E+02 1.00E+02 8.00E+01 6.00E+01 I
4.00E+01 2.00E+01 0.00E+00 -2.00E+01 0
2
4
6
8
10
Time (Hours)
A. Time based charging algorithms In time-based charging profiles, the total time required to complete the three phases of the charging cycle is predetermined for a given initial state of charge (SoC). The main advantage of this approach is the ease of implementation. However, this approach suffers from a number of shortcomings. Chief among these include inability to take into account battery age and condition, SoC or depth of discharge (DoD) and environmental conditions. All of the above have an effect on how a battery should be charged. Equalization phase in particular accounts for significant energy loss. B. Other charging algorithms There are also charging profiles that are not time based. Variables that include terminal voltage, charging current, charge that ought to be returned, rate of change of voltage and electrolyte temperature are monitored and used to determine when to initiate or terminate a given phase in the charging cycle. Charging profiles that are time based for parts of the charging cycle are also in common use. Hysteresis or pulsed charging [3, 11] has been implemented during the equalization phase in some charging algorithms. This has been shown to lower energy demand during this phase without adversely affecting a battery’s state of health (SoH). The proposed algorithm makes use of hysteresis charging during equalization phase.
Fig. 2: Charging current and voltage characteristics for an assembled I-U-I charging profile
978-1-4244-3919-5/09/$25.00 ©2009 IEEE
2
IEEE AFRICON 2009
III.
23 - 25 September 2009, Nairobi, Kenya
TYPES OF CHARGERS
Chargers can be grouped into ferroresonant or transductor, SCR and switch mode topologies. In the South African underground mining sector, transductor chargers dominate and switch-mode chargers are now slowly being introduced [6]. Charger topology influences copper loss and displacement and distortion power factors as mentioned previously. A. Transductor chargers Transductor charger technology [11] dates back more than 50 years. Its operation depends on the ability to control transformer magnetizing current (or flux). This in turn influences the induced voltage and ultimately the charging voltage [11]. The technology therefore suffers from an inherent poor input displacement power factor, high charging ripple, and slow dynamic response, as will be confirmed from measured values. Ripple does not contribute to charge transfer but instead gives rise to losses in the battery. B. Switch-mode chargers Many variations of chargers employing switch-mode converter technology are possible each with its own advantages and disadvantages. The front-end converter in most cases is a diode rectifier with capacitor voltage filter. However, some of the newer chargers include an active rectifier front-end to improve total power factor. In general, switch-mode converters have the following advantages to offer: fast dynamics and hence improved output performance, high-frequency isolation transformer and hence smaller size and weight [9, 11, 15-16] and high displacement power factor. Disadvantages include electromagnetic interference (EMI) concerns, low distortion power factor unless input filters or active rectifiers are employed and more complex control and sometimes higher costs [9, 15]. Thermal design of switchmode converters is also critical and more so when required to operate in harsh environments like those encountered in underground mining applications. IV.
4 PERFORMANCE PARAMETERS AND CHARGER
phases of the charging cycle. Charger output voltage and current waveforms were also recorded. Fig. 4 (a) presents the input current and voltage waveforms whereas Fig. 4 (b) presents the output voltage and current waveforms for a transductor charger. The non-sinusoidal nature of input current and large displacement angle between supply current and voltage are evident in Fig. 4(a). It is seen in Fig. 4(b) that there is a substantial ripple component in the charging current. This does not contribute to the charging process and has the undesirable effect of increasing battery losses thus raising electrolyte temperature and negatively affecting battery SoH. Fig. 5 (a) presents the input current waveform whereas Fig. 5 (b) presents the output voltage and current waveforms for a switch-mode charger without an input filter. It is seen from Fig. 5(a) that the displacement angle between voltage and current waveforms much higher than in the case of transductor charger but the current waveform is more distorted suggesting a lower distortion power factor. From Fig. 5 (b), it is seen that there is switching frequency voltage and current ripple as a result of finite size of filter components. Their magnitudes were much lower compared to those for the transductor chargers. The FFT function available in the software that accompanies Techtronix TDS 1024 oscilloscopes was utilized to obtain the frequency spectrum of the various waveforms. The above performance parameters will be used to evaluate the effects of topology and charging algorithms on charger performance. I
V
(a)
Input voltage and current waveforms [250 V/div; 20 A/div]
PERFORMANCE
The need to lower energy costs and the carbon footprint associated with the completion of a given task or process, utilizing the installed capacity more efficiently and hence reduce the need to expand the electrical network is increasingly becoming important. Loggers were connected to monitor the following: input active, reactive and apparent power, input displacement power factor, charger output active power, voltage and current profiles as well as electrolyte temperature. Values of electrolyte specific gravity were also recorded at least at the beginning of the charging cycle, at the end of the bulk phase and also at the end of the charging cycle. Input voltage and current waveforms were recorded using a Tektronix TDS 1024 digital oscilloscope during the various
V I
(b) Output voltage and current waveforms [30 V/div; 50 A/div] Fig. 4: Transductor charger current and voltage waveforms.
978-1-4244-3919-5/09/$25.00 ©2009 IEEE
3
IEEE AFRICON 2009
23 - 25 September 2009, Nairobi, Kenya
V
I
(a)Input current and voltage waveforms [100 A/div; 250 V/div]
C. Comparative analysis Table 1 presents the average input active power for various combinations of charger topology and charging profile. From Table 1, it is seen that the effect of both topology and charging profile on input active power demand is very small during stage 1 of the charging cycle. This is mainly because the implementation of the algorithms for phase 1 was very similar. Charger employing the new charging profile has the lowest power demand during the equalization phase. Table 2 presents input apparent power for various combinations of charger topology and charging profile. It is seen from Table 2 that charger topology has the highest influence on the displacement reactive power and hence the apparent power taking into account only displacement reactive power. Increase in apparent power translates into increase in conduction and switching losses thus lowering efficiency. TABLE 1. Average input active power during the various stages of the charging cycle
V
Stage 1 I
(b) Output voltage and current waveforms [50 V/div; 40 A/div] Fig. 5: Switch-mode charger without an input current filter
A. Ferroresonant/Transductor chargers Tests were carried out on air-cooled and oil-cooled transductor chargers. Charging profiles for which measurements were carried out were: assembled constantcurrent I-I-I and I-U-I. These were presented in Figs. 1 and 2 respectively. In all cases, the third phase was supposed to be the equalization phase and was time based. B. Switch-mode chargers Two types of switch-mode chargers were tested. One employed a 50 Hz isolation transformer and the converter operated at a switching frequency of 600 Hz. The second one had a high frequency isolation transformer and operated at a switching frequency of 40 kHz. The switch-mode chargers employed assembled I-I-I and I-U-I profiles. A new charging profile shown in Fig. 3 and which has not previously been employed in underground mining operations in South Africa was also tested. It was shown to offer significant energy saving opportunities especially during the equalization phase as will be discussed in more detail below. The chargers employing the new charging algorithm are switch mode charger 1 with profile I-I-I and with profile I-U-I.
Transductor charger 1 with IUI profile Transductor charger 1 with III profile Transductor charger 2 with IUI profile Switch-mode charger 1 with IUI profile Switch-mode charger 1 with III profile Switch-mode charger 2 with IUI profile Switch-mode charger 2 with III profile
Stage 2
Stage 3
22-23.5 kW
23.5-4.7 kW
4.7-5.5 kW
22-23.5 kW
8.25-8.5 kW
4.7-5.5 kW
24-25 kW
25-4 kW
4-4.5 kW
22.7-23.5 kW
8.05 kW