High-Contrast Imaging from the Thirty Meter Telescope ..... The lateral-y error is also assumed to be zero at the zenith and increase as the cosine of ... As a result, one would not expect it to contribute significantly to contrast inside the AO dark.
Effects of Diffraction and Static Wavefront Errors on High-Contrast Imaging from the Thirty Meter Telescope Mitchell Troya , Ian Crossfielda , Gary Chananb , Philip Dumonta , Joseph J. Greena , Bruce Macintoshc a Jet
Propulsion Laboratory, California Institute of Technology, Pasadena, CA 91109 of Physics and Astronomy, University of California Irvine, Irvine, CA 92697 c Lawrence Livermore National Laboratory, Livermore, CA 94551
b Department
ABSTRACT High-contrast imaging, particularly direct detection of extrasolar planets, is a major science driver for the next generation of extremely large telescopes such as the segmented Thirty Meter Telescope. This goal requires more than merely diffraction-limited imaging, but also attention to residual scattered light from wavefront errors and diffraction effects at the contrast level of 10−8 -10−9 . Using a wave-optics simulation of adaptive optics and a diffraction suppression system we investigate diffraction from the segmentation geometry, intersegment gaps, obscuration by the secondary mirror and its supports. We find that the large obscurations pose a greater challenge than the much smaller segment gaps. In addition the impact of wavefront errors from the primary mirror, including segment alignment and figure errors, are analyzed. Segment-to-segment reflectivity variations and residual segment figure error will be the dominant error contributors from the primary mirror. Strategies to mitigate these errors are discussed. Keywords: Telescopes, Segmented Mirrors, Adaptive Optics, Diffraction, High-Contrast
1. INTRODUCTION The next generation of extremely large telescopes will play an important and unique role in high-contrast imaging of extrasolar planets.1, 2 As a result the Thirty Meter Telescope (TMT) is being designed with high-contrast imaging as a requirement. The TMT requirement is to design a telescope such that the telescope itself does not fundamentally limit reaching contrast values of 10−8 (goal of 10−9 ) from 3λ/D to 88λ/D (34 mas to 1 arcsecond at H band). The high-contrast imager for the TMT will be the Planet Formation Instrument.3 If the telescope aberrations are stable then the speckles from the telescope can be subtracted out (to the photon noise level). In practice, this type of subtraction has achieved a factor of ∼5-10 improvement in contrast.4, 5 The most successful technique to date uses the parallactic rotation to distinguish planets from artifact speckles. Multi-wavelength imaging with an integral field unit can also be used and factors of 10-20 have been achieved in the lab.6 Both techniques are most effective at large field angles - performance at 3-5 λ/D will be almost completely determined by the telescope and other internal static errors. In this analysis we assume that in the future we will be able to achieve a factor of 20 improvement over the instantaneous contrast using multiwavelength speckle suppression and subtraction techniques. As a result we want the telescope error terms to be less then 2 x 10⁻⁷ (goal of 2 x 10⁻⁸ ). The goal of this paper is to investigate the impact on contrast of static error sources and diffraction from the primary mirror of the TMT. These effects include primary mirror phase errors, segment reflectivity variations, segment gaps, secondary obscuration and supports. To begin we investigate each error term individually. We then combine all error terms together to estimate a final contrast level. In Section 2 we discuss the system architecture and simulation tools used. In Section 3 we look at the effects of static phase errors from segment aberrations and alignment errors. In Section 4 we investigate the impact of segment reflectivity variations and in Section 5 we look at the impact of the combined error terms.
Advances in Adaptive Optics II, edited by Brent L. Ellerbroek, Domenico Bonaccini Calia, Proc. of SPIE Vol. 6272, 62722C, (2006) · 0277-786X/06/$15 · doi: 10.1117/12.671667
Proc. of SPIE Vol. 6272 62722C-1
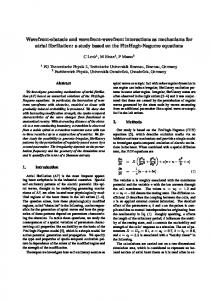
Figure 1. The figure on the left is the TMT pupil. The gaps and cables have been exaggerated for clarity. The figure on the right is the Lyot stop used in the two-stage nuller.
2. SYSTEM ARCHITECTURE 2.1. Telescope The TMT primary mirror consists of a circularized arrangement of 738 hexagonal segments, each 0.6 m on a side. The segments have 1 mm nonreflective edges and are separated by 2 mm gaps, giving optical gap widths of 4 mm. The central seven segments of this arrangement are not included in the primary mirror, as they would lie behind the 3.65 m diameter secondary obscuration. A set of three 0.5 m struts and six 10 cm cables support the secondary; the full obscured aperture is shown in Figure 1, where the gaps and cables have been exaggerated for clarity. Adequately sampling the TMT’s gaps would normally require an array with ∼ 160002 elements – an impractically large size. Instead, we model the TMT aperture using the Gray Pixel Approximation.7 This accurately captures the diffraction effects of the primary geometry by computing analytically its Fourier transform. Taking the inverse transform gives a grayscale representation of the telescope aperture. Both the amplitude and phase of the primary mirror segments are modeled in MATLAB using a set of segmented telescope tools developed at JPL. We found that we could obtain consistent results in our simulations using an array with 1024 pixels across the pupil (a scale of ∼ 3 cm per pixel).
2.2. Adaptive optics Wavefront aberrations must be kept to a low level in order to perform high-quality high contrast imaging. The TMT will utilize an adaptive optics (AO) system with an approximately 1282 element deformable mirror. The type of wavefront sensor is still undetermined; methods under consideration include Shack-Hartmann, MachZender, and Pyramid wavefront sensing. We implement a static wave-optics AO simulation using the ARROYO library.8 The complex pupils are read in and the AO loop is closed and allowed to converge. The wavefront sensor is a Shack-Hartmann sensor with a spatial filter.9 Each subaperture is imaged by propagating the appropriate portion of the initial wavefront to the sensor’s focal plane. A least-squares reconstructor with 1272 actuators is used to drive the deformable mirror (DM), which is simulated using pyramid influence functions. The DM is then run in a proportional integral servo loop.
Proc. of SPIE Vol. 6272 62722C-2
2.3. Diffraction Suppression System In recent years a variety of diffraction suppression systems have been proposed. Some, such as the Four-Quadrant Phase Mask and Phase Induced Amplitude Apodization, appear to be poorly suited for highly obscured apertures such as the TMT’s. We investigated the use of a band-limited Lyot Coronagraph,10 but soon discovered it was not effective at meeting the TMT’s high-contrast imaging requirements. In particular, the narrow inner working angle of 3 λ/D requires the use of an extremely aggressive Lyot stop, due especially to the secondary supports and cables. As a result, we were unable to achieve both high contrast at (3 λ/D) and a useful total throughput with a band-limited coronagraph. For these reasons, we decided to study a dual-shear nulling interferometer (“nuller”).11 This design interferes the pupil with two sheared copies of itself that have each undergone a π phase shift. In the absence of any wavefront errors, the starlight from the three pupils is spatially coherent and destructively interferes, while light from any companion objects makes it through. Any wavefront errors partially destroy the coherence, letting some starlight through and degrading the contrast. The shears used are ±3.13 m, which corresponds to a shift of exactly three segments. By shearing an integral number of segments, there is no need to block the intersegment gaps in the Lyot stop. Because of the dual shears, the response of the nuller on the sky is a sinusoidal grating-like pattern; thus approximately half of the field of view is unobservable at any given instant. However, a proper combination of nuller rotations can give some coverage across the entire field of view. The nuller also requires that any region of the pupil not destructively interfered must be blocked out by a Lyot stop. The two shears of the obscured TMT pupil results in the complicated Lyot stop shown in Figure 1, which has 21% throughput. The lower curve of Figure 6 shows the contrast as a function of angular distance from the star for the TMT pupil, including effects of segment gaps, secondary obscuration and the supports (but no phase errors). This case demonstrates the baseline performance of the DSS. The contrast achieved is significantly better then 10−9 and does not limit the achievable contrast.
3. PHASE ERRORS 3.1. Segment Aberrations In this section we model the expected segment aberrations to understand how they impact the performance of high-contrast imaging. The effects considered include segment surface figure, segment warping harness performance, segment misalignment, and print through of the segment support structures. 3.1.1. Wavefront Errors The input phase errors are specified by a structure function in the TMT Specification for Finished Primary Mirror Segments Document.12 These specifications have been translated into equivalent Zernike aberrations; the Zernike mode coefficients are listed in column 5 (“No Warping Harness”) of Table 1. The wavefront errors were generated by taking the specified coefficient values for each segment, then applying a random sign for each coefficient on each segment. As a result, by design each segment will just meet the specifications. The current plan is for each segment to have a 27 point warping harness (WH) with 18 actuators per segment. The warping harnesses will help to improve the lower-order segment aberrations. According to analysis performed by Hytec Incorporated the WH should reduce the segment aberrations by the factors given in column 2 of Table 1. These predicted wavefront error reduction factors are 5 to 15 times greater then those currently achieved at Keck (column 3 of Table 1). It is currently unclear what is limiting the Keck WH performance; the current reduction factors there are significantly worse than initially expected. A collaboration funded by the TMT and Keck is currently working to understand and improve the Keck WH performance. It will be necessary to measure the segment surface errors and set the warping harnesses to correct for the lower-order phase errors. There will be some error in this process. The Alignment and Phasing System (APS)13 will be used to measure the segment aberrations and set the warping harness. Analysis of data from the Keck Phasing Camera System shows that the 2nd order segment Zernikes are measured to an RMS of 7.8 nm (wavefront) after 6 minutes of integration. If we assume these measurement errors are limited by measurement of
Proc. of SPIE Vol. 6272 62722C-3
Table 1. Segment warping harness parameters used to simulate the TMT segment aberrations. The details of each column are described in Section 3.1.1.
Zernike
Ideal WH
Keck WH
Keck
No
Ideal
Ideal WH
Keck WH
Ideal WH
index
Reduction
Reduction
Meas.
Warping
TMT
w/ Keck
w/ Keck
w/ TMT
Factors
Factors
noise
Harness
WH
Error.
Error.
Error
(n,m)
Theory
Exper.
nm WFE
nm WFE
nm WFE
nm WFE
nm WFE
nm WFE
2,0
17.2
4
7.8
19
1.1
7.9
9.1
4.9
2,-2
50.8
4
7.8
20
0.4
7.8
9.3
4.8
2,2
50.8
4
7.8
20
0.4
7.8
9.3
4.8
3,-1
5.1
1
3.9
8
1.6
4.2
8
2.9
3,1
5.1
1
3.9
8
1.6
4.2
8
2.9
3,-3
12.2
1
3.9
16
1.3
4.1
16
2.7
3,3
15.2
1
3.9
0
0
3.9
0
2.4
4,0
1
1
2.6
2
2
3.3
2
2.6
4,-2
3.1
1
2.6
2
0.6
2.7
2
1.7
4,2
3.1
1
2.6
2
0.6
2.7
2
1.7
4,-4
6.4
1
2.6
2
0.3
2.6
2
1.6
4,4
6.4
1
2.6
2
0.3
2.6
2
1.6
subimage motion through the atmosphere then they can be scaled to higher order Zernike modes. The calculated and scaled measurement noise at Keck is shown in column 4 of Table 1. The measurement noise should scale as the segment diameter to the power of 5/6, so the Keck measurement values can be scaled to the TMT. Given an assumption about the WH reduction factors (none, Keck or TMT/Idea]) and the measurement noise (none, Keck or TMT) the segment aberrations can be calculated by combining the wavefront errors from each term in quadrature. Columns 5 through 9 of Table 1 show the segment aberrations for several combinations of assumptions. As a baseline for analysis we have chosen the TMT WH reduction factors combined with the Keck measurement errors (column 7 of Table 1). We have selected the Keck measurement errors in part because while the APS measurement errors will be smaller then Keck’s, other error terms will contribute to errors in setting the WH. The left hand side of Figure 2 shows a section of the phase map used in the simulations that corresponds to the wavefront errors from column 7 of Table 1. The RMS wavefront error is 17.3 nm and the peak-to-valley wavefront error is 242 nm. The large peak-to-valley errors occur primarily at the segment boundaries. These large edge discontinuities are a direct result of the segment errors’ relatively large low spatially frequencies. The pupils corresponding to the five cases in Table 2 (columns 5 through 9) were run though a wave-optics simulation of the AO system. The right side of Figure 2 shows the AO-corrected phase map that corresponds to the wavefront errors from column 7 of Table 1. The AO-corrected RMS wavefront error is 9.1 nm and the peak-to-valley wavefront error is 199 nm. The AO system has reduced the RMS wavefront error by a factor of 1.9, but the segment-to-segment edge discontinuities are outside the controllable bandwidth of the AO system, and thus not significantly changed from the input wavefront values. Table 2 shows a summary of the wavefront before and after AO for all five cases. 3.1.2. Achievable Contrast Levels The AO-corrected pupils were then run through the diffraction suppression system as described in Section 2.3. Figure 3 shows the contrast as a function of angular distance from the star for the five cases described in Table 2. The different cases in Figure 3 vary in contrast by over a factor of 100. It is clear that different performance
Proc. of SPIE Vol. 6272 62722C-4
0 nanometers WFE
Figure 2. The left hand side is a 5 m by 5 m zoomed in view of the TMT pupil using the expected segment aberrations from column 7 of Table 1. The units are nanometers of wavefront error. The RMS wavefront error is 17.3 nm and the peak-to-valley is 242 nm. The right hand side is the same portion of the TMT pupil corrected with 127 actuators across the pupil. The RMS wavefront error is 9.1 nm and the peak-to-valley is 199 nm. The AO system has significantly reduced the wavefront error interior to each segment, but the large edge discontinues are not changed significantly from the non-AO corrected wavefront.
levels of the WH will have a significant impact on the achievable contrast. In the baseline case using the TMT predicted WH reduction factors and the Keck measurement errors, a contrast value of 2.0 x 10⁻⁷ is reached at 3λ/D with an average value of 4.5 x 10⁻⁸ from 3 to 10λ/D. We show in Section 5 that this is the limiting factor in achievable contrast. As a result it is critical to understand how well the WH will perform and why they perform poorly at Keck.
3.2. Alignment Errors In this section we consider the effects from errors in the piston, tip and tilt of each segment. It is assumed that these errors are dominated by the ability of the APS system to measure and align the primary mirror segments. 3.2.1. Wavefront Errors We assume that the segment piston errors will be 12 nm RMS wavefront. This value is consistent with the performance of the Keck Phasing Camera System (PCS).14 On Keck the random tip/tilt alignment error between segments is dominated by global low spatial frequencies which the AO system will easily correct. However, random tip/tilt errors between segments lead to edge discontinuities which the AO system can not correct. At Keck the RMS edge discontinuity from tip/tilt is 48 nm wavefront which corresponds to 17 nm RMS wavefront error of random tip/tilt errors. If we assume the Keck values are limited by measurement of subimage motion through the atmosphere then they should scale as the segment diameter to the power of 5/6, which results in a predicted value of 11 nm. We assume some improvement over the current Keck performance will be achieved. The level of potential improvement is being modeled as part of the Conceptual Design Review for APS. We have used a value of 6 nm RMS wavefront for each of the tip and tilt terms, modeled as normally distributed tip/tilts between the segments. Table 3 shows the RMS surface errors for the three alignment cases: piston only, tip/tilt only and piston and tip/tilt combined for both before and after AO correction. As above the generated pupils were run through a wave-optics simulation of an AO system with 127 actuators across the pupil. In the combined case the RMS wavefront error was reduced by a factor of 2.6 from 15.2 nm to 5.8 nm.
Proc. of SPIE Vol. 6272 62722C-5
Table 2. RMS and Peak-Valley wavefront errors in nanometers for segment aberrations both before and after AO correction with 127 actuators across the pupil. The AO system is able to reduce the RMS wavefront error, but has little effect on the P-V errors which are dominated by edge discontinuities from the segment aberrations.
RMS
P-V
(nm Wavefront)
(nm Wavefront)
Without warping
Pre-AO
39.6
352
harnesses
Post-AO
21.1
354
Pre-AO
25.5
272
Post-AO
14.2
257
Pre-AO
17.3
242
Post-AO
9.1
199
Pre-AO
11
153
measurement errors
Post-AO
5.7
126
Perfect WH Zernike
Pre-AO
3.7
38
Post-AO
1.7
36
WH: Keck-like Zernike reduction Ideal WH: Keck measurement errors Ideal WH: TMT
reduction
Table 3. RMS and Peak-Valley wavefront errors in nanometers for segment alignment errors both before and after AO correction with 127 actuators across the pupil. The AO system is able to reduce the RMS wavefront error by a factor of 2.6, but has little effect on the P-V errors which are dominated by edge discontinuities from the misalignment errors.
RMS
P-V
(nm Wavefront)
(nm Wavefront)
Pre-AO
12.7
80
Post-AO
4.5
77
Segment tip/tilt
Pre-AO
8.3
97
Post-AO
3.8
75
Combined segment
Pre-AO
15.2
132
alignment error
Post-AO
5.8
107
Segment piston
3.2.2. Achievable Contrast Levels The AO-corrected pupils were run through the diffraction suppression system. Figure 4 shows the contrast as a function of angular distance from the star for the three cases described in Table 3. In the combined case of piston and tip/tilt errors a contrast value of 2.3 x 10⁻⁸ is reached at 3λ/D and an average value of 1.3 x 10⁻⁸ from 3 to 10λ/D. The piston and tip/tilt contrast limits are approximately equal. If the tip/tilt errors are not improved from the current Keck values the contrast will increase by about a factor of 4 as contrast is proportional to the phase error squared. Further study is needed to ensure that APS can meet the required tip/tilt accuracy. If APS can not meet the required accuracy then an alternative would be to study the benefit from feeding the segment tip/tilt measured from PFI back to the primary mirror control system; PFI’s wavefront sensors with ∼4 samples per segment should be capable of reconstructing segment piston/tip/tilt.
3.3. Segment support structure print through The primary mirror segments are supported by a so-called “whiffle tree” structure. Gravity sag and other forces result in a residual wavefront error from this support system. A finite element analysis of the segment print
Proc. of SPIE Vol. 6272 62722C-6
10
—8
10_b
Without warping harnesses Warping harness: Keck—like Zernike reduction — — — Ideal warping harness: Keck measurement errors Ideal warping harness: TMT measurement errors —e-— Perfect (ideal) warping harness Zernike reduction
10
i_2
10_i
10°
Field angle [arcsec]
Figure 3. The contrast is shown as a function of field angle. From top to bottom: The dashed curve is the contrast using the specification for the mirror segments. The solid curve shows the result of WH that work as well as those on Keck. The dash-dot curve is the contrast from the TMT WH working at their theoretical efficiency, with Keck PCS measurement noise. The dotted curve is also from the TMT WH at their theoretical efficiency, but with the Keck PCS measurement noise scaled to match the size of the TMT’s segments. The solid curve with circles is the contrast resulting from WH performing at their theoretical efficiency, without measurement noise.
i_8 Co
= ( 10—9
10_b
10
Combined segment alignment errors Segment alignment error: piston — — — Segment alignment error: tip/tilt
i_2
io
100
Field angle [arcsec]
Figure 4. The contrast is shown as a function of field angle. From top to bottom: the top curve (dashed) is the contrast from both piston and tip/tilt alignment errors. The middle curve (solid) is the contrast from tip/tilt alignment errors. The bottom curve (dash-dot) is the contrast from segment piston errors.
Proc. of SPIE Vol. 6272 62722C-7
though was performed by Hytec Incorporated. The input data was provided on a uniform square sampling of 2.34 mm for three cases: axial, lateral-y and lateral-x forces. 3.3.1. Wavefront Errors We combined the data as follows to construct a print through wavefront error as a function of telescope zenith angle. We assume the segments will be polished so that the axial error will be zero at zenith and increase to a maximum at the horizon. We further assume the wavefront errors will increase as the cosine of the zenith angle. The lateral-y error is also assumed to be zero at the zenith and increase as the cosine of the zenith angle, reaching a maximum at the horizon. We assume the lateral-x error is zero as there is no component of gravity in this direction when the segments are installed in the telescope. Given the previous assumptions we can now calculate the whiffletree print through as a function of zenith angle. The RMS error is zero at the zenith and increases to a maximum of 21 nm at the horizon. In this analysis we will assume a zenith angle of 45 degrees, which gives an RMS wavefront error of 15 nm. This wavefront error is replicated for all 738 TMT segments to form a TMT pupil. The AO-corrected wavefront has a wavefront error of 13 nm. As expected, the RMS wavefront error does not significantly decrease because most of the phase errors are outside of the controllable bandpass of the AO system. 3.3.2. Achievable Contrast Levels The print through error is at a very high spatial frequency (significantly higher then 64λ/D) and has a relatively small amplitude. As a result, one would not expect it to contribute significantly to contrast inside the AO dark hole. The AO-corrected pupils were run through the diffraction suppression, and the lower curve on Figure 5 shows the contrast as a function of angular distance from the star. A contrast value of 3.2 x 10⁻⁸ is reached at 3λ/D, and an average value of 3.0 x 10⁻⁹ is reached from 3 to 10λ/D. As expected, these are relatively small values and do not drive the error budget.
3.4. Combination of all phase error terms In this section we investigate the contrast limits placed by all of the phase errors previously described in this section. We generated a TMT pupil that includes segment aberrations, whiffletree print through and segment alignment errors. The initial RMS wavefront error is 27 nm and is reduced to 17 nm after AO correction. The AO-corrected pupils were then run through the diffraction suppression system. Figure 5 shows the contrast as a function of angular distance from the star for all phase errors and each of the individual error terms. Phase errors limit the contrast value to 1.4 x 10⁻⁷ at 3λ/D and an average value of 5.6 x 10⁻⁸ from 3 to 10λ/D. The contrast is dominated by the segment aberrations, highlighting the importance of understanding how well the warping harnesses will perform.
4. AMPLITUDE ERRORS In this section we consider the effects of reflectivity variations of the primary mirror. At Keck the dominant effect is segment-to-segment variations in reflectivity, so we have concentrated our analysis in this area. We have analyzed two cases: the first has a mean segment reflectivity of 99% with a 1% variation and the second has a mean of 95% with a 5% variation. The 1% variation case is consistent with the specification in the science requirements document15 for reflectivities better then 99% at wavelengths longer then 1.5 microns. This is significantly better than is currently achieved at Keck. Complex pupils where generated with the specified segment reflectivity variations and zero phase errors. After running through an AO system the AO system added a very small amount of wavefront error, 0.02 nm. The AO-corrected pupils were then run through the diffraction suppression system. The solid curve in Figure 6 shows the contrast as a function of radial distance from the star for the 1% reflectivity variation cases. This case produced a contrast value to 1.4 x 10⁻⁷ at 3λ/D and an average value of 1.2 x 10⁻⁷ from 3 to 10λ/D. When the amplitude variations are small the contrast should be proportional to the amplitude error squared. This was validated by analyzing the 5% reflectivity variation case which had a contrast value that was, on average, 26 times worse then the 1% variation case.
Proc. of SPIE Vol. 6272 62722C-8
i8 Co
=
( 10 b_b
10
Combined segment phase errors Ideal warping harness: Keck measurement errors — — — Combined segment alignment errors
45—degree Whiffletree Print—through
io
100
Field angle [arcsec]
Figure 5. The contrast is shown as a function of field angle. From bottom to top: the dotted line is the contrast from whiffletree print through. The dash-dot curve is the contrast from segment alignment errors. The solid curve is the contrast from segment aberrations. The dashed curve shows the contrast from combining all of the error terms. The contrast in the combined case is dominated by affects from the segment aberrations.
If the segment-to-segment reflectivity variations are 1% then this contrast error term is approximately equal to that from the phase errors. If the segment reflectivity variations increase this error term will quickly dominate the achievable contrast. There are several techniques that can be used to mitigate amplitude variations. The ideal solution is a device that can modulate the amplitude of the pupil; however, there are currently no devices that can do this well in broadband unpolarized light. A second solution is to use a single DM to carve out a half-dark hole in the image plane. It has been shown that, in monochromatic light, by use of the correct control algorithm a DM can be used to correct for intensity errors if the contrast is allowed to increase in half of the image plane.16 A third solution is to install another DM in the system, but not at a pupil, to allow control of phase and amplitude errors.
5. COMBINATION OF ALL PRIMARY MIRROR ERROR TERMS In this section we analyze the contrast limits placed by all of the primary mirror error terms. We have generated a TMT pupil that includes all of the effects discussed in this paper: phase errors, reflectivity variations, and the segment gaps and secondary obscurations. Figure 6 shows the contrast as a function of radial distance from the star for the combined cases as well as the individual error terms. Primary mirror related errors limit the contrast value to 3.4 x 10⁻⁷ at 3λ/D and an average value of 2.1 x 10⁻⁷ from 3 to 10λ/D. The limiting factor in contrast is segment to segment reflectivity. As mentioned in Section 4, this error source can be compensated for with the addition of a second DM or another algorithm. Thus, the fundamental limiting factor in telescope contrast will be set by the residual segment aberrations. The resulting contrast for this case is 1.4 x 10⁻⁷ at 3λ/D and an average value of 5.6 x 10⁻⁸ from 3 to 10λ/D. We have as a requirement (Section 1) a contrast level of 2 x 10⁻⁷ and just meet this requirement across the interior of the AO dark hole. It is instructive to ask what the contrast performance is in a best-case scenario. To do this we have assumed segment warping harness performance with ideal reduction factors and no segment figure measurement errors, along with feedback from the AO system providing piston and tip/tilt errors a factor of two better then previously assumed. The resulting contrast is the dotted line in Figure 6. We achieve 1 x 10⁻⁸ at 3λ/D and an average
Proc. of SPIE Vol. 6272 62722C-9
Co
=
( lO All Ml errors, 1% reflectivity 1% segment reflectivity variations — — — - Combined segment phase errors
Best—case performance —e-— Gaps and obscurations, no WFE
10_i
100
Field angle [arcsec]
Figure 6. The contrast is shown as a function of field angle. From bottom to top: the curve marked with circles is the contrast for the ”optimal” primary mirror described in 5. The dotted curve is the contrast from the telescope obscuration and segment gaps. The dash-dot curve is the contrast from all segment phase errors. The solid curve is the contrast from 1% segment to segment reflectivity variations. The dashed curve shows the contrast from combining reflectivity with all of the M1 error terms. The contrast in the combined case is dominated by segment reflectivity for angles less then 0.25 arcseconds.
value of 6.6 x 10⁻⁹ from 3 to 10λ/D. In this case we easily meet the requirement for telescope performance at all field angles.
6. SUMMARY We have demonstrated the use of wave-optics simulations to effectively asses the impact of static telescope errors on contrast. We have looked at primary mirror segment aberrations, segment tip/tilt and piston alignment errors, whiffle tree print through, the effects of gaps and the secondary obscuration (and supports) and segment reflectivity variations. We find that the relatively small segment gaps do not limit the contrast. The large obscurations from the secondary and supports do pose a challenge, but the nuller is able to effectively suppress the diffraction. The dominant error term, segment-to-segment reflectivity variations, will require the addition of an amplitude control architecture such as an additional DM located not at a pupil. This leaves segment aberrations as the dominant error term. We have shown (Section 3.1) that depending on the assumptions on the performance of the warping harness (Figure 3) the resulting contrast can change by over two orders of magnitude. The TMT project is actively working to understand and improve the performance of the Keck warping harnesses in order to better understand the performance that will be achieved with the TMT warping harnesses. We have shown that the current telescope design will set an instantaneous contrast floor of ∼6 x 10⁻⁸ , (assuming the addition of a 2nd DM to correct the affects from segment reflectivity variations) which after speckle suppression techniques should produce a contrast floor of ∼2 x 10⁻⁹ . This level of performance is better then the requirement of 10−8 , but not the goal of 10−9 and uses up a substantial fraction of the available error budget, and will likely limit performance on bright science targets between 3 and 5 λ/D.3
ACKNOWLEDGMENTS This research was carried out in part at the Jet Propulsion Laboratory, California Institute of Technology, and was sponsored by the California Institute of Technology and the National Aeronautics and Space Administration.
Proc. of SPIE Vol. 6272 62722C-10
This research was also performed under the auspices of the U.S. Department of Energy by the University of California, Lawrence Livermore National Laboratory under Contract W-7405-ENG-48, and also supported in part by the National Science Foundation Science and Technology Center for Adaptive Optics, managed by the University of California at Santa Cruz under cooperative agreement No. AST - 9876783. The authors also gratefully acknowledge the support of the TMT partner institutions. They are the Association of Canadian Universities for Research in Astronomy (ACURA), the Association of Universities for Research in Astronomy (AURA), the California Institute of Technology and the University of California. This work was supported, as well, by the Canada Foundation for Innovation, the Gordon and Betty Moore Foundation, the National Optical Astronomy Observatory, which is operated by AURA under cooperative agreement with the National Science Foundation, the Ontario Ministry of Research and Innovation, and the National Research Council of Canada.
REFERENCES 1. J. Codona and R. Angel, “Imaging extrasolar planets by stellar halo suppression in separately corrected color bands,” Ap. J. 604, pp. L117–L120, 2004. 2. D. Crampton and L., “Instrument concepts and scientific opportunities for tmt,” in McLean and Iye.17 3. B. A. Macintosh, M. Troy, R. Doyon, K. Baker, J. Graham, and E. Serabyn, “Extreme adaptive optics for the thirty meter telescope,” in Advances in Adaptive Optics, B. Ellerbroek and D. Calia, eds., 6272, SPIE, 2006. 4. C. Marois, D. Lafreni`ere, R. Doyon, B. Macintosh, and D. Nadeau, “Angular differential imaging: a powerful high-contrast imaging technique,” Ap. J. 641, pp. 556–564, 2006. 5. S. Metchev, Brown dwarf companions to young solar analogs: an adaptive optics survey using Palomar and Keck, California Institute of Technology, Pasadena, 2005. 6. J. Lavigne, R. Doyon, and S. Thibault, “An infrared integral field-unit specialized for speckle suppression and the detection of extrasolar planets,” in McLean and Iye.17 7. M. Troy and G. Chanan, “Diffraction effects from giant segmented-mirror telescopes,” Applied Optics 42, pp. 3745–3753, July 2003. 8. M. Britton, “Arroyo,” in Modeling and Systems Engineering for Astronomy, S. C. Craig and M. J. Cullum, eds., 5497, pp. 290–300, SPIE, 2004. 9. L. A. Poyneer and B. Macintosh, “Spatially filtered wave-front sensor for high-order adaptive optics,” Optical Society of America Journal A 21, pp. 810–819, May 2004. 10. M. Kuchner and W. Traub, “A coronagraph with a band-limited mask for finding terrestrial planets,” Ap. J. 570, pp. 900–908, 2002. 11. B. Mennesson, M. Shao, B. Levine, J. Wallace, D. Liu, E. Serabyn, S. Unwin, and C. Beichman, “Optical planet discoverer: How to turn a 1.5m telescope into a powerful exo-planetary systems imager,” in HighContrast Imaging for Exo-Planet Detection, A. Shultz and R. Lyon, eds., 4860, pp. 32–44, SPIE, 2003. 12. L. Stepp, “Thirty meter telescope specification for finished primary mirror segments,” request for proposal, TMT, 2005. 13. G. Chanan, M. Troy, I. Crossfield, J. Nelson, and T. Mast, “The alignment and phasing system for the thirty meter telescope,” in Ground-based and Airborne Telescopes, L. Stepp, ed., 6267, SPIE, 2006. 14. G. A. Chanan, C. Ohara, and M. Troy, “Phasing the mirror segments of the Keck telescopes II: The narrowband phasing algorithm,” Applied Optics 39, pp. 4706–4714, Sept. 2000. 15. J. Nelson and M. Bolte, “Thirty meter telescope science-based requirements document,” Report 52, TMT, 2005. 16. J. Trauger, C. Burrows, B. Gordon, J. Green, A. Lowman, D. Moody, A. Niessner, F. Shi, and D. Wilson, “Coronagraph contrast demonstrations with the high-contrast imaging testbed,” in Optical, Infrared, and Millimeter Space Telescopes, J. Mather, ed., 5487, pp. 1130–1336, SPIE, 2004. 17. I. McLean and M. Iye, eds., Ground-based and Airborne Instrumentation for Astronomy, 6269, SPIE, 2006.
Proc. of SPIE Vol. 6272 62722C-11