Efficient Computation of a Hierarchy of Discrete 3D Gradient Vector Fields David G¨unther, Jan Reininghaus, Steffen Prohaska, Tino Weinkauf, and Hans-Christian Hege
Abstract This paper introduces a novel combinatorial algorithm to compute a hierarchy of discrete gradient vector fields for three-dimensional scalar fields. The hierarchy is defined by an importance measure and represents the combinatorial gradient flow at different levels of detail. The presented algorithm is based on Forman’s discrete Morse theory, which guarantees topological consistency and algorithmic robustness. In contrast to previous work, our algorithm combines memory and runtime efficiency. It thereby lends itself to the analysis of large data sets. A discrete gradient vector field is also a compact representation of the underlying extremal structures – the critical points, separation lines and surfaces. Given a certain level of detail, an explicit geometric representation of these structures can be extracted using simple and fast graph algorithms.
1 Introduction The analysis of three dimensional scalar data has become an important tool in scientific research. In many applications, the analysis of topological structures – the critical points, separation lines and surfaces – are of great interest and may help to get a deeper understanding of the underlying problem. Since these structures have an extremal characteristic, we call them extremal structures in the following. The extremal structures have a long history [2, 14]. Typically, the critical points are computed by finding all zeros of the gradient, and can be classified into minima, saddles, and maxima by the eigenvalues of their Hessian. The respective eigenDavid G¨unther, Jan Reininghaus, Steffen Prohaska, Hans-Christian Hege Zuse Institute Berlin, Takustr. 7, 14195 Berlin, Germany, e-mail: david.guenther, reininghaus, prohaska,
[email protected] Tino Weinkauf Courant Institute of Mathematical Sciences, New York University, 715 Broadway, New York, NY 10003, U.S.A., e-mail:
[email protected]
1
2
D. G¨unther et al.
vectors can be used to compute the separation lines and surfaces as solutions of autonomous ODEs. For the numerical treatment of these problems we refer to Weinkauf [22]. One of the problems that such numerical algorithms face is the discrete nature of the extremal structures. For example, the type of a critical point depends on the signs of the eigenvalues. If the eigenvalues are close to zero, the determination of the type is ill-posed and numerically challenging. Depending on the input data, the resulting extremal structure may therefore strongly depend on the algorithmic parameters and numerical procedures. From a topological point of view, this can be quite problematic. Morse theory relates the extremal structure of a generic function to the topology of the manifold, e.g., by the Poincar´e-Hopf Theorem or by the strong Morse inequalities [15]. The topology of the manifold restricts the set of the admissible extremal structures. Another problem is the presence of noise, for example due to the imaging process, or sampling artifacts. Both can create fluctuations in the scalar values that may create additional extremal structures, which are very complex and hard to analyze, in general. A distinction between important and spurious elements is thereby crucial. To address these problems, one may use the framework of discrete Morse theory introduced by Forman who translated concepts from continuous Morse theory into a discrete setting for cell complexes [5]. A gradient field is encoded in the combinatorial structure of the cell complex, and its extremal structures are defined in a combinatorial fashion. A finite cell complex can therefore carry only a finite number of combinatorial gradient vector fields, and their respective extremal structures are always consistent with the topology of the manifold. The first computational realization of Forman’s theory was presented by Lewiner et al. [12, 13] to compute the homology groups of 2D and 3D manifolds. In this framework, a sequence of consistent combinatorial gradient fields can be computed such that the underlying extremal structures become less complex with respect to some importance measure. The combinatorial fields are represented by hypergraphs and hyperforests, which allow for a very compact and memory efficient representation of the extremal structure. However, the framework is only applicable to relatively small three dimensional data sets since the construction of the sequence requires several graph traversals. This results in a non-feasible running time for large data sets. Recently, several alternatives for the computation of a discrete Morse function were proposed, for example by Robins et al. [18] and King et al. [11]. An alternative approach to extract the essential critical points and separation lines was proposed by Gyulassy [7]. His main idea is to construct a single initial field and extract its complex extremal structures by a field traversal. To separate spurious elements from important ones, the extremal structures are then directly simplified. One advantage of this approach is a very low running time. One drawback is that certain pairs of critical points, i.e., the saddle points, may be connected among each other arbitrarily often by saddle connectors [21]. This can result in a large memory overhead [8] since the connectors as well as their geometric embedding need to be stored separately. Note that the reconstruction of a combinatorial gradient vector field based only on a set of critical points and their separation lines is challenging.
Efficient Computation of a Hierarchy of Discrete 3D Gradient Vector Fields
3
In this work, we construct a nested sequence of combinatorial gradient fields. The extremal structures are therein implicitly defined, which enables a memoryefficient treatment of these structure. Additionally, the complete combinatorial flow is preserved at different levels of detail, which allows not only the extraction of separation surfaces, but may also be useful for the analysis of 3D time-dependent data as illustrated by Reininghaus et al. [17] for 2D. The computation of our sequence is based on the ideas of Reininghaus et al. [16]. A combinatorial gradient field is represented by a Morse matching in a derived cell graph. In this paper, we focus on scalar data given on a 3D structured grid. Although the computation of a sequence of Morse matchings is a global problem, an initial Morse matching can be computed locally and in parallel. We use an OpenMP implementation of the ProcessLowerStar-algorithm proposed by Robins et al. [18] to compute this initial matching. The critical points in this matching correspond one-to-one to the changes of the topology of the lower level cuts of the input data. As mentioned earlier, the presence of noise may lead to a very complex initial extremal structure. The objective of this paper is to efficiently construct a nested sequence of Morse matchings such that every element of this sequence is topologically consistent, and the underlying extremal structures become less complex in terms of number of critical points. The ordering of the sequence is based on an importance measure that is closely related to the persistence measure [24, 4], and is already successfully used by Lewiner [12] and Gyulassy [7]. This measure enables the selection of a Morse matching with a prescribed complexity of the extremal structure in a very fast, almost interactive post-processing step. The critical points and the separation lines and surfaces are then easily extracted by collecting all unmatched nodes in the graph and a constrained depth-first search starting at these nodes. The rest of the paper is organized as follows: in Section 2, we formulate elements of discrete More theory in graph theoretical terms. In Section 3, we present our new algorithm for constructing a hierarchy of combinatorial gradient vector fields. In Section 4, we present some examples to illustrate the result of our algorithm and its running time.
2 Computational Discrete Morse Theory This section begins with a short introduction to discrete Morse theory in a graph theoretical formulation. We then recapitulate the optimization problem that results in a hierarchy of combinatorial gradient vector fields representing a 3D image data set. For simplicity, we restrict ourselves to three dimensional scalar data given on the vertices of a uniform regular grid. The mathematical theory for combinatorial gradient vector fields, however, is defined in a far more general setting [5]. Cell Graph. Let C denote a finite regular cell complex [9] defined by a 3D grid. In this paper, we call a cell complex regular if the boundary of each d-cell is con-
4
a)
D. G¨unther et al.
b)
c)
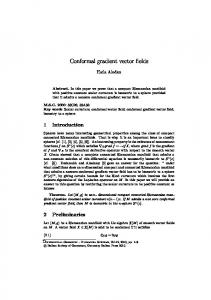
Fig. 1 Illustration of a cell complex and its derived cell graph. a) shows the cells of a 2 × 2 × 2 uniform grid in an exploded view. A single voxel is represented by eight 0-cells, twelve 1-cells, six 2-cells, and one 3-dimensional cell. These cells and their boundary relation define the cell complex. b) shows the derived cell graph. The nodes representing the 0-, 1-, 2-, and 3-cells are shown as blue, green, yellow and red spheres respectively. The adjacency of the nodes is given by the boundary relation of the cells. The edges are colored by the lower dimensional incident node. c) shows the cell complex and the cell graph to illustrate the neighborhood relation of the cells.
tained in a union of (d − 1)-cells. The cell graph G = (N, E) encodes the combinatorial information contained in C. The nodes N of the graph consist of the cells of the complex C and each node u p is labeled with the dimension p of the cell it represents. The scalar value of each node is also stored. Higher dimensional nodes are assigned the maximal scalar value of the incident lower dimensional nodes. The edges E of the graph encode the neighborhood relation of the cells in C. If the cell u p is in the boundary of the cell w p+1 , then e p = {u p , w p+1 } ∈ E. We label each edge with the dimension of its lower dimensional node. An illustration of a cell complex and its graph is shown in Figure 1. Note that the node indices, their adjacence and their geometric embedding in R3 are given implicitly by the grid structure. Morse Matchings. A subset of pairwise non-adjacent edges is called a matching M ⊂ E. Using these definitions, a combinatorial gradient vector field V on a regular cell complex C can be defined as a certain acyclic matching of the cell graph G [3]. The set of combinatorial gradient vector fields on C is given by the set of these matchings, i.e., the set of Morse matchings M φ of the cell graph G. An illustration of a 2D Morse matching is shown in Figure 2 a). Extremal Structures. We now define the extremal structures of a combinatorial gradient vector field V in G. The unmatched nodes are called critical nodes. If u p is a critical node, we say that the critical node has index p. A critical node of index p is called minimum (p = 0), 1-saddle (p = 1), 2-saddle (p = 2), or maximum (p = 3). A combinatorial p-streamline is a path in the graph whose edges are of dimension p and alternate between V ⊂ E and its complement E \V . In a Morse matching, there are no closed p-streamlines. This defines the acyclic constraint for Morse matchings. A p-streamline connecting two critical nodes is called a p-separation line. A p-separation surface is given by all combinatorial 1-streamlines that emanate from a critical point of index p. The extremal structures give rise to a Morse-Smale complex that represents the topological changes in the level sets of the input data. Since we have assigned the maximal value to higher dimensional cells, there are no sad-
Efficient Computation of a Hierarchy of Discrete 3D Gradient Vector Fields
a)
0
1
1 0
0
1
0
2
1
2
1
1
0
1
0
b)
5
c)
Fig. 2 Depiction of algorithm constructHierarchy. Image a) shows a 2D Morse matching M. The matched and unmatched edges of the cell graph G are depicted as solid and dashed lines respectively. The unmatched nodes of G are shown as black dots. Each node of G is labeled by its dimension. Image b) shows the two minima (blue dots) and the saddle (yellow dot) as well as the only two possible augmenting paths (blue and green stripes) in M. Image c) shows the augmentation of M along the left (green) path. The start- and endnode of this path are now matched and not critical anymore. A single minimum (blue dot) remains in M.
dles with a scalar value smaller or greater than their connected minima or maxima respectively. Optimization Problem. The construction of a hierarchy can be formulated as an optimization problem [16]. Given edge weights ω : E → R, the objective is to find an acyclic matching Vk ∈ M φ such that Vk =
arg max ω (M).
M∈M φ , |M|=k
(1)
However, equation (1) becomes an NP-hard problem in the case of 3D manifolds [10]. We therefore only use (1) to guide our algorithmic design to construct a nested sequence of combinatorial gradient vector fields V = (Vk )k=k0 ,...,kn . For each k, we are looking for the smallest fluctuation to get a representation of our input data at different levels of detail. Note that this proceeding differs from the homological persistence approach introduced by Edelsbrunner et al. [4]. There are persistence pairs in 3D that cannot be described by a sequence V as shown in a counterexample by Bauer et al. [1].
3 Algorithm In this section, we describe the construction of a sequence of combinatorial gradient vector fields. The construction consists of two steps. In the first step, an initial Morse matching is computed. The matching represents the fine-grained flow of the input data. In the second step, the initial matching is iteratively simplified by removing the smallest fluctuation in every iteration. The simplification is done by computing the p-separation line S representing this fluctuation in a given matching V` . A pseparation line, which is connecting two critical points, is an augmenting path since it is alternating and its start- and endnode are not matched. We can then produce a larger matching V`+1 by taking the symmetric difference V`+1 = V` 4 S.
(2)
6
D. G¨unther et al.
Algorithm 1 constructHierarchy Input: initial matching Vk0 , cell graph G Output: hierarchy 1: hierarchy ← nil 2: saddleQueue ← initQueue(G) 3: while saddleQueue 6= 0/ do 4: s ← saddleQueue.pop() 5: if isCritical(s) then 6: [cancelPartner, augPath] ← getUniquePairing(s.idx) 7: if cancelPartner then 8: weight ← getWeight(s.idx, cancelPartner) 9: if weight < saddleQueue.top().weight then 10: updateMatching(augPath) 11: hierarchy.append(augPath) 12: else 13: saddleQueue.push(s.idx, weight)
Equation (2) is called augmenting the matching. The simplification stops if the matching can not be augmented anymore. This final result represents the gradient field with the coarsest level of detail. Initial Matching. To compute the initial matching Vk0 , we use the algorithm ProcessLowerStar [18]. ProcessLowerStar computes a valid Morse matching by finding pairs in the lower star of each 0-node in lexicographic descending order. Since the decomposition of a cell graph in its lower stars is a disjoint decomposition, each lower star can be processed in parallel. The assumption in ProcessLowerStar is that the scalar values are distinct. To fulfill this requirement, we use the same idea as Robins et al. [18]. Two 0-nodes in a lower star with the same scalar values are differentiated by their index. If the enumeration of the 0-nodes in G is linear, this correlates to a linear ramp with an infinitesimal small η . Computing the Hierarchy. In the following we describe the construction of a sequence of Morse matchings V . See Algorithm 1 and Figure 2 for a depiction of it. The main idea is to compute the p-separation line with the smallest weight that emanates from a saddle and allows for an augmentation of the Morse matching. While the computation of the 0- and 2-separation lines is straight forward, special attention needs to be taken for the computation of 1-separation lines since they can merge and split in the combinatorial setting. We start with the initial matching Vk0 as described above. In the first step, the priority queue is initialized by the function initQueue (line 2). This function collects all unmatched 1- and 2-nodes and computes the weight of these nodes. The weight is given by the smallest difference in the scalar values of a saddle and its neighbors [16]. initQueue uses basically the same functionality as the function getUniquePairing, which is described subsequently. After the queue is initialized, the first saddle s of the queue, i.e., the element with the smallest weight, is taken (line 4) and checked whether it is still critical (line 5). This is necessary since previous simplification steps may have affected s. Then, the function getUniquePairing computes the cancel partner as well as the augmenting path that connects this node with s (line 6).
Efficient Computation of a Hierarchy of Discrete 3D Gradient Vector Fields
a)
b)
7
c)
Fig. 3 Illustration of algorithm getUniquePairing. In the first step (a), the two 1-separation lines (blue lines) starting from a 1-saddle (green sphere) are integrated. Both end in distinct minima (blue spheres), which would allow for an augmentation along one of these lines. The combinatorial flow restricted to the separation lines is indicated by arrows. In the second step (b), the separation surface (blue surface) is integrated using a depth first search. The surface ends in 2-separation lines (red lines) that emanate from 2-saddles (yellow spheres). For each of these 2-saddles the intersection of their separation surface and the surface emanating from the 1-saddle is computed in the third step (c). The intersection is depicted by red stripes. The resulting saddle connectors, i.e., the 1separation lines, are shown as green lines. The right 2-saddle is connected twice with the 1-saddle. An augmentation of the matching along one of these lines would result in a closed 1-streamline. This saddle is therefore not a valid candidate for a cancellation. From the remaining 2-saddles and the two minima the critical node is chosen that has the smallest weight with respect to the 1-saddle.
If the saddle s is connected to every neighbor by multiple paths, then we can not cancel this saddle since a closed combinatorial streamlines would be created (line 7). Otherwise, we compute the weight of s and its cancel partner and test whether it is smaller than the weight of the next element in the queue (line 8 and 9). This is necessary since previous simplification steps may have affected the connectivity of s. If the weight is smaller, it represents the smallest fluctuation at this time, and we can augment the matching along the path (line 10). This results in a simplified combinatorial gradient field where the saddle node s and its cancel partner are no longer critical. Since the augmentation of a matching along an augmenting path never creates new critical nodes, the complexity of the underlying extremal structure is reduced. The path is finally stored to be able to restore this specific level of detail (line 11). We reinsert the saddle s with the new weight (line 13) if the weight is greater. The main computational effort lies in the computation of the best pairing that contains a uniquely defined connection. Algorithm 2 and Figure 3 show how this can be achieved efficiently. Let s be an unmatched 1- or 2-node. In the first step, the two 0- or 2-separation lines – the paths that connect a saddle node with at most two 0-nodes or 3-nodes – are computed. We take the two 0- or 2-edges incident to s (line 2) and follow the combinatorial gradient field until an unmatched node is found. This is done by the function integrateSeparationLine (line 3). Note that these separation lines are uniquely defined if we start at a saddle. Multiple lines can merge but they can not split. We need to check whether these two paths end in the same minimum or maximum (line 4). If they do, an augmentation along one of these paths would create a closed streamline, which are not allowed in combinatorial gradient fields. If the two endnodes are distinct, we choose the one with the smallest weight and take the corresponding path as augmenting path (line 5 and 6).
8
D. G¨unther et al.
Algorithm 2 getUniquePairing Input: saddle s Output: cancelPartner, augmentingPath 1: cancelPartner ← nil, augmentingPath ← nil, isCircle ← f alse, weight ← ∞ 2: [ f irstLink, secLink] ← getLinkToExtrema(s) 3: [ f irstPath, secPath] ← integrateSeparationLine(s, [ f irstLink, secLink]) 4: if getEndNode( f irstPath) 6= getEndNode(secPath) then 5: [cancelPartner, augmentingPath] ← getBestWeight( f irstPath, secPath) 6: weight ← getWeight(s, cancelPartner) 7: [sur f ace, saddles] ← integrateSeparationSur f ace(s) 8: sort(saddles) 9: for all n ∈ saddles do 10: if n.weight < weight then 11: [isCircle, line] ← checkMultiplePairing(sur f ace, n.idx) 12: if isCircle = f alse then 13: weight ← n.weight, cancelPartner ← n.idx 14: augmentingPath ← line 15: return
In the second step, we investigate the connectivity of s with complementary saddle nodes. The 1-separation lines that connect these saddles are also called saddle connectors [21], and are defined by the intersection of the complementary separation surfaces. In contrast to 0- and 2-separation lines, these lines can split and merge. In previous work of Lewiner [12], this property results in a non-feasible running time, and in the work of Gyualssy [7], it induces a large memory consumption. The second part of Algorithm 2 and Algorithm 3 show a memory and running time efficient alternative. Given the saddle s, we integrate the separation surface using a depth-first search (line 7). This is done by integrateSeparationSurface. Note that the integration only follows the 1-streamlines, i.e., the 1-paths that alternate between the current matching and its complement. Since the boundary of a separation surface consists of separation lines, the integration will terminate at these lines. The 1- and 2- nodes describing these lines are already matched and hinder a further flooding. The result of integrateSeparationSurface is a list of 1- and 2-nodes representing the separation surface. Additionally, a list of the complementary saddles is returned. We sort these saddles by their weight to s (line 8) and test them in ascending order (line 9). Since the objective is to remove the smallest fluctuation, we are looking for a saddle partner with a smaller weight than s has with its uniquely connected minima or maxima (line 10). If there is such a partner, we check whether there are multiple connections between these two saddles by calling getUniqueSaddleConnector (line 11). If the connection is unique we use it as an augmenting path and return (line 13, 14 and 15). In the discrete Morse setting of Forman’s theory, saddle connectors can merge and split. This property prohibits a direct walk starting at a saddle as we have done for the 0- and 2-separation lines. Saddle connectors could be computed by definition as the intersection of the two corresponding separation surfaces [21], but this would
Efficient Computation of a Hierarchy of Discrete 3D Gradient Vector Fields
9
Algorithm 3 getUniqueSaddleConnector Input: separation sur f ace sepSur f , saddle s Output: sepLine, isCircle 1: sepLine ← nil, 2: queue ← nil, queue.push(s) 3: while queue 6= 0/ do 4: curNode ← queue.pop(), numNeighbors ← 0 5: nodeList ← getAllNeighborsInSur f ace(curNode, sepSur f ) 6: for all m ∈ nodeList do 7: if isVisted[m] = f alse then 8: if numNeighbors > 1 then 9: isCircle ← true 10: return 11: else 12: queue.push(m), sepLine.push(getLink(m, curNode)) 13: isVisted[m] ← true 14: numNeighbors ← numNeighbors + 1
result in a infeasible running time. Instead, we compute the intersection directly using the function getUniqueSaddleConnector, shown in Algorithm 3. Consider a set of 1- and 2-nodes representing a separation surface, and a saddle s in the boundary of this surface. We first push s in a queue (line 2). This queue will allow the traversal of the saddle connector. For the first element of the queue, we collect all neighboring 1- and 2-nodes in the node list given by the separation surface (line 4 and 5). Note that the saddle connector is a 1-streamline and its edges must alternate between the matching and its complement. This is achieved by the function getAllNeighborsInSurface. The main idea is now to check for split events in the intersection. If there is such an event, we know that there are multiple connections between the two saddles since by definition the intersection always ends in the complementary saddle. We test each of these nodes if they were already visited (line 6 and 7). In order to check for split events, we need to count the number of possible extensions of the saddle connector. If there are more than one, the algorithm returns with a boolean indicating multiple connections (line 8, 9 and 10). If this is not the case, the current node is an extension of the saddle connector. The node is added to the queue and the corresponding link to the saddle connector. The number of possible extensions is increased by one (line 12, 13 and 14). The loop ends in the other saddle, and the links describing the saddle connector are in sorted order. Extraction of Extremal Structures. Given a nested sequence of combinatorial gradient vector fields V = (Vk )k=k0 ,...,kn , an arbitrary element of the sequence can be restored as follows: first we take the coarsest possible field Vkn . This is the final result of Algorithm 1. Note that this field can be efficiently represented by a boolean vector whose size is given by the number of edges in G. Then, this field is iteratively augmented along the augmenting paths computed in Algorithm 1 in reverse order (Vkn−1 ,. . ., Vk1 ). The augmentation of a field V` along an alternating path p` is given by the symmetric difference V`−1 = V` 4 p` . In contrast to (2) this augmentation increases the number of critical nodes by two. The augmentation stops if the de-
10
D. G¨unther et al.
Data Set (Size) Neghip 643 Hydrogen 1283 Aneurism 2563 Beetle 4162 × 247 Benzene 4013 Synthetic 10243
Initial Matching Speed Up 5% Simplification 12 cores (1 core) Complete Hierarchy 6 sec 10.3 11 sec (1 min 2 sec) 11 sec 51 sec 11.6 2 min 13 sec (9 min 53 sec) 2 min 13 sec 7 min 02 sec 11.54 15 min 45 sec (81 min 12 sec) 21 min 39 sec 18 min 43 sec 11.46 34 min 26 sec (214 min 26 sec) 41 min 19 sec 30 min 46 sec – 33 min 1 sec 33 min 7 sec 8h 26 min 19 sec – 8h 45 min 22 sec 8h 49 min 16 sec
|V5% | |V | 4974 5023 87821 87825 38542 48561 309290 321222 92 123 203 243
Peak Memory Memory Factor 1 MB 1 8 MB
1
107 MB
1.59
260 MB
1.52
392 MB
1.51
6.3 GB
1.51
Table 1 Running times and memory consumption for six data sets of varying dimensions. The computation of the initial matching with 12 cores and, as reference, for 1 core is shown in the second column. The resulting speed up factor is shown in the third column. The running time for a 5% and a complete simplification, and the number of levels in the hierarchies are shown in the fourth and fifth column. The peak memory consumption and the memory factor for a full simplification including the augmenting paths are shown in the sixth and seventh column.
sired number of critical nodes is achieved or the weight of the last augmenting path corresponds to a prescribed threshold. For a certain level in the hierarchy V , the critical nodes are computed by collecting all unmatched nodes. From each of the collected 1- and 2-nodes, the 0- and 2-separation lines are computed by following the combinatorial flow. The separation surfaces are restored by a depth-first search similar as is used in Algorithm 2. For the computation of the saddle connectors, we can use Algorithm 3 in a slightly modified version. Instead of returning when a split event was found, a new line is started. The geometric embedding is given by the grid structure of the input data. Note that the extremal structures can not be easily updated incrementally. Memory Consumption. For the construction of the hierarchy, a boolean vector, whose size is given by the number of edges in G, is needed to represent the current matching. The number of nodes in the cell graph is eight times the number of vertices in the input grid. The number of edges in G is therefore bounded by 24 times the number of vertices. Since the size of a boolean is 1/32th of a single precision number we need a factor of 0.75 of the input data to represent the matching. Three additional boolean vectors of size of number of nodes are necessary for the surface integration, its intersection, and the node matching. The total factor is therefore 1.5 of the input data. Robins proved that the critical points are in a one-to-one correspondence to the topological changes in the lower level sets [18]. Since (2) only decreases the number of critical nodes, the size of the priority queue is given by the number of critical points in the input field. The theoretical maximal memory consumption for separation surfaces is bounded by the number of 1- and 2-nodes in G.
Efficient Computation of a Hierarchy of Discrete 3D Gradient Vector Fields
a)
b)
11
c)
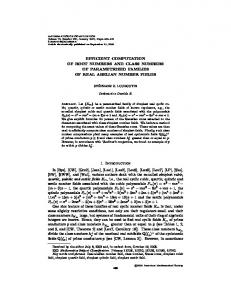
Fig. 4 This image shows the critical points and the p-separation lines of a synthetic example for different levels of detail. Minima, 1-saddles, 2-saddles and maxima are depicted as blue, green, yellow and red spheres respectively. The p-separation lines are shown as blue (p = 0), green (p = 1) and red (p = 2) lines. Image a) shows the initial Morse matching Vk0 whereas b) and c) show the level Vkn −13 and Vkn −4 . The isosurface (grey) in c) illustrates the most dominant minima and maxima regions. The hierarchy consists of 243 levels.
4 Examples In the following, we present some examples to illustrate our method. All experiments were done on an AMD Opteron 6174 CPU. To compute the initial matching, we implemented an OpenMP version of ProcessLowerStar. Table 1 shows the running time and memory consumption for different 3D data sets. The neghip, hydrogen and aneurism are provided by The Volume Library [19] while the beetle data set is provided by Gr¨oller et al. [6]. We give the running time for the computation of the initial matching with 12 cores and 1 core, respectively, and the corresponding speed up factor. Besides computing the complete hierarchization, it is in some cases sufficient to compute only a subsequence of V in order to remove only the most spurious/noisy extremal structures. Therefore, we also give the computation time of the algorithm for a 5% simplification, i.e., until the weight of the last augmenting path corresponds to 5% of the data range. The corresponding number of hierarchy levels is given as well. The memory consumption is measured by observing the peak memory usage during computation. This includes also the augmenting paths. The memory factor relates the consumption to the file size (single point precision). Figure 4 shows the extremal structures for different levels of detail of a synthetic example. The running time and memory consumption is also given in Table 1. The speed up factor is nearly optimal and scales with the dimensions of the data set. The construction time of V for the complex aneurism data set was approximately 21 minutes, which correlates to the work of Gyulassy et al. [8] with a reasonable valence parameter. This example shows also that the topological complexity of the initial field influences the running time. For simple data sets as the neghip or hydrogen there is nearly no difference in running time between a 5% and a full simplification. The overall running time and the practical memory consumption, which is less than a factor of two of the input data, allows for the analysis of large data with an appropriate topological complexity.
12
a)
D. G¨unther et al.
b)
Fig. 5 Extremal structures of the electrostatic field of a benzene molecule for Vkn −90 with 181 critical points. (a) shows the minimal structures: the 48 minima (blue spheres), 78 1-saddles (green spheres), 0-separation lines (blue lines) and the 1-separation surface (blue surface). (b) shows the maximal structures: the 12 maxima (red spheres), 43 2-saddles (yellow spheres), 2-separation lines (red lines) and the 2-separation surface (red surface). Ude to symmetry, only one half of the separation surfaces is shown. Note that 1-separation surfaces separate the flow given by the 0-streamlines, while 2-separation surfaces separate 2-streamlines. Triangulating the 2-nodes of 1-separation surfaces therefore does not necessarily lead to closed surfaces in contrast to 2-separation surfaces.
Comparison of Continuous and Combinatorial Extremal Structures. Figures 5 and 6 visualize the extremal structures of the electrostatic potential around the benzene molecule. This data set has been analyzed by Theisel et al. [21] using numerical methods, and we use their results for a side-by-side comparison of continuous and combinatorial structures. To achieve comparable results, we chose the hierarchy level Vkn −90 where we have the same number of 1- and 2-saddles as in the continuous case. The data set is sampled on a 4013 regular grid using the fractional charges method [20]. The running time is shown in Table 1; the extraction of the critical points and the p-separation lines for an arbitrary element of V took at most 20 seconds whereas the separation surfaces took at most 60 seconds. Figure 5 shows our combinatorial result from a top view. Note how the regularity of the underlying data set has been perfectly captured. This poses a challenge for numerical algorithms, since guarantees about finding all critical points can usually not be given. The side-by-side comparison of the continuous and the combinatorial extraction results is shown in Figure 6. We make the following observations: First, the continuous version is not only visually more pleasing, but it better communicates the smooth nature of the flow to a viewer. For such purposes, the classic continuous methods are preferable over the combinatorial ones. Second, numerical algorithms require a larger number of parameters, which are often difficult to choose. In this example, the continuous version misses some saddle connectors, since a certain maximal number of integration steps had to be chosen for the extraction algorithm [21]. Of course, we could have changed that parameter and re-run the algorithm by Theisel et al. [21], but this still would not make it a proofably watertight case. Our combinatorial algorithm, on the
Efficient Computation of a Hierarchy of Discrete 3D Gradient Vector Fields
a)
13
b)
Fig. 6 Comparison of combinatorial and continuous extremal structures for the electrostatic field around a benzene molecule. Image a) shows smooth extremal structures extracted as in [21]. The minima and the maxima are depicted as blue and red spheres while the 1- and 2-saddles are shown as blue and red disks respectively. The saddle connectors are shown as blue-red stripes. Gray illuminated lines represent streamlines emanating from the saddles. Image b) shows combinatorial extremal structures. The minima, 1- and 2-saddles, and the maxima are represented by blue, green, yellow and red spheres respectively. The saddle connectors are shown as green lines. Gray illuminated lines depict the 2-separation lines emanating from the 2-saddles. Gray surfaces depict the carbon and the hydrogen atoms and their bonds.
other hand, captures all connectors by design. Hence, combinatorial methods are preferable over continuous ones if proofable correctness is the primary goal, e.g., if the extraction results are supposed to serve as an input for a further analysis.
5 Conclusions and Future Work We presented a novel combinatorial algorithm to construct a weighted hierarchy of combinatorial gradient vector fields for 3D scalar data. The hierarchy represents the combinatorial flow for different levels of detail and implicitly defines the extremal structures. The weighting enables a distinction between spurious and dominant extremal structures. The hierarchy is efficiently represented by a sequence of augmenting paths. As seen in Table 1 the running time scales reasonable for common data sets. The memory consumption of Algorithm 1 is bounded. This allows for an analysis of large data sets. Our algorithm could allow for an extension of other methods that make use of a combinatorial gradient vector field such as topological smoothing [23] or tracking of critical points [17] to 3D.
Acknowledgements This work was supported by the Max-Planck Institute of Biochemistry, Martinsried, and the DFG Emmy-Noether research program. The authors would like to thank
14
D. G¨unther et al.
Daniel Baum, Ingrid Hotz, Jens Kasten, Michael Koppitz, Falko Marquardt, and Jan Sahner for many fruitful discussions on this topic.
References 1. U. Bauer, C. Lange, and M. Wardetzky. Optimal topological simplification of discrete functions on surfaces. CoRR, abs/1001.1269, 2010. 2. A. Cayley. On contour and slope lines. The London, Edinburg and Dublin Philosophical Magazine and Journal of Science, 18:264–268, 1859. 3. M. K. Chari. On discrete Morse functions and combinatorial decompositions. Discrete Math., 217(1-3):101–113, 2000. 4. H. Edelsbrunner, D. Letscher, and A. Zomorodian. Topological persistence and simplification. Discrete and Computational Geometry, 28(4):511–533, 2002. 5. R. Forman. Morse theory for cell complexes. Advances in Mathematics, 134:90–145, 1998. 6. M. E. Gr¨oller, G. Glaeser, and J. Kastner. http://www.cg.tuwien.ac.at/research/publications/2005/dataset-stagbeetle/. 7. A. Gyulassy. Combinatorial construction of Morse-Smale complexes for data analysis and visualization. PhD thesis, University of California, Davis, 2008. 8. A. Gyulassy, P.-T. Bremer, V. Pascucci, and B. Hamann. Practical considerations in MorseSmale complex computation. In Topological Methods in Visualization (TopoInVis), 2009. 9. A. Hatcher. Algebraic Topology. Cambridge University Press, Cambridge, U.K., 2002. 10. M. Joswig and M. E. Pfetsch. Computing optimal Morse matchings. SIAM J. Discret. Math., 20(1):11–25, 2006. 11. H. King, K. Knudson, and N. Mramor. Generating discrete Morse functions from point data. Experimental Mathematics, 14(4):435–444, 2005. 12. T. Lewiner. Geometric discrete Morse complexes. PhD thesis, Dept. of Mathematics, PUCRio, Aug 2005. 13. T. Lewiner, H. Lopes, and G. Tavares. Optimal discrete Morse functions for 2-manifolds. Computational Geometry: Theory and Applications, 26(3):221–233, November 2003. 14. J. C. Maxwell. On hills and dales. The London, Edinburg and Dublin Philosophical Magazine and Journal of Science, 40:421–425, 1870. 15. J. Milnor. Topology from the differentiable viewpoint. Univ. Press Virginia, 1965. 16. J. Reininghaus, D. G¨unther, I. Hotz, S. Prohaska, and H.-C. Hege. TADD: A computational framework for data analysis using discrete Morse theory. In Mathematical Software – ICMS 2010, pages 198–208. Springer, 2010. 17. J. Reininghaus, J. Kasten, T. Weinkauf, and I. Hotz. Combinatorial feature flow fields: Tracking critical points in discrete scalar fields. Technical Report 11-02, Zuse Institute Berlin, 2011. 18. V. Robins, P. J. Wood, and A. P. Sheppard. Discrete Morse theory for grayscale digital images. In IEEE Transactions on Pattern Analysis and Machine Learning, pages 1–14, 2010. 19. S. R¨ottger. The Volume Library. http://www9.informatik.uni-erlangen.de/External/vollib/. 20. D. Stalling and T. Steinke. Visualization of vector fields in quantum chemistry. ZIB Preprint SC-96-01, 1996. 21. H. Theisel, T. Weinkauf, H.-C. Hege, and H.-P. Seidel. Saddle Connectors - an approach to visualizing the topological skeleton of complex 3D vector fields. In Proc. IEEE Visualization 2003, pages 225–232, Seattle, U.S.A., Oct. 2003. 22. T. Weinkauf. Extraction of Topological Structures in 2D and 3D Vector Fields. PhD thesis, University Magdeburg and Zuse Institute Berlin, 2008. 23. T. Weinkauf, Y. Gingold, and O. Sorkine. Topology-based smoothing of 2D scalar fields with C1 -continuity. Computer Graphics Forum (Proc. EuroVis), 29(3):1221–1230, June 2010. 24. A. Zomorodian. Computing and Comprehending Topology: Persistence and Hierarchical Morse Complexes. PhD thesis, Urbana, Illinois, October 2001.