Jan 3, 1989 - in het openbaar te verdedigen op maandag 27 maart 2017 om ...... 14: end if. 15: end for. Figure 2.4.: The manifold mapping (MM) algorithm ...... of Computational Physics 227.14 (2008), pp. ..... [46] H. R. Fang and Y. Saad.
Efficient numerical methods for partitioned fluid-structure interaction simulations David Blom
Efficient numerical methods for partitioned fluid-structure interaction simulations
Proefschrift ter verkrijging van de graad van doctor aan de Technische Universiteit Delft, op gezag van de Rector Magnificus prof. ir. K.C.A.M. Luyben, voorzitter van het College voor Promoties, in het openbaar te verdedigen op maandag 27 maart 2017 om 12:30 uur door
David Stephen Blom ingenieur luchtvaart en ruimtevaart geboren te Bulawayo, Zimbabwe.
Dit proefschrift is goedgekeurd door de promotor: Prof. dr. ir. H. Bijl copromotor: Dr. ir. A. H. van Zuijlen Samenstelling promotiecommissie: Rector Magnificus, Prof. dr. ir. H. Bijl, Dr. ir. A. H. van Zuijlen,
voorzitter Delft University of Technology Delft University of Technology
Onafhankelijke leden: Prof. dr. ir. C. Vuik, Prof. dr. M. Mehl, Prof. dr. P. Birken, Prof. dr. ir. J. Vierendeels, Prof. dr. ir. B. Koren, Prof. dr. ir. L. L. M. Veldhuis,
Delft University of Technology Universität Stuttgart Lund University Universiteit Gent Eindhoven University of Technology Delft University of Technology, reservelid
Keywords:
fluid-structure interaction, manifold mapping, strongly coupled, spectral deferred correction, higher order time integration
c 2017 by D. S. Blom Copyright
An electronic version of this dissertation is available at http://repository.tudelft.nl/.
I am who I am
Summary Fluid-structure interaction simulations are crucial for many engineering problems. For example, the blood flow around new heart valves or the deployment of airbags during a car crash are often modeled with fluidstructure interaction simulations. Also, to design safe parachutes, simulations are carried out to model the unsteady deformations of the parachute during a jump. Thus, there is an apparent need for multi-physics software codes which can model fluid-structure interaction problems. However, current state-of-the-art solvers cannot be used for design or optimization studies of for example aircraft structures due to long simulation times. This is mainly caused by a large number of coupling iterations needed to reach convergence within each time step for a strongly coupled fluid-structure interaction simulation. Also, a large number of time steps are required to reach an acceptable accuracy in time for unsteady simulations. Hence, there is an urgency for efficiency improvements of fluid-structure interaction solvers. In this thesis, two approaches are investigated to decrease the computational times for a fluid-structure interaction simulation: multi-level acceleration of the coupled problem, and the use of higher order time integration schemes.
Part I. Multi-level acceleration with manifold mapping for partitioned fluid-structure interaction Highly sophisticated software codes are available for each single physical phenomenon. It is desirable to reuse these codes for multi-physics simulations such as a fluid-structure interaction problem where separate fluid and solid solvers need to be coupled. This partitioned approach is in contrast to the monolithic approach where all governing equations are implemented in a single software package and solved as a large system of equations.
vii
Summary The focus of the first part of this thesis is to accelerate the convergence of strongly coupled fluid-structure interaction problems, where the fluid solver and the structure solver are considered as black boxes. We apply manifold mapping to a partitioned fluid-structure interaction problem to decrease the number of sub-iterations of the high-fidelity fluidstructure interaction model and are the first to do so. Low-fidelity models or coarse models based on a coarse grid discretization are used, as well as coarse models based on a different governing equation for the fluidstructure interaction problem. Numerical experiments showed the high potential of the coupling scheme, which can reduce the number of fine model evaluations of a partitioned fluid-structure interaction simulation by approximately 50 % by transferring most of the work to the coarse model. The convergence of the highfidelity model is accelerated even further when information from previous time steps is reused. Hence, manifold mapping can be applied effectively to a partitioned fluid-structure interaction simulation, and its use results in a significant decrease in the number of high fidelity coupling iterations.
Part II. Arbitrarily high order time integration for partitioned fluid-structure interaction simulations using spectral deferred corrections The second part of this thesis focuses on the urgent need to increase the efficiency of unsteady simulations. Numerical simulations of unsteady phenomena, such as the flow over a wind turbine, or the blood flow through an artery, are computationally expensive due to a large number of time steps required to reach an acceptable accuracy. We use the finite volume method with collocated arrangement of the flow variables to spatially discretize the incompressible Navier-Stokes equations. To dampen the checker-board pressure field which appears in the standard collocated grid, commonly the interpolation procedure proposed by Rhie and Chow is utilized for steady-state problems. However, when applied directly to the transient formulation, this method does not ensure time consistency due to pressure oscillations when decreasing the time step. Higher order time integration scheme have a potential gain in efficiency
viii
and accuracy in time. Hence, the primary goal of the second part of this thesis is to present a solution procedure which preserves theoretical orders of accuracy in time for spectral deferred corrections, integral deferred corrections, the Picard Integral Exponential Solver, and implicit Runge-Kutta methods when applied to incompressible flow problems and fluid-structure interaction problems discretized with the finite volume method on collocated grids. The good accuracy and efficiency of the time integration methods have been demonstrated for several numerical examples. The main advantage of the deferred correction schemes over diagonally-implicit Runge-Kutta schemes is the fact that the necessary coefficients to reach a desired order of accuracy are easily obtained by using the quadrature integration rules. For moderate accuracy, the (E)SDIRK methods proved to be competitive to SDC and IDC.
ix
Samenvatting Vloeistof-structuur interactie simulaties zijn essentieel om vele technische problemen op te lossen. Bijvoorbeeld, de bloedstroming rond nieuwe hartkleppen of het gebruik van airbags bij een auto-ongeluk wordt vaak gemodelleerd met vloeistof-vaste stof interactie simulaties. Ook voor het ontwerpen van veilige parachutes is het noodzakelijk dat simulaties worden uitgevoerd om de tijdsafhankelijke vervorming van de parachute tijdens een sprong te kunnen voorspellen. Er is dus een grote behoefte aan software pakketten die vloeistof-vaste stof interactie problemen efficiënt kunnen simuleren. Echter, de huidige generatie software kan niet worden gebruikt voor ontwerp en optimalisatie studies van bijvoorbeeld vliegtuigstructuren vanwege lange simulatietijden. Dit wordt onder andere veroorzaakt doordat een groot aantal koppelings iteraties nodig zijn om te convergeren tijdens elke tijd stap voor een sterk gekoppeld vloeistof-vaste stof interactie simulatie. Er is ook een groot aantal tijd stappen nodig om een aanvaardbare precisie te behalen in tijd voor tijdsafhankelijke simulaties. Vandaar dat er een dringende behoefte is om de efficiëntie van vloeistof-vaste stof interactie simulaties te verbeteren. In dit proefschrift zijn twee benaderingen onderzocht om de efficiëntie te verbeteren van vloeistof-vaste stof interactie simulaties: multi-level acceleratie van het gekoppelde probleem en het gebruik van hogere orde tijd integratie methoden.
Deel I. Multi-level acceleratie met manifold mapping toegepast op gepartitioneerde vloeistof-vaste stof interactie simulaties Zeer geavanceerde software codes zijn beschikbaar voor iedere afzonderlijke fysische verschijnsel. Het is wenselijk om deze codes te hergebruiken voor
xi
Samenvatting multi-physics simulaties zoals een vloeistof-vaste stof interactie probleem waarbij aparte vloeistof en structuur oplossers met elkaar moeten worden gekoppeld. Deze gepartitioneerde benadering staat in contrast met de monolithische benadering waarbij alle vergelijkingen worden geïmplementeerd in een enkel softwarepakket en opgelost als een groot stelsel van vergelijkingen. De focus van het eerste deel van dit proefschrift is het versnellen van de convergentie van sterk gekoppelde vloeistof-vaste stof interactie problemen waarbij de software codes van de afzonderlijke pakketten niet beschikbaar zijn. We gebruiken manifold mapping voor het eerst voor een vloeistof-vaste stof interactie probleem om het aantal sub-iteraties van het high-fidelity model te verminderen. Low-fidelity modellen of grove modellen gebaseerd op een grof rooster worden gebruikt, evenals grove modellen gebaseerd op een andere vergelijking voor het vloeistof-vaste stof interactie probleem. Numerieke experimenten tonen het grote potentieel van de koppelings methode aan, welke het aantal fine model evaluaties van een vloeistof-vaste stof interactie simulatie met ongeveer 50 % kan verminderen doordat het meeste werk wordt uitgevoerd door het grove model. De convergentie van het high-fidelity model wordt nog verder versneld wanneer informatie van vorige tijdstappen wordt hergebruikt. Manifold mapping kan dus worden toegepast op een gepartitioneerde vloeistof-vaste stof interactie probleem, en het gebruik ervan resulteert in een aanzienlijke daling van het aantal high-fidelity koppelings iteraties.
Deel II. Willekeurig hoge orde tijd integratie voor gepartitioneerde vloeistof-vaste stof interactie simulaties aan de hand van spectral deferred corrections Het tweede deel van dit proefschrift richt zich op de noodzaak voor betere efficiëntie van tijdsafhankelijke simulaties. Numerieke simulaties van tijdsafhankelijke verschijnselen, zoals de stroming rondom een windturbine, of de stroming van bloed door een slagader, duren erg lang wat te wijten is aan het feit dat een groot aantal tijdstappen nodig is om een aanvaardbare precisie te bereiken.
xii
We gebruiken de eindige volume methode om de incompressibele NavierStokes vergelijkingen te discretizeren in de ruimte waarbij de vloeistof variabelen op een collocated rooster zijn gedefinieerd. Om de oscillaties in de druk door het gebruik van een collocated rooster te verminderen, wordt gewoonlijk de momentum interpolatie methode van Rhie en Chow gebruikt. Deze is echter ontworpen voor tijdsonafhankelijke problemen. Wanneer deze method echter direct op de tijdsafhankelijke vergelijkingen wordt toegepast, is er geen garantie dat de methode consistent is in tijd door oscillaties in de druk wanneer de tijd stap wordt verminderd. Hogere orde tijd integratie methoden zijn in potentie zeer efficiënt en nauwkeurig in de tijd. Vandaar dat het primaire doel van het tweede deel van dit proefschrift is om een methode te presenteren, die de theoretische orde van nauwkeurigheid in tijd behoudt voor spectral deferred corrections, integral deferred corrections, de Picard Integral Exponential Solver en impliciete Runge-Kutta methoden toegepast op incompressible vloeistof problemen en vloeistof-vaste stof interactie problemen die zijn gediscretizeerd met de eindige volume methode. De goede nauwkeurigheid en efficiëntie van de tijdsintegratie methoden is aangetoond met verschillende voorbeelden. Het belangrijkste voordeel van de deferred correction method ten opzichte van diagonaal-impliciete Runge-Kutta methoden is het feit dat de coëfficiënten die nodig zijn om tot een gewenste orde van nauwkeurigheid te komen eenvoudig te berekenen zijn via de integratie regels.
xiii
Contents Summary
vii
Samenvatting
xi
1. Introduction 1.1. Multi-level acceleration with manifold mapping for partitioned fluid-structure interaction . . . . . . . . . . . . . . . 1.2. Arbitrarily high order time integration for partitioned fluidstructure interaction simulations using spectral deferred corrections . . . . . . . . . . . . . . . . . . . . . . . . . . . . . 1.3. Outline . . . . . . . . . . . . . . . . . . . . . . . . . . . . .
1
I.
2 5 7
Multi-level acceleration with manifold mapping of strongly coupled partitioned fluid-structure interaction 9
2. Coupling schemes for partitioned fluid-structure interaction 2.1. Fluid-structure interaction . . . . . . . . . . . . . . . . . . . 2.2. Manifold mapping . . . . . . . . . . . . . . . . . . . . . . . 2.3. Coarse model optimization . . . . . . . . . . . . . . . . . . . 2.4. Convergence measures . . . . . . . . . . . . . . . . . . . . . 2.5. Coupling schemes for strongly coupled fluid-structure interaction . . . . . . . . . . . . . . . . . . . . . . . . . . . . . .
11 12 14 22 24
3. Numerical results for different coupling schemes 3.1. Unsteady flow in a one-dimensional tube . . . . . . . . . . . 3.2. Fixed cylinder with an attached flexible flap . . . . . . . . . 3.3. Wave propagation in a three-dimensional elastic tube . . . . 3.4. Steady state for fixed cylinder with an attached flexible flap case . . . . . . . . . . . . . . . . . . . . . . . . . . . . . . . 3.5. Unsteady flow in a one-dimensional tube with three levels .
31 32 39 48
25
55 57
xv
Contents 3.6. Wave propagation in a three-dimensional elastic tube with three levels . . . . . . . . . . . . . . . . . . . . . . . . . . . 59 4. Conclusions on multi-level acceleration techniques for strongly coupled fluid-structure interaction 63 4.1. Conclusions . . . . . . . . . . . . . . . . . . . . . . . . . . . 63 4.2. Recommendations . . . . . . . . . . . . . . . . . . . . . . . 65
II. Arbitrarily high-order time integration for partitioned fluid-structure interaction simulations using spectral deferred corrections
67
5. Higher order time integration schemes 5.1. Time integration . . . . . . . . . . . . . . 5.2. Spectral deferred corrections . . . . . . . . 5.3. Integral deferred corrections . . . . . . . . 5.4. Picard Integral Exponential Solver (PIES) 5.5. Implicit Runge-Kutta . . . . . . . . . . .
69 70 70 75 75 80
. . . . .
. . . . .
. . . . .
. . . . .
. . . . .
. . . . .
. . . . .
. . . . .
. . . . .
. . . . .
6. Spatial and temporal discretization of the incompressible NavierStokes equations 6.1. Introduction . . . . . . . . . . . . . . . . . . . . . . . . . . . 6.2. Static grids . . . . . . . . . . . . . . . . . . . . . . . . . . . 6.3. Face-velocity interpolation . . . . . . . . . . . . . . . . . . . 6.4. Solution algorithm . . . . . . . . . . . . . . . . . . . . . . . 6.5. Moving grids . . . . . . . . . . . . . . . . . . . . . . . . . . 6.6. Higher order time integration . . . . . . . . . . . . . . . . . 6.7. Discrete Geometric Conservation Law . . . . . . . . . . . . 6.8. Boundary conditions at the fluid-structure interface . . . . . 6.9. Integral deferred corrections applied to fluid-structure interaction simulations . . . . . . . . . . . . . . . . . . . . . . .
83 84 84 85 86 88 90 91 92 92
7. Numerical results for incompressible flows 95 7.1. Travelling waves . . . . . . . . . . . . . . . . . . . . . . . . 96 7.2. Lid-driven cavity flow . . . . . . . . . . . . . . . . . . . . . 100
xvi
Contents 7.3. Lid-driven cavity flow with time dependent boundary conditions . . . . . . . . . . . . . . . . . . . . . . . . . . . . . . 105 7.4. Flow around a cylinder . . . . . . . . . . . . . . . . . . . . . 108 8. Numerical results for partitioned fluid-structure interaction simulations using integral deferred corrections 8.1. Unsteady flow in a one-dimensional tube . . . . . . . . . . . 8.2. Lid-driven cavity flow with a moving mesh . . . . . . . . . . 8.3. Three-dimensional flow over an elastic structure . . . . . . .
115 116 123 127
9. Conclusions and recommendations for arbitrarily high order time integration 133 9.1. Incompressible flow . . . . . . . . . . . . . . . . . . . . . . . 133 9.2. Partitioned fluid-structure interaction simulations . . . . . . 135 A. Coefficients for the Picard Integral Exponential Solver
137
B. Butcher tableaus for the SDIRK methods
139
C. Butcher tableaus for the ESDIRK methods
143
Bibliography
151
Acknowledgements
165
List of publications
167
Curriculum Vitæ
171
xvii
Chapter 1. Introduction Physics is actually too hard for physicists. (David Hilbert)
Wikipedia1 gives a definition of multi-physics: Multiphysics treats simulations that involve multiple physical models or multiple simultaneous physical phenomena. For example, combining chemical kinetics and fluid mechanics or combining finite elements with molecular dynamics. Multiphysics typically involves solving coupled systems of partial differential equations. Fluid-structure interaction (FSI) is an example where multiple physical models are coupled [10]. Examples where fluid-structure interaction is apparent are aero-elasticity [47], arterial flow [35] and airbag deployment [75]. Also, the deployment of parachute systems [94] can be modeled with fluid-structure interaction solvers. However, current state-of-the-art solvers cannot be used for design or optimization studies of aircraft structures due to large simulation times. For example, an optimization study may require thousands of evaluation points with each requiring an unsteady fluid-structure interaction simulation. One simulation may already take four weeks to perform. Hence, the simulations need to be performed within a reasonable time frame, thus giving the need for an efficiency improvement of fluid-structure interaction solvers. 1
https://en.wikipedia.org/wiki/Multiphysics
1
Chapter 1. Introduction In this thesis, two approaches are investigated to decrease the computational times for a fluid-structure interaction simulation: multi-level acceleration of the coupled problem, and the use of higher order time integration schemes.
1.1. Multi-level acceleration with manifold mapping for partitioned fluid-structure interaction Motivation Highly sophisticated software codes are available for each single physical phenomenon. It is desirable to reuse these codes for multiphysics simulations such as a fluid-structure interaction problem where separate fluid and solid solvers need to be coupled. This partitioned approach [48] is in contrast to the monolithic approach [7, 51, 95] where all governing equations are implemented in a single software package, and solved as a large system of equations. Besides the partitioned and monolithic approach, different mixed forms have been proposed such as a splitting method [3], which separates the fluid-structure system in a fluid velocity part and a pressure-structure part. The implementation of the discretization needs to be available with such an approach, which is generally not the case for commercial packages. This is also a drawback for methods which utilize the exact Jacobian [88]. A large number of coupling schemes which only consider input/output information of the fluid and solid solvers are already available in the literature, such as Aitken’s method [70], vector extrapolation [71], InterfaceGMRES(R) [77, 78], and the Interface Quasi-Newton Inverse Least Squares (IQN-ILS) technique [33, 35]. The IQN-ILS technique [33] is an efficient [32, 37] and robust black-box coupling algorithm for which convergence theorems are available in [56]. The IQN-ILS algorithm is mathematically equivalent to Anderson acceleration [2, 50, 97] which can be categorized as a multisecant method as discussed by Fang and Saad [46]. When applied to linear problems, it can be shown that Anderson acceleration is essentially equivalent to the GMRES method [97], which has also been shown for the IQN-ILS method [55]. An overview of several partitioned coupling techniques applicable to fluid-structure interaction can be
2
1.1. Multi-level acceleration with manifold mapping for FSI simulations found in [3, 22]. The focus of this part is to accelerate the convergence of strongly coupled fluid-structure interaction problems, where the fluid solver and the structure solver are considered as black boxes. An implication of using only input and output information of the fluid and the structural solver is that a large number of sub-iterations is necessary to obtain a strongly coupled solution. This means that both the fluid and structure solver are called multiple times per time step. In case the coupling between the fluid flow and structural deformation is very strong (strongly coupled FSI), which is generally the case for large fluid/solid density ratios or due to the incompressibility of the fluid (see [21]), the convergence of the sub-iterations is hard to achieve. One idea is to perform a large amount of the subiterations with a low-fidelity model, instead of the current high-fidelity flow and structure models [90]. The question remains how to efficiently couple the multi-fidelity models. Van Zuijlen and Bijl [101] developed a multi-level acceleration technique, which is based on the presumed existing geometric multigrid solver for the flow domain. Coarse and fine level sub-iterations are used alternately, resulting in substantial gains in computational costs. This technique hinges on the availability of a geometric multigrid solver for the fluid domain, which poses problems in case black-box solvers are considered. In [23], [51], [60], and [87] the multi-grid solution technique is used in order to decrease the computational effort required to solve the fluidstructure interaction problem. Although multigrid methods can in principle be adapted in such a manner that the acceleration is performed only on the interface, current multigrid methods generally operate on the complete aggregated fluid-structure interaction problem. As opposed to the manifold-mapping technique presented in this work, which acts only on the fluid-structure interface, standard multigrid methods are therefore not applicable to black-box solvers, as these methods are inherently intrusive with respect to the source code of the fluid and structure solvers. Degroote and Vierendeels [36] present the multi-level IQN-ILS algorithm which shows the potential of a multi-level acceleration framework for fluidstructure interaction where the fluid and structure solvers are considered as black boxes. A coarse grid is used as the low-fidelity model in order to build an approximate Jacobian which is reused by the finer grids to
3
Chapter 1. Introduction accelerate the convergence of the IQN-ILS algorithm. However, the coarse grid is only used once per time step to built an approximate Jacobian, and find a better initial guess for the fine grid solution process. It can be expected that the performance of a coupling algorithm which uses a fine grid and coarse grid alternately results in less fine grid iterations as is the case for multi-grid. Originating from multi-fidelity optimization, the aggressive space mapping algorithm has been used by Scholcz et al. [90] to efficiently couple a high-fidelity model with a low-fidelity model for a fluid-structure interaction problem. Scholcz et al. [90] consider the fluid-structure interaction interface problem as an optimization problem. A computationally inexpensive low-fidelity model is combined with a high-fidelity model in order to accelerate the convergence of the high-fidelity model. Bandler et al. [6] proposed the original space mapping algorithm for modeling and design of engineering devices and systems. Thereafter, the aggressive space mapping approach [4] was introduced based on a quasiNewton iteration, which utilizes each fine model iterate as soon as it is available. The basis of the space mapping algorithm is the parameter extraction step which establishes the mapping and updates the surrogate. However, a breakdown of the algorithm may occur due to non-uniqueness of the parameter extraction step [5]. Output space mapping [68] aims at reducing the misalignment between the coarse and fine models by adding the difference between the two to the response of the coarse model. An overview of different space mapping algorithms in given in [5]. When applied to a fluid-structure interaction problem as in this contribution, the different space mapping techniques consider the fluid and solid solvers as black-boxes, i.e. the used discretizations for the fluid and structural domains cannot be changed. Echeverria et al. [43] introduce the manifold mapping algorithm as an alternative to the aforementioned space mapping algorithms. A notable difference between manifold mapping and aggressive space mapping is the fact that the algorithm has provable convergence to the solution of the high-fidelity model, under the assumption that the manifold mapping iterate converges and that the optimization problems are well defined as shown in [43]. However, for a fluid-structure interaction problem, it is difficult to show whether these conditions are met and are therefore not included
4
1.2. Higher order time integration for FSI simulations using SDC here. It is therefore considered as a hypothetical difference between the space mapping and manifold mapping technique. Goal We apply manifold mapping for the first time to a partitioned fluid-structure interaction problem in order to decrease the number of sub-iterations of the high-fidelity fluid-structure interaction model. The fluid and solid solvers are considered as black-boxes. Low-fidelity models or coarse models based on a coarse grid discretization are used, as well as coarse models based on a different governing equation for the fluidstructure interaction problem. The research question is formulated as follows: can manifold mapping be effectively applied to a partitioned fluidstructure interaction simulation, and does its use result in a significant decrease in the number of high fidelity coupling iterations?
1.2. Arbitrarily high order time integration for partitioned fluid-structure interaction simulations using spectral deferred corrections Motivation Unsteady incompressible flows play an important role in many engineering and scientific problems. Examples include flow over a wind turbine [61], blood flow through an artery [11], and the interaction with a propeller of a ship [1]. Numerical simulations of such unsteady phenomena are computationally expensive due to a large number of time steps required to reach an acceptable accuracy. Therefore, there is an urgent need to increase the efficiency of these simulations. The second order backward differencing scheme (BDF2) is commonly applied to discretize the unsteady terms of the Navier-Stokes equations [12]. The BDF2 scheme is unconditionally stable, which explains its popularity. One way to obtain a temporally accurate solution while maintaining computational cost at a reasonable level is to apply a high-order time integration scheme. However, third order and higher order BDF schemes are not unconditionally stable, which prohibits their wide use. An alternative to BDF2 is the diagonally implicit Runge-Kutta (DIRK) method, which can be constructed at arbitrarily high order while retaining
5
Chapter 1. Introduction good stability properties [67, 83]. But their derivation becomes increasingly difficult due to an increase in order conditions when increasing the order of the scheme [67]. Examples of the application of DIRK methods to incompressible flow are available in literature [65, 66, 81], and have shown to outperform BDF2 in terms of accuracy and computational costs. A different approach to time integration is taken by Dutt et al. [40], who have introduced the spectral deferred correction scheme (SDC). Highorder approximations are computed for a time step by solving a series of correction equations on a number of sub-steps. The corrections are applied iteratively to an initial solution defined on the sub-steps of a time step. Each correction iteration, or so-called correction sweep, increases the formal order of accuracy of the method [59, 79]. The sub-steps are chosen to correspond to quadrature nodes, and therefore the time integrals can be computed to a high order of accuracy. Closely related to SDC methods is the integral deferred correction (IDC) technique. IDC methods have been developed to be able to use uniform sub-steps within one time step [29]. These methods still achieve a high order of accuracy. One notable advantage of implicit IDC methods is the fact that these methods are L-stable or unconditionally stable, which is not necessarily the case for spectral deferred correction schemes. Christlieb et al. [28] use the integral deferred correction method within an operator splitting framework to obtain higher order approximations of partial differential equations. Besides these methods, the Picard Integral Exponential Solver (PIES) can be used to obtain a user specified accuracy of the solution. Also, the scheme possesses good stability properties, i.e. it is unconditionally stable in case of implicit time stepping [69]. High accuracy is obtained by assuming that the solution at the next time step can be represented by a combination of complex exponential functions. In this thesis, the widely used finite volume method with collocated arrangement of the flow variables is used to spatially discretize the incompressible Navier-Stokes equations. In order to dampen the checker-board pressure field which appears in the standard collocated grid, commonly the interpolation procedure proposed by Rhie and Chow [85] is utilized for steady-state problems. However applied directly to the transient formulation this method does not ensure time consistency due to pressure
6
1.3. Outline oscillations when decreasing the time step [91]. Yu et al. [99, 100] have further shown that other momentum interpolation schemes can also be time step and under relaxation factor dependent. Goal Higher order time integration scheme have a potential gain in efficiency and accuracy in time. Hence, the main goal of the second part is to present a solution procedure which preserves theoretical orders of accuracy in time for SDC, IDC, and PIES when applied to incompressible flow problems and fluid-structure interaction problems discretized with the finite volume method on collocated grids. We show the expected order of accuracy is reached for both the velocity, as well as for the pressure.
1.3. Outline This thesis is divided into two parts, and has the following structure:
Part I. Multi-level acceleration with manifold mapping for partitioned fluid-structure interaction • Chapter 2 introduces several coupling methods including manifold mapping for black-box partitioned fluid-structure interaction simulations. • Thereafter, the potential of manifold mapping is shown with several test case in Chap. 3. • Chapter 4 summarizes the first part and gives recommendations for future research directions.
Part II. Arbitrarily high order time integration for partitioned fluid-structure interaction simulations using spectral deferred corrections • Chapter 5 introduces spectral deferred corrections, integral deferred corrections, the Picard Integral Exponential Solver, and diagonally implicit Runge-Kutta methods.
7
Chapter 1. Introduction • Chapter 6 gives the solution procedures for incompressible flows on static grids and moving grids whilst preserving the theoretical order of convergence of the time integration scheme considered. • The numerical results are split up into two separate chapters. First, the efficiency and accuracy of SDC, IDC and PIES are compared to implicit Runge-Kutta methods and second order backward differencing for incompressible flows in Chap. 7. • Thereafter, several fluid-structure interaction examples are shown in Chap. 8. • Chapter 9 gives conclusions and recommendations on the use of spectral deferred correction methods for incompressible flows and fluidstructure interaction.
8
Part I.
Multi-level acceleration with manifold mapping of strongly coupled partitioned fluid-structure interaction
9
Chapter 2. Coupling schemes for partitioned fluid-structure interaction Music can change the world because it can change people. (Bono)
As mentioned in the introduction, we use the partitioned approach instead of the monolithic approach for fluid-structure interaction simulations. Hence, having the advantage that we consider the fluid and solid solvers as black boxes, and are able to reuse existing software codes, whether they are licensed as open source or closed source. Different coupling algorithms exist to solve for the strongly coupled or monolithic solution. Here, we focus on the manifold mapping approach and shortly discuss other techniques. The fluid-structure interaction problem is introduced in Sect. 2.1 utilizing a black-box notation. Section 2.2 introduces the manifold mapping algorithm, and after that, an overview is given of several other coupling schemes. The next chapter compares the performance with numerical results of the different coupling schemes. Parts of this chapter have been published in • D. S. Blom et al. “Multi-level acceleration with manifold mapping of strongly coupled partitioned fluid-structure interaction”. In: Computer Methods in Applied Mechanics and Engineering 296 (2015), pp. 211–231. doi: 10.1016/j.cma. 2015.08.004; • D. S. Blom et al. “Multi-Level Acceleration of Parallel Coupled Partitioned FluidStructure Interaction with Manifold Mapping”. In: Lecture Notes in Computational Science and Engineering. Vol. 105. Springer International Publishing, 2015, pp. 135–150. doi: 10.1007/978-3-319-22997-3_8;
11
Chapter 2. Coupling schemes for partitioned fluid-structure interaction
Interface Γf s Solid Ωs
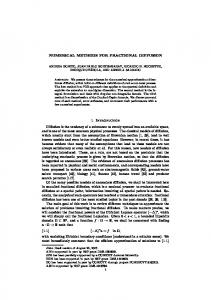
Fluid Ωf Figure 2.1.: Schematic of a fluid-structure interaction problem with a fluid domain Ωf and solid domain Ωs . The interface Γf s is defined as the boundary between the two domains.
2.1. Fluid-structure interaction The fluid-structure interaction problem is partitioned into a fluid domain Ωf and a solid domain Ωs , as shown in Fig. 2.1 The separate domains are coupled on the fluid-structure interface Γf s through the interface conditions consisting of the kinematic and dynamic boundary conditions. The fluid solver and solid solver are considered as black boxes. In other words, only the input and output information is accessible. Whether a compressible or incompressible, viscous or inviscid flow is considered does not influence the used methodology described in this part. Also, different models for the solid domain can be applied, since only the input and output information from the fluid solver and the solid solver is considered to be accessible. Therefore, at each time step the response of the fluid solver Ff is defined as y = Ff (x) , (2.1) where x denotes the displacement of the fluid-structure interface, and y denotes the force acting on the fluid-structure interface. The response of • D. S. Blom et al. “Acceleration of strongly coupled fluid-structure interaction with manifold mapping”. In: Proceedings of WCCM XI, Proceedings of ECCM V, Proceedings of ECFD VI WCCM XI (2014), pp. 1–12.
12
2.1. Fluid-structure interaction the structure solver Fs is consequently defined as x = Fs (y) .
(2.2)
Note that the mentioned variables x and y are defined on the fluidstructure interface. The fluid and solid solvers solve for the state variables in their internal domain, for example, velocity, pressure, and displacement. Generally, the number of degrees of freedom of the interface variables are much smaller compared to the number of degrees of freedom of the state variables, since the interface is defined on a smaller dimension. For example, for a three-dimensional flow around a wind turbine, the interface is the surface of the wind turbine. For a sequential execution of both solvers, the fixed point equation x = Fs ◦ Ff (x)
(2.3)
must be satisfied at every time step. This can also be written as the interface residual R R (x) = Fs ◦ Ff (x) − x, (2.4) which is solved with a minimization or optimization procedure aimed to find the optimal solution x? such that x? = arg min ||Fs ◦ Ff (x) − x||2 . x
(2.5)
For a parallel execution of both solvers, a different fixed point equation can be formulated: � �� � � � 0 1 Ff (x) x = . (2.6) 1 0 Fs (y) y When written as a residual, the following notation applies: � �� � � � 0 1 Ff (x) x R (x, y) = − . 1 0 Fs (y) y
(2.7)
For the sake of reuse of notation for both the sequential and parallel case, we also refer to the last definition of the residual as R (x). In this case, x consists of both displacement and force values. Standard approaches used to solve the strongly coupled fluid-structure
13
Chapter 2. Coupling schemes for partitioned fluid-structure interaction interaction problem are the Gauss-Seidel method [47], fixed under-relaxation [26], Aitken under-relaxation [70], and the IQN-ILS method [33, 36]. These minimization procedures require the evaluation of the interface residual multiple times per time step, which is considered to be expensive for highfidelity models. Algorithms originally developed to accelerate a high-fidelity optimization process by using a lower fidelity model, i.e. multi-fidelity optimization, such as aggressive space mapping [4] and output space mapping [68], can also be used to minimize the interface residual. The high-fidelity optimization process is accelerated by using a surrogate model which closely resembles the response of the high-fidelity model, but requires much less computational time. Naturally, the surrogate model is less accurate than the high-fidelity model, but it is corrected by the high-fidelity model during the optimization process. Scholcz et al. [90] proposed a framework for the application of the space mapping technique to partitioned fluid-structure interaction problems, to speed up the convergence of high-fidelity simulations. The application of the aggressive space mapping algorithm was demonstrated on various academic fluid-structure interaction problems. Here, the use of manifold mapping [42] is investigated to solve the partitioned fluid-structure interaction problem. Manifold mapping has proven to be an efficient algorithm resulting in less high-fidelity iterations compared to aggressive space mapping [42] and output space mapping [38].
2.2. Manifold mapping Manifold mapping is a surrogate-based optimization technique, which means that the quality of the initial solution or approximation of the low-fidelity model is iteratively improved. The goal of a surrogate-based optimization technique is to decrease the computational time of the optimization process of the high fidelity model by combining it with a low fidelity model. Here, a fluid-structure interaction simulation is considered for which the coupling represents the optimization problem. Refer to Eqn. (2.5) for the staggered case, and to Eqn. (2.7) for the residual of the parallel case. In the following subsection, the basic terminology is introduced, and the manifold mapping algorithm is shown. The reader is referred to Echeverria et al. [43] for the theoretical basis of the technique.
14
2.2. Manifold mapping
2.2.1. Manifold mapping terminology Two types of models are distinguished: a fine model and a coarse model. It is assumed that the fine model is accurate, but requires a high computational cost to evaluate. On the contrary, the coarse model is considered to be computationally less costly, but also less accurate in comparison to the fine model. Fine model The fine model response is denoted by f : X ⊂ Rn → Rn , where x ∈ X represents the control variable of the optimization problem. The fine model cost function is defined as F (x) = ||f (x) − q||, which represents the discrepancy between the design specification q ∈ Rn and a particular response of the model f (x). Therefore, a minimization problem needs to be solved: xf ? = arg min ||f (x) − q|| . (2.8) x∈X
When the manifold mapping technique is applied to the fluid-structure interaction problem, the fine model response is defined as the interface residual: f (x) = Fs ◦ Ff (x) − x. (2.9)
The design specification q is the zero vector for the fine model. For consistency, q is not dropped from the formulation, since the design specification of the coarse model is not the zero vector, but updated at each manifold mapping iteration. Coarse model The coarse model response is denoted by cz : Z ⊂ Rm → Rm , where z ∈ Z represents the control variable of the coarse model: cz (z) = Cs ◦ Cf (z) − z.
(2.10)
Cf and Cs represent the coarse model fluid and solid operators. Similar to the fine model cost function, the coarse model cost function is defined as C (x) = p−1 (cz (p (x))) − q k , with the mapping p : X → Z, and the inverse of the mapping p−1 : Z → X. p can be interpreted as a mapping 15
Chapter 2. Coupling schemes for partitioned fluid-structure interaction from the fine model design space to the coarse model design space. The design specification q k ∈ Rn of the coarse model is iteratively updated during the minimization process of the fine model. Subscript k represents the iteration counter of the manifold mapping algorithm. Therefore, the optimization of the surrogate model, which uses the coarse model, is defined as x?c = arg min p−1 (cz (p (x))) − q k . (2.11) x∈X
The optimization procedure of the coarse model is performed on the so-called coupling grid, as is also the case for the multi-level IQN-ILS algorithm [36]. The coupling grid has the same dimension as the dimension of the design space X and can represent the fine model responses exactly. Hence, the coarse model response cz is interpolated to the coupling grid at every coarse model evaluation with the mapping p−1 , and the control variable x is also interpolated from the coupling grid to the coarse model interface at every coarse model evaluation with the mapping p. In case a coarse grid is used for the coarse model, then the mappings p and p−1 represent restriction and interpolation operators on the fluid-structure interface. Radial basis function interpolation is used for the mapping p between the fine model design space X and the coarse model design space Z, and for the mapping p−1 as well. Figure 2.2 shows the concept of the coupling grid. Only the fluid model is shown in the figure. In the remainder of this work, the coarse response is denoted by c defined in X c (x) = p−1 (cz (p (x))) . (2.12) This means, the mapping p and the inverse mapping p−1 are implicitly assumed for simplicity, and are not included in the formulations. Standard approaches for solving the partitioned fluid-structure interaction problem as the Gauss-Seidel method [47], fixed under-relaxation [26], Aitken under-relaxation [70], and the IQN-ILS method or Anderson acceleration [33, 36] can readily be applied to the coarse model optimization problem in case the design specification q k is included in the interface residual. Section 2.3 describes the used algorithm to solve the coarse model optimization problem.
16
2.2. Manifold mapping
Coarse model (fluid) Interpolation
Interpolation
Fine model (fluid)
Coupling grid
Figure 2.2.: Schematic of the coupling grid used for the interpolation between the fine model and coarse model of the fluid and solid solvers. Only the fluid part is shown here. Note that the interface only consists of the surface of the airfoil in this case.
2.2.2. Manifold mapping algorithm The manifold mapping algorithm, as proposed in [41], introduces the mapping S : c (X) → f (X) with the goal to correct for the misalignment between � � the fine and coarse � � model. With the mapping S, the response � � ? c xf is mapped to f x?f , and the tangent plane for c (X) at c x?f � � is mapped to the tangent plane for f (X) at f x?f . Figure 2.3 shows a sketch of the rotated and translated coarse model. S is defined as the affine mapping S (c (x)) = f (xf ? ) + S (c (x) − c (xf ? ))
(2.13)
for an unknown solution xf ? and with S specified as S = Jf (xf ) Jc † (xf ) .
(2.14)
The Jacobian of the fine model Jf and the Jacobian of the coarse model Jc are, however, assumed to be unavailable for a black-box fluid-structure interaction problem and will be approximated. The symbol † indicates the pseudo-inverse. Now, each manifold mapping iterate is defined by a coarse
17
Chapter 2. Coupling schemes for partitioned fluid-structure interaction
Coarse model
Coarse model
c (x?c ) f x?f
Fine model
Fine model
�
(a) Original models
f x?f
�
(b) Rotated and translated coarse model
Figure 2.3.: Manifold mapping alignment of the coarse model using rotation and translation
model optimization: † xk+1 = arg min c (x) − c (xk ) + S (f (xk ) − q) , x∈X
(2.15)
where the pseudo-inverse of the manifold mapping function S † is approximated by a sequence Tk , resulting in xk+1 = arg min ||c (x) − q k ||
(2.16)
q k = c (xk ) − Tk (f (xk ) − q) .
(2.17)
x∈X
with
The approximation of the pseudo-inverse of the manifold mapping function Tk requires the singular value decomposition of the matrices ∆Ck and ∆Fk at each iteration k. The columns of ∆C and ∆F span the coarse and fine model tangent space at the current iteration as in � �� ∆Fk = f (xk+1 ) − f (xk ) , · · · , f (xk+1 ) − f xmax(k+1−n,0) (2.18) 18
2.2. Manifold mapping and � �� ∆Ck = c (xk+1 ) − c (xk ) , · · · , c (xk+1 ) − c xmax(k+1−n,0) .
(2.19)
The singular value decomposition’s of ∆C and ∆F are defined as: ∆Ck = Uc Σc VcT
and ∆Fk = Uf Σf VfT .
(2.20)
The design specification q k is updated at each iteration k with Tk given by [41] � � Tk = ∆Ck ∆Fk † + I − Uc Uc T I − Uf Uf T . (2.21)
The manifold mapping procedure is started with an extrapolation step of the solutions of the previous time steps in order to initialize the algorithm with a good initial guess. The resulting algorithm is shown in Fig. 2.4. In Echeverria et al. [43] it is noted that it can be shown that the manifold can be based on any matrix S satisfying � � � mapping� algorithm † † † ? ? Jc xf S = Jf xf . There is complete freedom how S handles com†
ponents � � in �the �complement of�the range of Uc . The general case is S = Jc x?f Jf† x?f + I − Uc UcT A with A any m × m matrix. The particu� � lar case A = I − Uf UfT is considered here such that components in the complement of the range of the left singular vectors Uf are included, as used before in Echeverria and Hemker [41]. Generally, the number of degrees of freedom n on the fluid-structure interface is much larger than the number of columns of ∆Ck and ∆Fk . Therefore, the computational cost of the manifold mapping technique is limited. It mainly consists of the singular value decomposition of two n×k matrices. To reduce the number of fine model evaluations per time step, the matrices ∆Ck and ∆Fk can be combined with the information from r previous time steps, following the IQN-ILS(r) approach [33]: � � ∆Fk = ∆F ∆F u . . . ∆F u−r+2 ∆F u−r+1 (2.22) � � ∆Ck = ∆C ∆C u . . . ∆C u−r+2 ∆C u−r+1 , (2.23) with u + 1 marking the recent time step. The notation MM(r) indicates that information from r time steps is reused. When information from
19
Chapter 2. Coupling schemes for partitioned fluid-structure interaction 1: 2: 3: 4: 5: 6: 7: 8: 9: 10: 11: 12: 13: 14: 15:
x0 = arg minx∈X ||c (x) − q|| T0 = I for k = 0 → kmax do q k = c (xk ) − Tk (f (xk ) − q) xk+1 =� arg minx∈X ||c (x) − q k || �� ∆F = �f (xk+1 ) − f (xk ) , · · · , f (xk+1 ) − f xmax(k+1−n,0) �� ∆C = c (xk+1 ) − c (xk ) , · · · , c (xk+1 ) − c xmax(k+1−n,0) Solve Uf Σf Vf T = ∆F with a singular value decomposition Solve Uc Σc Vc T = ∆C with a singular value decomposition ∆F † = Vf Σf † Uf T � � Tk+1 = ∆C ∆F † + I − Uc Uc T I − Uf Uf T if converged then break end if end for Figure 2.4.: The manifold mapping (MM) algorithm
previous time steps is reused, the mapping matrix Tk does not need to be initialized with the identity matrix at line 2, but can be determined with Eqn. (2.21) (after the first time step). The coarse optimization problem can be solved with a coupling scheme of the users choice. Here, Anderson acceleration is employed to solve the coarse optimization problem. Note that the coupling scheme needs to meet the design specification q k , which can be included in the formulation of the residual for the FSI problem. The mapping matrix Tk is of size n × n which can be prohibitively large for large scale applications. To reduce the memory requirements of the algorithm, the iteratively updated design specification q k can be directly determined with only matrix-vector multiplications such that the memory requirements do not exceed n × k: q k = c (xk ) − Tk (f (xk ) − q) � � � � = c (xk ) − α − ∆C ∆F † α + Uc UcT (α − β) + β, � � with α = f (xk ) − q, and β = Uf UfT α .
20
(2.24)
2.2. Manifold mapping However, in case the simulation environment allows to store the mapping matrix Tk in memory, a secant update similar to the approach taken by Bogaers et al. [19] can be used: Tku+1 = Tku + (∆ C − Tku ∆ F ) ∆ F † ,
(2.25)
�−1 where the pseudo inverse of ∆ F can be computed as ∆ F † = ∆ F T ∆ F ∆FT or via a singular value decomposition in the same manner as used by the original manifold mapping algorithm. The advantage of this approach is that the user does not need to specify the number of time steps the coupling scheme needs to reuse. If the fluid and structure solvers are executed in serial, a separate synchronization step is necessary. Once the solution has been found by the fine model, the degrees of freedom of the coarse model need to be corrected [36]. Two different approaches can be applied. One approach is to restrict the data in the entire fluid and structure domain from the fine model to the coarse model. If such a system is not available since the used solvers are black box solvers, the interface traction calculated by the fine model can be applied to the fluid-structure interface of the coarse model, whereafter the structural equations are solved by the coarse model. When using a mathematical notation, omitting the mappings, we simply have the evaluation of: � xc = Cs y k+1 . (2.26) Note that this approach can result in a difference between the solution of the flow and structure domain after a certain number of time steps. During the manifold mapping iterations, the same interface displacement is applied on the fine model and also on the coarse model. Therefore, only the coarse structural model needs to be synchronized with the fine model if the second synchronization approach is used. If the fine model and the coarse model use exactly the same structural model, the second approach will result in a perfectly synchronized coarse model. However, in case the fluid and structure solvers are executed in parallel, the same interface displacement and interface traction are already applied on the fine model as well as the coarse model. Therefore, a separate synchronization step is not necessary if the data in the entire fluid and structure domain is not restricted from the fine model to the coarse
21
Chapter 2. Coupling schemes for partitioned fluid-structure interaction model.
2.3. Coarse model optimization Anderson acceleration [2, 50, 97] is used to solve the optimization problem of the coarse model (2.16). Anderson acceleration is mathematically equivalent to the IQN-ILS technique [33]. The algorithm is adapted to solve for the design specification q k . The technique is a quasi-Newton method with the aim to minimize the fluid-structure interface residual. To meet the design specification q k , Newton-Raphson iterations are used with index j: ∂c (xj ) ∆xj = q k − c (xj ) ∂x
(2.27)
xj+1 = xj + ∆xj .
(2.28)
The desired value of the residual is the design specification q k , and the difference between the desired value and the current value ∆c = q k −c (xj ) is approximated as a linear combination of the known ∆ci = c (xi )−c (xj ): ∆c ≈
j−1 X
αji ∆ci = Vj αj ,
(2.29)
i=0
where Vj is given as Vj = [∆cj−1 . . . ∆c0 ] .
(2.30)
This is an over-determined problem, and is therefore solved in a least squares sense. The QR-decomposition of Vj is calculated by using Householder transformations: Vj = Qj Rj . (2.31) The coefficient vector αj is found by solving the triangular system Rj αj = Qj T (q k − c (xj ))
(2.32)
for αj by using back substitution. The residual of the least squares solution δ∆c is defined as: δ∆c = ∆c − Vj αj = q k − c (xj ) − Vj αj . 22
(2.33)
2.3. Coarse model optimization ˜ 0 = Fs ◦ Ff (x0 ) and c0 = x ˜ 0 − x0 x x1 = x0 + ω (c0 − q k ) 3: for j = 1 → jmax do ˜ j = Fs ◦ Ff (xj ) and cj = x ˜ j − xj 4: x 5: Vj = [∆cj−1 . . . ∆c0 ] with ∆ci = ci − cj 6: Wj = [∆xj−1 . . . ∆x0 ] with ∆xi = xi − xj 7: Vj = Qj Rj 8: Solve Rj αj = Qj T (q k − cj ) for αj using back substitution 9: ∆xj = β (cj − q k ) + (β Vj + Wj ) αj 10: xj+1 = xj + ∆xj 11: if converged then 12: break 13: end if 14: end for 1: 2:
Figure 2.5.: Anderson acceleration (equivalent to the IQN-ILS method)
The ∆x that corresponds to ∆c is calculated as a linear combination of the previous ∆xj , and is denoted with ∆˜ xj : ∆˜ xj =
k−1 X
αji ∆xi = Wj αj ,
(2.34)
i=0
where ∆x is specified as ∆xi = xi − xj . Wj is determined with Wj = [∆xj−1 . . . ∆x0 ] .
(2.35)
This results in the relation ∆xj = ∆˜ xj − δ∆c
= Wj αj − q k + c (xj ) + Vj αj .
(2.36)
Optionally, under relaxation can be applied on δ∆c, resulting in the following update: xj+1 = xj + β (c (xj ) − q k ) + (β Vj + Wj ) αj ,
(2.37)
with the relaxation parameter β. The final algorithm is shown in Fig. 2.5.
23
Chapter 2. Coupling schemes for partitioned fluid-structure interaction
2.4. Convergence measures To terminate the fine model iterations, a relative convergence criterion based on input and output information is used with a tolerance τf : ||f (x) − q||2 ≤ τf , ||x + q||2 + ε
(2.38)
||c (x) − q k ||2 ≤ τc . ||x + q k ||2 + ε
(2.39)
√ with ε = 2−52 = 2−26 when computing with double precision floats. For the results shown in this part, the relatively strict convergence criterion τf = 10−5 is used for the fine model. The convergence measure of the coarse model is based on input and output information of the coarse model and the iteratively updated design specification q k :
In order to ensure convergence of the manifold mapping iteration, the tolerance parameter τc of the coarse model is set to a stricter value τc = 10−6 . Preliminary computations indicated that in case the convergence measure for the coarse model was set to the same tolerance as the fine model or even less strict, the iterations did not converge to the specified tolerance for the fine model. A different convergence measure for the coarse model would be to monitor the convergence with respect to the first coarse model evaluation during the optimization step as follows: ||c (x) − q k ||2 ≤ τc . ||c (xk ) − q k ||2 + �
(2.40)
This measure can be named a relative residual convergence measure, as the first residual during an optimization step is used to scale the current residual. This approach results in less coarse model iterations, but does not influence the number of fine model iterations significantly. During the first manifold mapping iterations, the termination criterion is less strict compared to Eqn. (2.39), effectively reducing the number of coarse model iterations. The convergence measure becomes more strict, as the manifold mapping iteration process converges to the fine model optimum. Therefore,
24
2.5. Coupling schemes for strongly coupled fluid-structure interaction a tolerance value of τc = 10−2 or τc = 10−3 is sufficient to reach convergence for the fine model, in contrast to the relative convergence measure shown in Eqn. (2.39).
2.5. Coupling schemes for strongly coupled fluid-structure interaction The manifold mapping algorithm is compared to the IQN-ILS algorithm, multi-level IQN-ILS, aggressive space mapping, and output space mapping with several test cases. These techniques are shortly discussed in the following subsections.
2.5.1. IQN-ILS The IQN-ILS algorithm, as discussed in Sect. 2.3, operates only on one level. Hence, this approach is not a multi-level technique. The difference with the algorithm as discussed in Sect. 2.3 is the fact that the design specification q k is the zero vector. The interface residual is minimized directly with the fine model, instead of utilizing a multi-level approach.
2.5.2. ML-IQN-ILS The multi-level quasi-Newton coupling algorithm [36] is based upon the IQN-ILS algorithm. The main difference is the use of coarse grids to accelerate the convergence of the finest level. The ML-IQN-ILS technique constructs the approximation of the inverse of the Jacobian on coarser grid levels, and then iteratively improves the Jacobian on the finest grid level. First, the interface residual is minimized on the coarsest grid level. Then, starting from the current solution, the residual is minimized again on a finer grid reusing the Jacobian information generated on the coarser grid level. The algorithm is shown in Fig. 2.6. The displacement and residual are defined on the so-called coupling grid. At each iteration on every grid level, the fluid and solid solvers interpolate the data from the surface boundary of their grid to the coupling grid. When compared to manifold mapping or other space mapping algorithms, the multi-level IQN-ILS technique does not return to the coarse
25
Chapter 2. Coupling schemes for partitioned fluid-structure interaction 1: 2: 3: 4: 5: 6: 7: 8: 9: 10: 11: 12: 13: 14: 15: 16:
l=k=0 ˜ 0 = Fs ◦ Ff (x0 ) and R0 = x ˜ 0 − x0 x x1 = x0 + ωR0 for i = 1 → g do while ||Rk || > τ or l = 0 do l=0 ˜ k = Fs ◦ Ff (xk ) and Rk = x ˜ k − xk x Construct V and W Calculate the QR-decomposition Vk = Qk Rk Solve Rk αk = −Qk T Rk for αk using back substitution ∆xk = Rk + (Vk + Wk ) αk xk+1 = xk + ∆xk k =k+1 end while l=1 end for Figure 2.6.: The ML-IQN-ILS method. g is the number of grid levels.
level after a fine level evaluation. Therefore, the multi-level IQN-ILS performs fewer iterations on the coarse levels compared to manifold mapping, aggressive space mapping, and output space mapping.
2.5.3. Aggressive space mapping (ASM) Similar to manifold mapping, the aggressive space mapping technique [4] performs a minimization of the coarse model after each fine model iteration. The algorithm is based upon a quasi-Newton method in combination with first-order derivative approximations which are updated by the Broyden formula. Another approach would be to apply the IQN-ILS formulation as in the ASM-ILS technique [90]. The fine model response f (x) needs to be minimized at every time step of the simulation. The space mapping technique introduces the space mapping function such that f (x) = P (x) − x?c , 26
(2.41)
2.5. Coupling schemes for strongly coupled fluid-structure interaction where x?c represents the solution of the coarse model minimization. The space mapping function P is defined as xc = P (x) = arg min ||c (x) − f (xf )|| . x∈X
(2.42)
Thus, the coarse model is optimized with the aim to satisfy the design specification f (xf ) for a given xf . The quasi-Newton method is applied to (2.41), which requires a minimization of the coarse model at each Newton iterate. Therefore, the solution xk is updated at each iteration k with xk+1 = xk + Jk−1 (x?c − xkc ) .
(2.43)
The inverse of the Jacobian of the space mapping function Jk−1 is updated directly with the Sherman-Morrison formula −1 + Jk−1 = Jk−1
−1 ∆xk − Jk−1 ∆z k −1 ∆z k ∆xTk Jk−1
� −1 , ∆xTk Jk−1
(2.44)
with ∆xk = xk − xk−1 and ∆z = z k − z k−1 , and z k is determined by evaluating the space mapping function or the so-called parameter extraction process xkc = arg min ||c (x) − f (xk )|| . (2.45) x∈X
Anderson acceleration as described in Sect. 2.3 is used to find the solution of the coarse model optimization problem where the design specification is given as q k = f (xk ). Contrary to manifold mapping, the convergence of the space mapping iterate to the solution of the fine model problem is not guaranteed, as proven in Echeverria and Hemker [41]. Scholcz et al. [90] also observe this problem for a fluid-structure interaction problem. Their solution is to switch from the space mapping algorithm to the Anderson acceleration method in case the method is not converging.
2.5.4. Output space mapping (OSM) Output space mapping aims at reducing the misalignment of the coarse model response with the fine model response by adding the difference dk =
27
Chapter 2. Coupling schemes for partitioned fluid-structure interaction 1: 2: 3: 4: 5: 6: 7: 8:
x0 = arg minx∈X ||c (x)|| for k = 0 → kmax do dk = c (xk ) − f (xk ) xk+1 = arg minx∈X ||c (x) − dk || if converged then break end if end for Figure 2.7.: Output space mapping (OSM-0)
c (xk ) − f (xk ) to the coarse model response c. At each space mapping iteration k, the following coarse model optimization problem is solved: xk+1 = arg min ||c (x) − dk || , x∈X
(2.46)
which can be interpreted as the manifold mapping algorithm where the mapping matrix Tk is kept constant as the identity matrix, which is denoted by OSM-0. The algorithm is shown in Fig. 2.7. A second formulation of the output space mapping technique includes the Jacobian of the misalignment of the coarse model response with the fine model response: xk+1 = arg min ||c (x) − dk − Jk · (x − xk )|| , x∈X
(2.47)
denoted by OSM-1. In this work, the Jacobian Jk is updated at each iteration k with the Broyden update Jk = Jk−1 +
∆dk − Jk−1 ∆xk ∆xTk , ||∆xk ||
(2.48)
with ∆xk = xk − xk−1 and ∆dk = dk − dk−1 . The algorithm is shown in Fig. 2.8.
28
2.5. Coupling schemes for strongly coupled fluid-structure interaction
1: 2: 3: 4: 5: 6: 7: 8: 9: 10: 11: 12:
x0 = arg minx∈X ||c (x)|| J0 = I for k = 0 → kmax do dk = c (xk ) − f (xk ) xk+1 = arg minx ∈ X ||c (x) − dk − Jk · (x − xk )|| ∆xk = xk+1 − xk ∆dk = dk+1 − dk k −Jk ∆xk Jk+1 = Jk + ∆d||∆x ∆xTk k || if converged then break end if end for Figure 2.8.: Output space mapping (OSM-1)
29
Chapter 3. Numerical results for different coupling schemes Life’s most persistent and urgent question is, ‘What are you doing for others?’ (Martin Luther King, Jr.)
In this chapter the performance of the manifold mapping algorithm for fluid-structure interaction is demonstrated on several test problems: unsteady flow in a one-dimensional tube [34, 36], the two-dimensional incompressible laminar flow around a fixed cylinder with an attached elastic cantilever benchmark [96], and three-dimensional incompressible flow through a flexible tube. A reduction of approximately 50 % in terms of high-fidelity iterations is achieved compared to the state-of-the-art Anderson acceleration algorithm. The convergence of the high-fidelity model is accelerated even further when information from previous time steps is reused. Parts of this chapter have been published in • D. S. Blom et al. “Multi-level acceleration with manifold mapping of strongly coupled partitioned fluid-structure interaction”. In: Computer Methods in Applied Mechanics and Engineering 296 (2015), pp. 211–231. doi: 10.1016/j.cma. 2015.08.004; • D. S. Blom et al. “Multi-Level Acceleration of Parallel Coupled Partitioned FluidStructure Interaction with Manifold Mapping”. In: Lecture Notes in Computational Science and Engineering. Vol. 105. Springer International Publishing, 2015, pp. 135–150. doi: 10.1007/978-3-319-22997-3_8.
31
Chapter 3. Numerical results for different coupling schemes
z
r
p
p
r h L
Figure 3.1.: Geometry of the one-dimensional model for the unsteady, incompressible flow through an elastic tube. The length L, the inner radius r, the pressure p acting on the inner wall of the tube, and the wall thickness h is shown. Deformation of the tube walls in radial direction is caused by the fluid pressure p acting on the inner tube walls. The figure is taken from Mehl et al. [76].
3.1. Unsteady flow in a one-dimensional tube The first case consists of an incompressible, unsteady flow in a flexible tube [34, 36]. The tube has a circular cross-section and length L, as shown in Fig. 3.1. This example is straightforward to implement and is also a good example to verify the performance of a new coupling algorithm since the strength of the coupling can easily be changed.
3.1.1. Governing equation for the fluid model The flow is governed by the equations for conservation of mass and conservation of momentum written in conservative form as ∂a ∂av + = 0, ∂t ∂z and
1 ∂av ∂av 2 + + ∂t ∂z ρf
�
∂ap ∂a −p ∂z ∂z
(3.1) � = 0,
(3.2)
with the coordinate z along the axis of the elastic tube, the cross-sectional area a and the velocity v in z-direction. r is the inner radius of the tube, the time is denoted by t, p represents the pressure, and ρf is the density of the fluid. Gravity and viscosity are not taken into account by the model.
32
3.1. Unsteady flow in a one-dimensional tube
3.1.2. Governing equation for the structure model A Hookean constitutive relation describes the behavior of the elastic tube wall. The inertia of the tube wall is neglected with respect to the inertia of the fluid, resulting in a structure without mass. The stress acting in circumferential direction σφφ is approximated with σφφ = E
r − r0 + σφφ0 r0
(3.3)
for a given Young’s modulus E and radius r0 for which σφφ = σφφ0 . Only radial motion of the tube wall is allowed. The forces acting on the fluidstructure interface are in balance, thus (3.4)
rp = σφφ h.
The following relation can be found after substitution of the constitutive equation (3.3) into (3.4) rp =
Eh (r − r0 ) + r0 p0 , ρr0
(3.5)
which can also be written as a = a0
p0 2ρf p 2ρf
− c2M K
!2
− c2M K
given the Moens-Korteweg wave speed cM K s Eh cM K = . 2ρf r0
,
(3.6)
(3.7)
A non-reflecting boundary condition 1 dp dv = dt cρf dt
(3.8)
is imposed at the outlet of the tube.
33
Chapter 3. Numerical results for different coupling schemes
3.1.3. Discretization The tube is discretized with N cells of length ∆z. The velocity and pressure of the flow are determined in the cell centers. A central discretization is employed for the continuity and momentum equation. However, the convective term of the momentum equation is discretized with a first-order upwind scheme. A backward Euler time integration scheme is used with a time step ∆t. Thus, the discretized conservation of mass in a control volume is given by � ∆z α (pj+1 − 2pj + pj−1 ) = 0, (3.9) aj − anj +vj+ 1 aj+ 1 −vj− 1 aj− 1 − 2 2 2 2 ∆t ρf and the discretized conservation of momentum in a control volume is � ∆z vj aj − vjn anj + vj vj+ 1 aj+ 1 − vj−1 vj− 1 aj− 1 2 2 2 2 ∆t � 1 � + aj+ 1 (pj+1 − pj ) + aj− 1 (pj − pj−1 ) = 0. 2 2 2ρf (3.10) The subscript j, j +1 and j −1 indicates the cell centers and the subscripts j + 12 and j − 12 denotes the values at the face of cells, calculated with v +v v +v +1 a0 vj− 1 = j−12 j and vj+ 1 = j 2j . Coefficient α = v + ∆z is a pressure 2
0
2
∆t
stabilization term which is added to the continuity equation to remove any pressure wiggles as a result of the central discretization of the pressure in the momentum equation, with a given reference fluid velocity v0 . The boundary condition at the outlet for the pressure is discretized as s !2 n n p vout − vout pout = 2ρf c2M K − c2M K − out − . (3.11) 2ρf 4
The velocity at the inlet is calculated as vin = v0 +
v0 sin2 (πnτ ) , 10
(3.12)
where the dimensionless parameter τ is given by the dimensionless time
34
3.1. Unsteady flow in a one-dimensional tube step τ = v0L∆t . Linear extrapolation is performed to determine the pressure at the inlet pin = 2p1 − p2 , (3.13) and the velocity at the outlet
vout = 2vN − vN −1 .
(3.14)
The problem can be described with two dimensionless parameters, namely the dimensionless stiffness κ q p0 Eh 2ρf r0 − 2ρf c0 κ= = , (3.15) v0 v0 and the dimensionless time step τ = v0L∆t . For the computations shown in this section, these two parameters are set to κ = 10 and τ = 0.01, which results in a strong coupling between the fluid and the structure [36]. One period of the inlet boundary condition is simulated, thus 100 time steps. The initial conditions are the dimensionless velocity vc00 = 0.1, the dimensionless pressure ρ pc2 = 0, and the dimensionless cross-sectional area f 0 a = 1. A consistent interpolation is used on the interface with radial basis a0 functions utilizing the globally supported thin plate spline as the basis function [18].
3.1.4. Numerical results First, we study the performance of a range of coupling schemes as discussed earlier. After that, we shortly touch upon the choice of the termination criterion for the surrogate model. Comparison of different coupling algorithms The performance of the manifold mapping algorithm is compared with aggressive space mapping [5, 90], output space mapping [68], multi-level IQNILS (ML-IQN-ILS) [36], and with the IQN-ILS coupling technique [33]. The effect of reuse of information from previous time steps is also demonstrated. Table 3.1 shows the number of iterations for the fine model and the coarse model per time step averaged over the entire simulation. Three
35
Chapter 3. Numerical results for different coupling schemes Table 3.1.: One-dimensional flow through a flexible tube. The influence of the used coarse model is studied. Three different grid sizes for the coarse model are used: 100, 50 and 20. The manifold mapping algorithm (MM) is compared with the quasi-Newton method based on the Broyden update (QN), IQN-ILS, ML-IQN-ILS, aggressive space mapping (ASM), and output space mapping (OSM). The number of coupling iterations per time step has been averaged over the complete simulation.
Method QN(0) IQN-ILS(0) ML-IQN-ILS(0) OSM-0(0) OSM-1(0) ASM(0) MM(0)
FSI-100 nc
nf
9.2 56.8 48.0 24.7 24.4
10.2 8.3 7.2 12.8 6.3 5.4 5.2
FSI-50 nc
nf
9.3 84.2 53.8 27.2 26.7
10.2 8.3 8.5 19.3 7.2 6.0 5.5
FSI-20 nc
nf
9.6 222.1 62.1 35.9 36.0
10.2 8.3 9.0 50.3 8.3 7.8 7.3
coarse models with different grid sizes are used, namely with 20 cells (FSI20), 50 cells (FSI-50) and 100 cells (FSI-100). The fine model uses 1000 cells for every computation. The initial solution of the displacement is determined by a state extrapolation from previous time steps for each numerical method under consideration. The convergence criterion for the fine model is set to τf = 10−6 , and for the coarse model to τf = 10−7 . The use of manifold mapping leads to a reduction in the number of fine model evaluations of approximately 37 % compared to IQN-ILS for the FSI-100 case. When the grid size of the coarse model is decreased, the reduction in the number of fine model evaluations is approximately 33 % and 12 % for FSI-50 and FSI-20, respectively. Similar results are shown in Table 3.2 when reusing information from previous time steps is considered. The use of manifold mapping with reuse of information from previous time steps leads to a reduction in the number of fine model evaluations of approximately 23 %, 16 % and 10 % compared to IQN-ILS with reuse for the FSI-100, FSI-50 and FSI-20 cases, respectively.
36
3.1. Unsteady flow in a one-dimensional tube
Table 3.2.: One-dimensional flow through a flexible tube. The influence of the used coarse model and the reuse of information from previous time steps is studied. The information from four previous time steps is reused. Three different grid sizes for the coarse model are used: 100, 50 and 20. The manifold mapping algorithm (MM) is compared with the quasi-Newton method based on the Broyden update (QN), IQN-ILS, ML-IQN-ILS, aggressive space mapping (ASM), and output space mapping (OSM). The number of coupling iterations per time step has been averaged over the complete simulation.
Method QN(4) IQN-ILS(4) ML-IQN-ILS(4) OSM-0(4) OSM-1(4) ASM(4) MM(4)
FSI-100 nc
nf
3.8 59.8 67.6 18.4 8.0
5.1 3.1 3.4 12.8 6.0 4.2 2.4
FSI-50 nc
nf
3.8 90.8 67.9 19.8 8.7
5.1 3.1 3.8 19.3 6.2 4.5 2.6
FSI-20 nc
nf
3.8 259.9 51.0 23.4 9.6
5.1 3.1 4.4 50.1 6.7 5.2 2.8
37
Chapter 3. Numerical results for different coupling schemes In contrast to manifold mapping and space mapping, the multi-level IQN-ILS algorithm optimizes the coarse model only once per time step. The constructed Jacobian of the coarse model is used to accelerate the convergence of the fine model. Manifold mapping and space mapping iteratively improve the quality of the coarse model approximation explaining the difference in fine model iterations, and also the increase in the number of coarse model iterations compared to ML-IQN-ILS. Output space mapping with the Jacobian included in the surrogate model (OSM-1), and without the mapping Jacobian (OSM-0) are both considered. The use of the mapping Jacobian results in a significant decrease in the number of fine model evaluations compared to OSM-0. Reuse of information from previous time steps does not seem to result in an acceleration of the algorithm. Concluding, manifold mapping shows the best performance regarding the number of fine model iterations in comparison with aggressive space mapping, multi-level IQN-ILS, and output space mapping. The reuse of information from previous time steps further accelerates the algorithm significantly. Convergence measure for the surrogate model For the surrogate model, different convergence measures can be used. Now, we compare the relative convergence measure as shown in Eqn. (2.39) with the relative residual convergence measure as shown in Eqn. (2.40). Table 2.40 shows the iteration counts when using 100 cells for the fine model, and 50 cells for the coarse model which uses a linearized fluid model. In each simulation, we use the manifold mapping algorithm to drive the interface residual below the tolerance τf = 1 · 10−5 . The relative convergence measure for the first set of simulations is set to τc = 1 · 10−7 . The residual relative convergence measure for the second set of simulations is set to τc = 1 · 10−3 . As shown in the table, the residual relative convergence measure results in less coarse model iterations and does not influence the number of fine model iterations significantly when compared to the relative convergence measure. This is because the termination criterion allows for fewer iterations during the first manifold mapping iterations. The convergence measure becomes more strict, as the manifold mapping iteration process converges to the fine model optimum.
38
3.2. Fixed cylinder with an attached flexible flap Table 3.3.: One-dimensional flow through a flexible tube. The influence of the termination criteria for the surrogate model is studied.
Reuse 0
Convergence measure Relative convergence measure Residual relative convergence measure
Reuse 4
nc
nf
nc
nf
32.8 24.1
4.1 4.0
10.4 8.5
2.1 2.2
r = 0.05 m 0.41 m
C
0.35 m
A
0.02 m
y x (0, 0)
2.5 m
Figure 3.2.: Geometry of the cylinder with an attached flap benchmark originally proposed in [96]. The figure shows a channel flow with a fixed cylinder and a flexible flap attached to the cylinder. Point A located at the back of the flap is used as a reference point for the measurements of the displacement. The figure has been taken from Mehl et al. [76].
3.2. Fixed cylinder with an attached flexible flap The second test case, originally proposed in [96], consists of a two-dimensional incompressible laminar flow around a fixed cylinder with an attached flexible cantilever. The geometry of the problem is shown in Fig. 3.2.
3.2.1. Governing equations of the fluid model The governing equations for the fluid are given by the balance of momentum � � ∂v f ρf + ρf ∇v f v f = ∇ · σ f , (3.16) ∂t
39
Chapter 3. Numerical results for different coupling schemes and the balance of mass, which reduces to a divergence free constraint on the velocity field due to incompressibility: ∇ · vf = 0
in Ωf ,
(3.17)
where the velocity field is denoted by v f , the pressure field is denoted by pf , and ρf represents the density. A Newtonian fluid is considered, which leads to the constitutive equation for the stress tensor σ f � � T (3.18) σ f = −pf I + ρf ν f ∇v f + ∇v f , for a given kinematic viscosity ν f .
3.2.2. Governing equations of the structure model The configuration of the structure domain is described by the displacement us . The structure is assumed to be elastic and compressible, and the governing equation is given by the balance of momentum ρs
∂v s + ρs (∇v s ) v s = ∇ · σ s + ρs g ∂t
in Ωst .
(3.19)
Equation (3.19) is modified to use the total Lagrangian description, i.e. with respect to a fixed initial reference state Ωs , resulting in ρs
� ∂ 2 us s −T = ∇ · Jσ F + ρs g ∂t2
in Ωs ,
(3.20)
where the deformation gradient tensor F is defined as F = I + ∇us , and the Jacobian J is the determinant of the deformation gradient tensor F . By applying the constitutive law for the St. Venant-Kirchhoff material, the Cauchy stress tensor σ s is found by applying σs = with E =
40
1 2
1 F (λs (tr E) I + 2µs E) F T , J
� F T F − I , and the shear modulus µs [24].
(3.21)
3.2. Fixed cylinder with an attached flexible flap
3.2.3. Boundary conditions A parabolic velocity profile is prescribed at the inlet, whereas a free outflow condition is prescribed at the outlet. No-slip conditions are prescribed for the fluid on the top and bottom wall, the cylinder, and the fluid-structure interface. At the fluid-structure interaction Γf s , the balance of stresses is enforced through σf n = σsn on Γf s , (3.22) with the unit vector n normal to the fluid-structure interface Γf s , and the stress tensors σ f and σ s . Also, at the fluid-structure interface the velocities v f and v s must be equal: vf = vs
on Γf s .
(3.23)
In case of inviscid flow, the slip boundary condition is applied.
3.2.4. Physical parameters In [96] three different scenarios are presented with different solid to fluid density ratios. For the results shown in this section, the two unsteady fluid-structure interaction cases are selected, namely FSI2 and FSI3. The s s solid to fluid density ratio are set to ρρf = 10 and ρρf = 1, respectively. The Reynolds number based on the diameter of the cylinder is 100 for the FSI2 case, and 200 for the FSI3 case. The reader is referred to [96] for further details on this benchmark problem.
3.2.5. Discretization The fluid domain and structure domain are discretized with a second order finite volume method. A coupled solution algorithm [31] is employed, instead of the well known PISO pressure-velocity coupling technique. Here, the continuity and momentum equation are solved in a fully coupled implicit manner, instead of a segregated approach. A second order backward differencing scheme (BDF2) is used to integrate the governing equations in time. The fluid mesh is deformed with radial basis function interpolation [18]. The coarse model of the flow uses 1 457 cells. The grid is refined
41
Chapter 3. Numerical results for different coupling schemes
(a) FSI2: pressure contours
(b) FSI2: velocity field
(c) FSI3: pressure contours
(d) FSI3: velocity field
Figure 3.3.: Cylinder with an attached flap test case. Pressure and velocity contours of the FSI2 and FSI3 problems.
in each direction with a factor 4, resulting in 23 924 cells for the fine model of the fluid. The mesh of the structural model consists of 40 cells and is uniformly refined to form the fine mesh of the solid containing 328 cells. The computational cost of one coarse model evaluation is approximately 1.4 % of one fine model evaluation. Pressure and velocity contours of the FSI2 and FSI3 problems are shown in Fig. 3.3. For the FSI3 case, the lift and drag are shown for the coarse model and the fine model in Fig. 3.4 for separate computations. The coarse model finds a steady state solution, whereas the fine model finds the periodic solution.
3.2.6. Numerical results The numerical results for this test case are shortly discussed. First, the performance of the manifold mapping acceleration technique is compared with standard coupling techniques. Thereafter, the difference in coupling iterations between the serial and parallel coupling of fluid and solid solvers is discussed.
42
3.2. Fixed cylinder with an attached flexible flap
Fine model Coarse model
Fine model Coarse model
490
200
480 470 Drag [N]
Lift [N]
100
0
460 450 440
100
430 200 0.0
0.5
1.0 Time [s]
(a) Lift
1.5
2.0
420 0.0
0.5
1.0 Time [s]
1.5
2.0
(b) Drag
Figure 3.4.: Cylinder with an attached flap test case FSI3. Lift and drag are shown for t = 0 s until t = 2 s for the fine model as well as the coarse model. The computations shown are executed separately. Note that the fluid domain is initialized with a fully developed flow.
Comparison of different coupling schemes in terms of sub-iterations Table 3.4 and 3.5 list the number of coupling iterations per time steps for the fine and coarse model averaged over one periodic cycle. Again, the performance of the manifold mapping acceleration technique is compared with the quasi-Newton method based on the Broyden update (QN), IQN-ILS, ML-IQN-ILS, aggressive space mapping, and output space mapping. The initial solution of the displacement is determined by a state extrapolation from previous time steps for each numerical method under consideration. Figure 3.5 shows a graph of the convergence history within one time-step for the different coupling algorithms considered. Information from previous time steps is not reused. The figure highlights the fast convergence of the manifold mapping and aggressive space mapping technique compared to IQN-ILS. For the FSI2 benchmark, the number of fine model evaluations is reduced by approximately 49 % in comparison with the fine model only (IQN-ILS). The FSI3 test case shows the same reduction in fine model evaluations of 49 % in comparison with the IQN-ILS algorithm. With reuse of information
43
Chapter 3. Numerical results for different coupling schemes 10-1
QN IQN-ILS ML-IQN-ILS OSM-0 OSM-1 ASM MM
Fine model residual
10-2 10-3 10-4 10-5 10-6 10-7
2
4
6
8 10 Iteration
12
14
16
Figure 3.5.: Two dimensional flow over a fixed cylinder with an attached flexible flap FSI3. The convergence history of the different coupling algorithms is shown for one time step.
from previous time steps, the manifold mapping algorithm can reduce the number of iterations per time step to approximately two iterations for both cases. Results for output space mapping with the mapping Jacobian included in the surrogate model (OSM-1), and without the mapping Jacobian (OSM0) are shown in Table 3.4 and 3.5. For the FSI2 benchmark, the use of the Jacobian leads to an increase in fine model iterations, which indicates that the quality of the Jacobian is not sufficient to result in a speedup. However, for the FSI3 benchmark, the use of the mapping Jacobian results in a minor decrease of fine model evaluations compared to OSM-0. Also, the reuse of information from previous time steps does not influence the results significantly. The aggressive space mapping algorithm is competitive to manifold mapping in case information from previous time steps is not included. However, with information from previous time steps, the decrease in the number of fine model iterations is less compared to manifold mapping. For the FSI2 case, the ML-IQN-ILS shows similar iteration numbers compared to manifold mapping. For the FSI3 case with a strong coupling between the fluid and the solid domain, the differences between manifold
44
3.2. Fixed cylinder with an attached flexible flap Table 3.4.: Two-dimensional flow over a fixed cylinder with an attached flexible flap FSI2. The influence of the reuse of information from previous time steps is studied for different coupling algorithms for the fluid-structure interaction problem. Manifold mapping (MM) is compared with quasi-Newton method based on the Broyden update (QN), IQN-ILS, ML-IQN-ILS, aggressive space mapping (ASM), and output space mapping (OSM).
Method QN IQN-ILS ML-IQN-ILS OSM-0 OSM-1 ASM MM
Reuse 0 nc
nf
11.6 25.2 38.1 27.3 24.3
10.6 8.6 9.6 4.6 5.9 4.3 4.4
Reuse 4 nc
nf
4.6 19.6 47.5 16.0 5.8
6.3 3.6 5.3 4.5 5.3 3.4 2.1
Reuse 8 nc
nf
3.4 19.4 45.6 16.0 5.4
5.7 2.9 4.5 4.5 5.1 3.4 2.0
mapping and ML-IQN-ILS are more substantial. The ML-IQN-ILS algorithm does not return to the coarse model after a fine model evaluation and performs fewer iterations with the coarse model as a result compared to manifold mapping, aggressive space mapping, and output space mapping. Summarizing, the manifold mapping algorithm results in the largest speedup in terms of the fine model evaluations compared to other coupling algorithms. By including information from previous time steps, the number of iterations per time step is decreased substantially. Serial and parallel execution of fluid and solid solvers Table 3.6 shows the averaged iteration numbers for the manifold mapping algorithm and also for IQN-ILS and ML-IQN-ILS. Reuse of information from previous time steps is considered in order to accelerate the convergence of the different coupling schemes. Sequential execution (S) of the fluid and structure solvers is compared with the parallel case (P). In case the sequentially coupled manifold mapping technique (S-MM) is used and information from previous time steps is not included, approxi-
45
Chapter 3. Numerical results for different coupling schemes Table 3.5.: Two-dimensional flow over a fixed cylinder with an attached flexible flap FSI3. The influence of the reuse of information from previous time steps is studied for different coupling algorithms for the fluid-structure interaction problem. Manifold mapping (MM) is compared with quasi-Newton method based on the Broyden update (QN), IQN-ILS, ML-IQN-ILS, aggressive space mapping (ASM), and output space mapping (OSM).
Reuse 0
Method QN IQN-ILS ML-IQN-ILS OSM-0 OSM-1 ASM MM
Reuse 4
nc
nf
13.5 43.1 53.3 37.0 35.1
16.0 11.6 8.9 7.4 7.0 6.0 5.7
nc
nf
4.9 43.3 62.7 27.0 8.5
7.8 4.5 3.7 7.4 5.9 4.9 2.4
Reuse 8 nc
nf
4.3 44.1 59.0 28.3 6.6
6.7 3.1 3.3 7.4 5.8 4.9 2.1
Table 3.6.: Two-dimensional flow over a fixed cylinder with an attached flexible flap FSI3. The influence of the reuse of information from previous time steps is studied for different coupling algorithms for the fluidstructure interaction problem. Manifold mapping (MM) is compared with IQN-ILS and ML-IQN-ILS. Two different cases are considered, the flow and the structure solver are executed sequentially (S) or in parallel (P). The iteration numbers are averaged over the complete simulation.
Method S-IQN-ILS S-ML-IQN-ILS S-MM P-IQN-ILS P-ML-IQN-ILS P-MM
46
Reuse 0
Reuse 8
Reuse 16
Reuse 24
nc
nc
nc
nc
nf 11.6 13.5 8.9 35.1 5.7 26.3 28.8 20.6 150.6 11.2
4.3 6.6 10.8 29.4
nf 3.1 3.3 2.1 5.7 12.7 3.4
4.5 6.5 13.3 32.9
nf 3.3 3.7 2.0 5.7 18.6 3.0
4.6 6.7 14.4 34.7
nf 3.6 3.7 2.0 8.1 20.8 2.9
3.2. Fixed cylinder with an attached flexible flap mately 5.7 fine model iterations are performed at every time step. IQNILS uses almost twice as many iterations per time step (11.6). With reuse of information from previous time steps, the least number of fine model iterations is 3.1 for IQN-ILS. However, this number increases in case information from more than eight time-steps is included. For the manifold mapping algorithm, the number of fine model iterations does not increase in case information from a large number of time steps is taken into account. In case the fluid and the structure solver are executed in parallel, the number of fine model iterations increases to 11.2 for the manifold mapping technique. However, IQN-ILS uses 26.3 iterations per time step. In case information from previous time steps is reused by the different coupling algorithms, the number of fine model iterations decreases significantly. Again, it is important to not include information from a large number of time steps for IQN-ILS, since the number of iterations increases from 5.7 (8 or 16 time-steps reused) to 8.1 (24 time-steps reused). For the manifold mapping algorithm, an increase in fine model iterations is not observed in case the information from an increasing number of time steps is reused. As observed before, the ML-IQN-ILS algorithm uses significantly less coarse model iterations in comparison to the manifold mapping technique since the method optimizes the coarse model only once per time step, whereas for the manifold mapping algorithm the coarse model is optimized at every manifold mapping iteration. Note, in case the fluid and the structure are coupled in parallel, the number of fine model iterations is increased significantly compared to the staggered execution of the fluid and the structure solver. Table 3.7 shows the averaged iteration numbers for the different coupling algorithms in case the Jacobians of the different coupling algorithms are updated with the appropriate secant equation to take into account information from all previous time steps. If we compare these results to those of Table 3.6, Table 3.6 shows worse performance if no time steps are reused, but better performance if the optimal number of time steps are reused.
47
Chapter 3. Numerical results for different coupling schemes Table 3.7.: Two-dimensional flow over a fixed cylinder with an attached flexible flap FSI3. Manifold mapping (MM) is compared with IQN-ILS and ML-IQN-ILS. Two different cases are considered, the flow and structure solver are executed sequentially (S) or in parallel (P). The Jacobians of the different coupling algorithms are updated with the appropriate secant equation to take into account information from all previous time steps. The iteration numbers are averaged over the complete simulation.
Method
Sequential nc
IQN-ILS ML-IQN-ILS MM
5.4 14.2
nf 4.4 4.8 3.2
Parallel nc 8.5 49.9
nf 7.6 8.2 5.5
3.3. Wave propagation in a three-dimensional elastic tube The third example consists of a wave propagating in a straight, threedimensional elastic tube [9, 34, 49]. The geometry of the fluid and the solid domain is shown in Fig. 3.6. The length of the tube is 0.05 m. The tube has a thickness of 0.001 m. The inner diameter of the tube is 0.01 m. Both ends of the tube are fixed. Starting from t = 0 s until t = 0.003 s, the boundary condition for the gauge pressure at the inlet is set to the fixed value 1333.2 Pa. After that, the inlet gauge pressure is set to zero. At the outlet, the pressure is fixed at zero at every time instant. The pressure contours at different time instants are shown in Fig. 3.7.
3.3.1. Physical parameters The fluid domain of the fine model is governed by the incompressible Navier-Stokes equations, as discussed in Sect. 3.2.1. The flow has a density of 103 kg/m3 , and a dynamic viscosity of 3.0 · 10−3 Pa · s. The solid is assumed to be elastic and compressible, as described in Sect. 3.2.2. The density of elastic solid is 1.2·103 kg/m3 , the Young’s modulus is 3.0·105 N/m2 , and Poisson’s ratio is 0.3.
48
3.3. Wave propagation in a three-dimensional elastic tube
Figure 3.6.: Wave propagation in a straight elastic tube. The geometry and a very coarse mesh are shown for both the fluid and solid domain.
(a) t = 0.0050 s, fine model
(b) t = 0.0100 s, fine model
(c) t = 0.0050 s, coarse model
(d) t = 0.0100 s, coarse model
Figure 3.7.: Wave propagation in a straight tube. The pressure contours at different time instants on the fluid-structure interface. The solutions for the fine model are shown on the top, and solution for the coarse model are shown on the bottom. These simulations are executed separately.
49
Chapter 3. Numerical results for different coupling schemes The fluid domain of the coarse model is governed by the incompressible Euler equations, i.e. viscous effects are ignored. Another approach would be to use the one-dimensional solver described in Sect. 3.1 as the coarse model for this test case.
3.3.2. Discretization The same solver as for the fixed cylinder with an attached flexible flap is used to simulate this problem. Thus, a finite volume solver based on a coupled solution algorithm is employed in combination with a secondorder time integration scheme. The coarse model of the fluid uses 2 600 cells, and is refined in each direction with a factor 2, resulting in 20 800 cells for the fine model. Two different cases are considered with regards to the coarse model of the structure. For the first example, the same structural model is used for the coarse model as well as the fine model, since the largest computational time is spent during the fluid evaluation (6 400 cells). The second example consists of a coarsened grid of the structural coarse model (800 cells). The initial solution of the displacement is determined by a state extrapolation from previous time steps for each numerical method under consideration. The computational cost of one coarse model evaluation is approximately 1 % of one fine model evaluation.
3.3.3. Numerical results The numerical results for this test case are shortly discussed. As for the previous test case, the performance of the manifold mapping acceleration technique is compared with standard coupling techniques. Thereafter, the difference in coupling iterations between the serial and parallel coupling of fluid and solid solvers is discussed. Comparison of different coupling schemes in terms of sub-iterations Table 3.8 and 3.9 show the averaged iteration numbers for the manifold mapping algorithm, and also for several other coupling algorithms. Comparing Table 3.8 with 3.9 shows an increase in the number of fine model iterations for the multi-level algorithms when using a coarsened mesh for
50
3.3. Wave propagation in a three-dimensional elastic tube the structure, as is to be expected. However, the ML-IQN-ILS technique shows an increase of 2.8 fine model iterations in case the structural mesh is coarsened and reuse of information from previous time steps is not considered. However, for manifold mapping, aggressive space mapping and output space mapping with the Jacobian information included (OSM-1), the number of fine model iterations increases with approximately one iteration. The use of the manifold mapping algorithm results in a reduction in the number of fine model evaluations of approximately 60 % compared to IQN-ILS without reuse of information from previous time steps, and where the structural mesh is coarsened. With reuse of information, a reduction of 42 % compared to IQN-ILS with reuse is observed for the manifold mapping technique. The use of the aggressive space mapping algorithm results in a comparable reduction of fine model iterations when information from previous time steps is not reused. Reuse of information does not lead to significant computational savings for both cases. Output space mapping with the mapping Jacobian included in the surrogate model (OSM-1), and without the mapping Jacobian included (OSM-0) are both considered. Table 3.8 and 3.9 show that the use of the mapping Jacobian in the surrogate model does not result in a decrease in the number of fine model iterations, compared to OSM-0. On the contrary, the reuse of information from previous time steps leads to an increase in the number of fine model evaluations, which indicates that the quality of the Jacobian is not sufficient to result in a speedup. The use of the multi-level IQN-ILS algorithm results in a significant acceleration of the high-fidelity model. This is also the case when information from previous time steps is included by the algorithm. However, the manifold mapping algorithm is able to reduce the number of fine model evaluations to a larger extent. Concluding, manifold mapping shows the best performance in terms of the number of fine model evaluations in comparison with the quasi-Newton method based on the Broyden update, IQN-ILS, ML-IQN-ILS, aggressive space mapping, and output space mapping. Coarsening of the structural mesh results in an increase of only one fine model iteration. A significant speedup is observed when information from previous time steps is included.
51
Chapter 3. Numerical results for different coupling schemes
Table 3.8.: Three-dimensional flow through a flexible tube. The influence of the reuse of information from previous time steps is studied for different coupling algorithms for the fluid-structure interaction problem. Manifold mapping (MM) is compared with aggressive space mapping (ASM), quasi-Newton method based on the Broyden update (QN), IQN-ILS, ML-IQN-ILS, and output space mapping (OSM). The number of coupling iterations per time step has been averaged over the complete simulation. The structural model used for the coarse and the fine model consists of the same number of finite volumes.
Method QN IQN-ILS ML-IQN-ILS OSM-0 OSM-1 ASM MM
52
Reuse 0 nc
nf
17.2 40.9 63.4 42.9 40.0
24.7 15.6 6.5 5.1 7.0 5.0 5.0
Reuse 4 nc
nf
8.8 33.1 88.2 35.4 19.6
14.5 7.5 4.0 5.1 7.8 5.0 3.4
Reuse 8 nc
nf
7.2 31.2 82.1 33.8 16.4
12.1 5.9 3.9 5.1 7.7 5.0 3.2
3.3. Wave propagation in a three-dimensional elastic tube
Table 3.9.: Three-dimensional flow through a flexible tube. The influence of the reuse of information from previous time steps is studied for different coupling algorithms for the fluid-structure interaction problem. Manifold mapping (MM) is compared with aggressive space mapping (ASM), quasi-Newton method based on the Broyden update (QN), IQN-ILS, ML-IQN-ILS, and output space mapping (OSM). The number of coupling iterations per time step has been averaged over the complete simulation. The structural domain of the coarse model is coarsened in comparison with the fine model.
Method QN IQN-ILS ML-IQN-ILS OSM-0 OSM-1 ASM MM
Reuse 0 nc
nf
18.1 54.0 75.7 52.5 51.0
24.7 15.6 9.3 6.9 8.0 6.0 6.3
Reuse 4 nc
nf
9.0 45.2 92.3 42.0 21.8
14.5 7.5 6.1 6.9 8.2 5.9 3.7
Reuse 8 nc
nf
7.2 43.5 85.0 39.8 17.6
12.1 5.9 4.5 6.9 8.0 5.7 3.4
53
Chapter 3. Numerical results for different coupling schemes Table 3.10.: Three-dimensional flow through a flexible tube. The influence of the reuse of information from previous time steps is studied for different coupling algorithms for the fluid-structure interaction problem. Manifold mapping (MM) is compared with IQN-ILS and ML-IQNILS. Two different cases are considered, the flow and the structure solver are executed sequentially (S), or in parallel (P). The iteration numbers are averaged over the complete simulation.
Method S-IQN-ILS S-ML-IQN-ILS S-MM P-IQN-ILS P-ML-IQN-ILS P-MM
Reuse 0
Reuse 8
Reuse 16
Reuse 24
nc
nc
nc
nc
18.1 51.0 34.0 89.3
nf 15.6 9.3 6.3 30.2 14.6 6.6
7.2 17.6 12.2 37.3
nf 5.9 4.5 3.4 11.0 7.6 4.5
6.2 15.7 10.2 31.9
nf 5.1 4.4 3.4 9.5 7.0 4.3
5.8 15.4 9.3 29.8
nf 4.9 4.6 3.3 8.7 6.9 4.2
Serial and parallel execution of fluid and solid solvers Table 3.10 shows the averaged iteration numbers. The use of the manifold mapping algorithm reduces the number of fine model iterations from 15.6 for IQN-ILS to 6.3 in case the fluid and structure are executed in a sequential fashion and information from previous time steps is not considered. In case information from previous time steps is reused, the number of fine model iterations for IQN-ILS reduces to 4.9, whereas the manifold mapping technique uses just 3.3 iterations per time step. The S-ML-IQNILS scheme outperforms IQN-ILS in terms of fine model iterations, though the manifold mapping technique is observed to use the least amount of fine model iterations. Note that viscous effects are ignored for the coarse model of the fluid domain. When the fluid and structure solvers are coupled in parallel, the number of fine model iterations increases slightly to 6.6 for the manifold mapping technique, whereas the number of iterations for IQN-ILS is almost twice as high compared to the sequential coupling case. Including information from previous time steps accelerates the manifold mapping significantly to only 4.2 fine model iterations per time steps.
54
3.4. Steady state for fixed cylinder with an attached flexible flap case Table 3.11.: Three-dimensional flow through a flexible tube. Manifold mapping (MM) is compared with IQN-ILS and ML-IQN-ILS. Two different cases are considered, the flow and the structure solver are executed sequentially (S), or in parallel (P). The Jacobians of the different coupling algorithms are updated with the appropriate secant equation in order to take into account information from all previous time steps. The iteration numbers are averaged over the complete simulation.
Method
Sequential nf
IQN-ILS ML-IQN-ILS MM
7.4 28.5
nc 6.8 6.7 4.6
Parallel nf 12.0 44.5
nc 11.7 10.8 5.8
Table 3.11 shows the averaged iteration numbers for the same coupling algorithms in case the full Jacobians are updated with the appropriate secant equation in order to take into account the information from all previous time steps. Again, the sequential and the parallel coupling of the fluid and structure solvers is examined. The manifold mapping algorithm clearly outperforms IQN-ILS and the ML-IQN-ILS technique in terms of fine model iterations for both sequential and parallel cases. The number of fine model iterations increases with approximately one iteration for the parallel case compared to sequential coupling, whereas the ML-IQN-ILS and IQN-ILS use 3 and 4 extra iterations, respectively.
3.4. Steady state for fixed cylinder with an attached flexible flap case Thus far unsteady simulations have been performed. Now we are considering a test case with a steady state solution. Steady-state solutions are of much importance for industrial test cases. For example, when studying the cruise flight condition of an airplane, the wings are deformed due to the aerodynamic loading. Hence, there is an interaction between the structure and the flow. Turek and Hron [96] discuss a third setup of the fixed cylinder with an
55
Fine model residual [-]
Chapter 3. Numerical results for different coupling schemes QN IQN-ILS ML-IQN-ILS OSM-0 OSM-1 ASM MM
10−2
10−3
10−4
10−5 5 10 15 Fine model iteration [-] Figure 3.8.: Steady state solution of two dimensional flow over a fixed cylinder with an attached flexible flap FSI1. The convergence history of different coupling methods are shown.
attached flexible flap case which results in a steady state solution, named FSI1. A segregated solution algorithm is employed for the fluid domain to solve the incompressible Navier-Stokes equations. The fluid mesh is deformed with radial basis function interpolation. The coarse model of the flow uses 5 981 cells. After uniform refinement, a mesh is generated consisting of 23 924 cells for the fine model of the fluid. The mesh of the structural model consists of 82 cells and is uniformly refined to form the fine mesh of the solid containing 328 cells. Figure 3.8 shows the convergence history of the quasi-Newton method using a Broyden update (QN), IQN-ILS method, ML-IQN-ILS method, output space mapping (OSM), aggressive space mapping (ASM) and manifold mapping (MM). The fluid and solid solvers are coupled in a serial manner. The figure highlights the fast and regular convergence of the manifold mapping algorithm compared to IQN-ILS. The use of manifold mapping results in a speedup of approximately 2.3 in terms of fine model iterations. The ML-IQN-ILS method needs a lot of fine model iterations before the
56
3.5. Unsteady flow in a one-dimensional tube with three levels method starts to converge. This is probably caused by the fact that the information from the coarse model is included directly in the approximation of the Jacobian of the fine model. Since the coarse model data is not accurate enough, these vectors actually hinder the convergence of the fine model. The aggressive space mapping algorithm needs eight fine model iterations to converge but shows a smaller convergence rate during the last four iterations compared to manifold mapping. Output space mapping with the mapping Jacobian included in the surrogate model (OSM-1) needs a significantly larger number of iterations to converge compared to without using the Jacobian. Output space mapping without the Jacobian outperforms manifold mapping for this example. The only difference between output space mapping without the mapping Jacobian and manifold mapping is the use of the mapping matrix Tk for manifold mapping. When Tk is kept constant as the identity matrix during the complete optimization process, it is equal to output space mapping. Therefore, it can be concluded that the mapping matrix Tk is not accurate enough during the first iterations for manifold mapping. The two algorithms show very similar convergence rates after the first couple of iterations.
3.5. Unsteady flow in a one-dimensional tube with three levels A natural extension of the two-level manifold mapping algorithm is to use three or even more levels. Here, we study the use of three levels. The optimization of the coarse model is accelerated by the manifold mapping algorithm, with an even cheaper and less accurate low fidelity model. The earlier discussed unsteady flow in a flexible one-dimensional tube case is used again to study the use of three levels. From this point on, we only consider the manifold mapping technique as we have already established the good performance of the method compared to other coupling techniques in the previous sections. Table 3.12 shows the iteration counts averaged over the complete simulation where two levels and three levels are considered with different mesh sizes and different settings for reuse of information from previous time
57
Chapter 3. Numerical results for different coupling schemes steps. The governing equations for each fluid model are linearized around the initial state, except for the fine fluid model. The fluid equations for the fine model are still the full non-linear equations, which are coupled to the solid solver. Hence, the fine model is accelerated by a substantially different coarse model. The mesh size of the models is indicated between the brackets. Thus, 2 (100, 1000) represents a two-level simulation with 100 cells for the coarse model, and 1000 cells for the fine model. 3 (20, 50, 1000) indicates a three-level simulation with 1000 cells for the fine model, and 20 and 50 cells for the coarse models. The reuse of information from previous time steps results in the largest reduction in the number of sub-iterations per time step for the fine model, namely from 4.7 - 5.7 to 2.6 - 2.7 sub-iterations depending on the coarse model. The coarse model also benefits largely from reuse of information from previous time steps. The addition of a third level results in a reduction of approximately 25 % - 27 % for the intermediate level (26.4 to 19.2 iterations, and 23.6 to 17.7 iterations) when information from previous time steps is not reused. The number of fine model iterations is not influenced significantly, which can be expected since the accuracy of the coarse models does not differ greatly, and a further speedup of the fine model is therefore not expected. In case information from previous time steps is reused, the addition of a third level results in a reduction of approximately 18 % - 23 % for the intermediate level (10.1 to 7.7 iterations, and 9.8 to 8.0 iterations). For the 2 (50, 1000) and 3 (50, 100, 1000) level simulations, a new level is added in between the original coarse and the fine model with 100 cells. Thus, the accuracy of the coarse model is increased when compared to the two-level setup. One can expect a decrease in the number of fine model iterations for the three-level setup. The number of fine model iterations does decrease by approximately 8 %, but the number of iterations with the coarse model containing 50 cells is increased from 26.4 to 55.5. Thus, it is not necessarily the case that the addition of an extra model results in a speedup of the overall simulation. Table 3.13 shows the number of iterations when the fluid and solid solvers are coupled in parallel. When information from previous time steps is not reused, the acceleration of the coarse model by a third level is substantially larger compared to the serial case, namely from 56.5 iterations to 15.6
58
3.6. Wave propagation in a three-dimensional elastic tube with three levels Table 3.12.: One-dimensional flow through a flexible tube. The influence of three levels within the manifold mapping framework is studied. The number of coupling iterations per time step are shown. The information from previous time steps is reused (0, 4 and 8 time steps). The fluid and solid solver are coupled in a serial or staggered manner. The coarse models use a linearized fluid model instead of the full nonlinear equations. Level 3 is the most accurate model, where level 1 and level 2 represent the coarse models.
Reuse 0
Levels / Histories 2 2 2 3 3 3
(20, 1000) (50, 1000) (100, 1000) (20, 50, 1000) (20, 100, 1000) (50, 100, 1000)
Reuse 4
1
2
3
57.7 51.6 55.5
27.9 26.4 23.6 19.2 16.8 17.7
5.7 5.3 4.7 5.2 4.7 5.0
Reuse 8
1
2
3
15.9 16.1 16.6
10.0 9.6 9.5 7.7 8.0 8.1
2.8 2.7 2.6 2.6 2.6 2.7
1
2
3
15.7 15.8 16.6
9.8 10.1 9.8 7.7 7.8 8.0
2.7 2.7 2.6 2.6 2.6 2.7
iterations for the coarse model with 100 cells (72 %), and 60.9 to 21.7 for the coarse model with 50 cells (64 %). However, when information from previous time steps is reused, it highly depends on the accuracy of the coarse model whether a speedup is observed.
3.6. Wave propagation in a three-dimensional elastic tube with three levels A final example is considered where three levels are applied within the manifold mapping framework. The three-dimensional flow through a flexible tube example, as discussed in Sect. 3.3 is used to study the computational efficiency of the method when applied to three levels. Where previously a simplified one-dimensional model was used, now the fluid and solid domains are governed by the incompressible Navier-Stokes equations and the geometrically non-linear elasticity equations.
59
Chapter 3. Numerical results for different coupling schemes Table 3.13.: One-dimensional flow through a flexible tube. The influence of three levels within the manifold mapping framework is studied. The number of coupling iterations per time step is shown. The information from previous time steps is reused (zero, four and eight time-steps). The fluid and solid solver are coupled in a parallel manner. The coarse models use a linearized fluid model instead of the full nonlinear equations.
Reuse 0
Levels / Histories 2 2 2 3 3 3
(20, 1000) (50, 1000) (100, 1000) (20, 50, 1000) (20, 100, 1000) (50, 100, 1000)
Reuse 4
1
2
3
100.0 88.9 85.8
58.2 60.9 56.5 21.7 19.4 15.6
5.5 5.2 4.5 6.2 5.7 4.5
Reuse 8
1
2
3
23.2 22.8 15.6
17.4 9.2 9.7 9.3 9.4 7.0
3.0 2.3 2.3 3.1 3.1 2.3
1
2
3
22.6 21.4 14.9
16.8 9.2 9.5 9.2 9.0 6.7
3.0 2.3 2.2 3.0 3.0 2.2
3.6.1. Discretization The same structural solver as in Sect. 3.3 is used. The fluid solver is also based on the finite volume method but uses an iterated PISO-like solver to solve the nonlinear incompressible Navier-Stokes equations. Again, a second order backward differencing time integration scheme is used for both the fluid as well as the structural domain. The coarse models for the fluid domain are governed by the incompressible Euler equations. Hence, the coarse models actually simulate different physics. The meshes for the fluid and solid are refined uniformly. Refinement level 1 contains 2 600 cells for the fluid, and 800 cells for the solid. Refinement level 2 has 20 800 cells for the fluid, and 6 400 cells for the solid. Finally, the finest grids contain 166 400 cells for the fluid domain, and 51 200 cells for the solid.
3.6.2. Numerical results Table 3.14 shows the iteration counts averaged over the complete simulation where the fluid and solid solvers are coupled in serial. One set of simulations does not reuse information from previous time steps, whereas
60
3.6. Wave propagation in a three-dimensional elastic tube with three levels Table 3.14.: Three-dimensional flow through a flexible tube. The influence of three levels within the manifold mapping framework is studied. The number of coupling iterations per time step is shown. The information from previous time steps is reused (zero and four time-steps). The fluid and solid solver are coupled in a serial or staggered manner. For the fluid, the coarse models are governed by the incompressible Euler equations, where the fine model is governed by the incompressible Navier-Stokes equations. The values between parentheses indicate the refinement level of the mesh.
Reuse 0
Levels / Histories 1 2 (1, 3) 2 (2, 3) 3 (1, 2, 3)
2
3
1
4.6 3.8 3.9
14.9
36.5 21.3
40.4 109.1
Reuse 4
39.6
2
3
15.5 10.6
2.4 2.5 2.5
the other set reuses information from four previous time steps which is sufficient as shown in Sect. 3.3. The refinement level of the mesh for both the fluid and the solid domains is indicated between parentheses in Table 3.14. Thus simulation 2 (1, 3) indicates a setup with two levels, of which the coarse model uses refinement level 1, and the fine model uses refinement level 3. When only two levels are considered, it can be observed that the manifold mapping method results in a small number of coupling iterations for the fine model, even when the coarse model is coarsened to the point where the computational costs are negligible (3.8 and 4.6 iterations without reuse, and 2.4 and 2.5 iterations with reuse). Note that the coarse model uses a different model for the fluid domain. The use of a more accurate coarse model decreases the number of fine model iterations in case information from previous time steps is not being reused. However, when information from previous time steps is reused, the number of fine model iterations does not differ significantly between different setups. The use of three levels does decrease the number of coarse model iterations for refinement level 2 from 15.5 to 10.6 (32 %). Table 3.15 shows the number of iterations per time steps when the fluid and solid solver are coupled in parallel. Similar conclusions from this table
61
Chapter 3. Numerical results for different coupling schemes Table 3.15.: Three-dimensional flow through a flexible tube. The influence of three levels within the manifold mapping framework is studied. The number of coupling iterations per time step is shown. The information from previous time steps is reused (zero and four time-steps). The fluid and solid solver are coupled in a parallel manner. For the fluid, the coarse models are governed by the incompressible Euler equations, where the fine model is governed by the incompressible Navier-Stokes equations. The values between parentheses indicate the refinement level of the mesh.
Reuse 0
Levels / Histories 1 2 (1, 3) 2 (2, 3) 3 (1, 2, 3)
2
3
1
6.0 6.1 6.2
32.3
92.7 29.5
87.6 217.1
Reuse 4
65.0
2
3
33.7 14.2
3.7 3.9 3.7
can be drawn as for the serial case, namely that the reuse of information from previous time steps results in the largest speedup. The use of three levels decreases the number of coarse model iterations for refinement level 2 from 33.7 to 14.2 in case information from previous time steps is reused. Concluding, the use of three levels to accelerate the convergence of the coarse model is only beneficial if the computational costs of the coarse model are significant compared to the fine model. For this example, the most inaccurate model with negligible computational costs can already be applied to accelerate the convergence of the fine model to 2.4 iterations per time step showing the robustness of the manifold mapping technique.
62
Chapter 4. Conclusions on multi-level acceleration techniques for strongly coupled fluid-structure interaction According to the theory of aerodynamics, as may be readily demonstrated through wind tunnel experiments, the bumblebee is unable to fly. This is because the size, weight, and shape of his body in relation to the total wingspread make flying impossible. But the bumblebee, being ignorant of these scientific truths, goes ahead and flies anyway-and makes a little honey every day. (Anonymous)
4.1. Conclusions A new multi-level coupling algorithm for partitioned simulation of fluidstructure interaction has been proposed based on the manifold mapping algorithm. The main advantage of the manifold mapping algorithm is that it has provable convergence to the solution of the high-fidelity model under mild conditions, contrary to aggressive space mapping which does not always converge to the solution of the high-fidelity model as proven by Echeverria and Hemker [41] and Echeverria et al. [43]. Also, the technique gives complete freedom in the choice of the low-fidelity model. A coarser
63
Chapter 4. Conclusions on multi-level acceleration techniques mesh can be selected for the low-fidelity model, but also an engineering model can be used in combination with a finite volume or finite element approach for the high-fidelity model. Finally, the method is non-intrusive in the sense that only input-output information of the different models is considered. The research question was formulated as follows: can manifold mapping be effectively applied to a partitioned fluid-structure interaction simulation, and does its use result in a significant decrease in the number of high fidelity coupling iterations? Numerical experiments showed the high potential of the coupling scheme, which can reduce the number of fine model evaluations of a partitioned fluid-structure interaction simulation by approximately 50 % by transferring most of the work to the coarse model. The convergence of the high-fidelity model is accelerated even further when information from previous time steps is reused. As mentioned, the manifold mapping algorithm has provable convergence to the solution of the high fidelity model. The use of three levels to accelerate the convergence of the coarse model is only beneficial if the computational costs of the coarse model are significant compared to the fine model. For the examples considered here, the most inaccurate model with negligible computational costs can already be applied to accelerate the convergence of the fine model showing the robustness of the manifold mapping technique. Judging from the numerous examples we considered, it can be expected that for more complex test cases such as the airflow around a wing in transonic conditions with shocks, similar speedups are observed when compared to the IQN-ILS method or Anderson acceleration technique. The most efficient setup is to use a relative residual convergence measure for the surrogate model, and also reuse information from previous time steps to achieve the lowest number of coupling iterations. In case a test case with a steady state solution is considered, information from previous time steps cannot be reused. On the contrary, only information from previous iterations is available. Since the approximation changes rapidly during the first iterations, the approximate Jacobian used by the manifold mapping algorithm is not accurate enough for good convergence rates during those initial iterations. Therefore, it is advised to use the identity matrix as the mapping matrix during the initial iterations (i.e
64
4.2. Recommendations output space mapping), and then enable the use of the mapping matrix Tk .
4.2. Recommendations Two approaches exist to reach the smallest number of coupling iterations per time step. Specifically, (1) the user specifies the number of time steps of which information is reused, or (2) the mapping matrix Tk is stored in memory and a secant update is used to take into account information from all previous time steps. The first approach has the advantage that the memory requirements are on the order of the number of interface points. However, the user needs to fine tune the variable which specifies the number of time steps of which information is reused. The second approach has the advantage that the user does not need to specify this parameter, but it results in large memory requirements. The size of the mapping matrix scales with n-squared, with n being the number of interface points. One possible solution which bypasses both disadvantages is to observe that the mapping matrix has a low rank. Therefore, it can be approximated by a low-rank approximation based on a truncated singular value decomposition. The use of the low-rank approximation results in linear storage requirements for the mapping matrix, and the user does not need to specify the number of time steps of which information is reused. The question remains whether this approach results in a similar number of coupling iterations.
65
Part II.
Arbitrarily high-order time integration for partitioned fluid-structure interaction simulations using spectral deferred corrections
67
Chapter 5. Higher order time integration schemes We must use time wisely and forever realize that the time is always ripe to do right. (Nelson Mandela)
We consider the application of arbitrarily high-order time integration using spectral deferred corrections (SDC), integral deferred corrections (IDC) and the Picard Integral Exponential Solver (PIES). The potential of delivering higher temporal accuracy with lower cost than lower order methods has been the incentive in their consideration. Algorithmic details of the solution procedure for spectral deferred corrections, integral deferred corrections, the Picard Integral Exponential Solver, and finally singly-diagonal implicit Runge-Kutta schemes are presented. Parts of this chapter have been published in • D. S. Blom et al. “On the application of spectral deferred corrections to incompressible flow on unstructured grids”. In: Journal of Computational Physics under review (2016); • D. S. Blom et al. “Arbitrarily high order time integration for partitioned fluidstructure interaction simulations using integral deferred corrections”. In: Journal of Computational Physics under review (2016).
69
Chapter 5. Higher order time integration schemes
5.1. Time integration In this part, we use the method of lines paradigm. In other words, a partial differential equation is first discretized in space and then discretized in time. We study an initial value problem of the form: d u (t) = f (u (t) , t) , dt
u(0) = u0 ,
t ∈ [ 0, T ] ,
(5.1)
with initial solution u0 on the time interval t ∈ [ 0, T ]. As time integration schemes, we study spectral deferred corrections, integral deferred corrections, the Picard Integral Exponential Solver, and diagonally-implicit Runge-Kutta methods.
5.2. Spectral deferred corrections Spectral deferred corrections (SDC) were originally developed for ordinary differential equations (ODE’s) by Dutt et al. [40]. Following the initial introduction of the method, an acceleration procedure has been proposed to accelerate the convergence of the SDC sweeps [62]. Also, the method has been applied to problems of reactive flow [20] and gas dynamics [72], among others. Here, we focus on the original formulation of the method as discussed by Dutt et al. [40]. The application of the acceleration procedure is left as future work. The notation of SDC by Speck et al. [92] is used throughout this thesis. The SDC method starts from a standard initial value problem in integral form: Z t u (t) = u0 + f (u (s) , s) ds, (5.2) 0
where t ∈ [0, T ], u0 represents the initial solution, u (t) ∈ RN , and the function f (u (t) , t) ∈ RN . The time t ∈ [ 0, T ] is subdivided into time steps of size ∆t. Each time step is divided further into M sub-steps based on a set of quadrature nodes. For example, Gauss-Lobatto, Gauss-Radau and Clenshaw-Curtis nodes can be used as quadrature nodes. However, uniform nodes are chosen in case of the integral deferred correction method, discussed in Sect. 5.3. Figure 5.1a shows an example of one time-step with three intermediate
70
5.2. Spectral deferred corrections
Tn
t1
t2
t3
Tn+1
(a) Non-uniform sub-steps
Tn
t1
t2
t3
Tn+1
(b) Uniform sub-steps
Figure 5.1.: Schematic of a time step ∆t with non-uniform and uniform sub-steps.
quadrature nodes. Depending on the used quadrature nodes, the function value at the left end point Tn is included or not included in the integration in time. Where Gauss-Lobatto and Clenshaw-Curtis nodes do include the left-end point, Gauss-Radau nodes do not include the left-end point. Figure 5.1b gives an example of uniform sub-steps, as is the case for integral deferred corrections. The collocation polynomial on [Tn , Tn+1 ] is denoted with up (t). Thus, we make the approximation Uj = up (tj ) ≈ u (tj ). The quadrature weights are defined as follows Z tm 1 qm,j = lj (s) ds, m = 0, . . . , M, j = 0, . . . , M, (5.3) ∆t Tn where Tn = t0 < t1 < · · · < tM = Tn+1 , and (lj )j=0,...,M are the Lagrange polynomials. The time step ∆t is simply ∆t = Tn+1 − Tn . An approximation of the solutions Um , m = 0, . . . , M is obtained with Um = u0 + ∆t
M X
qm,j f (Uj , tj ) ,
m = 0, . . . , M.
(5.4)
j=0
The integration matrix q is defined to be (M + 1 × M + 1) with the matrix entries qm,j . The solution vector U is represented with U = [U0 , . . . , UM ] ,
(5.5)
71
Chapter 5. Higher order time integration schemes and the vector F containing the function evaluations is defined as F (U) = [F0 , . . . , FM ] = [f (U0 , t0 ) , . . . , f (UM , tM )] .
(5.6)
Besides these definitions, the matrix Q is introduced as Q = q ⊗ IN with the identity matrix I and the Kronecker product ⊗. The set of equations as shown in (5.4) can now be written more compactly as: U = U0 + ∆t Q F (U, t) ,
(5.7)
with U0 defined as U0 = U0 ⊗ IN . Equation (5.7) is a fully coupled system consisting of M × N degrees of freedom. We would like to decouple this system and apply an iterative scheme to achieve the same order of accuracy of Eqn. (5.7), but solve a system of N degrees multiple times instead. Thus, we introduce the quadrature weights sm,j , which apply to nodeto-node integration, to decouple the fully coupled system as follows: Z tm 1 lj (s) ds, m = 1, . . . , M. (5.8) sm,j = ∆t tm−1 Hence, integrals over [tm−1 , tm ] are approximated. The integration matrix s consists of the quadrature weights sm,j , and the matrix S is consequently defined as S = s ⊗ IN . The implicit update equation is found as: h � � � �i k+1 k+1 k+1 k k Um+1 = Um +∆tm f Um+1 , tm+1 − f Um+1 , tm+1 +∆t Zm , (5.9) which can be interpreted as a backward Euler step with an extra source term: k+1 k+1 � � � � Um+1 − Um ∆t k k+1 k = f Um+1 , tm+1 − f Um+1 , tm+1 + Z . (5.10) ∆tm ∆tm m � k is defined as Z k = S F Uk , and ∆t = t − t Zm m m m−1 . The residual of m
72
5.2. Spectral deferred corrections the implicit system is simply defined as rkEuler
k+1 k+1 � � � � Um+1 − Um ∆t k k+1 k − f Um+1 , tm+1 + f Um+1 , tm+1 − Z . = ∆tm ∆tm m (5.11)
Solving (5.9) at each quadrature node is named an SDC sweep or SDC iteration. One interesting property of the spectral deferred correction method is that each correction sweep increases the order of accuracy of the method, up to the order of accuracy of Eqn. (5.7). This is under the assumption that the implicit systems are solved sufficiently accurate. Also, the use of a first order integrator is assumed, i.e. backward Euler for implicit time stepping. On convergence of the SDC iterations, the method becomes equivalent to the collocation scheme as determined by the quadrature nodes. Hence, the order of convergence of the scheme depends on the chosen quadrature rule, the number of integration points, and the number of SDC sweeps. Here, the implicit systems with residual (5.11) are solved up to a user specified tolerance τEuler . Instead of using a fixed number of SDC sweeps, the SDC residual is evaluated: � � (5.12) rkSDC = U0 + ∆t Q F Uk − Uk . Convergence of the SDC sweeps is assumed� in case the L2 -norm of the residual scaled by the L2 -norm of ∆t Q F Uk is smaller than the tolerance τSDC : � U0 + ∆t Q F Uk − Uk ≤ τSDC . (5.13) ||∆t Q F (Uk )|| Figure 5.2 gives a schematic example of three sweeps. The solid line represents the exact solution which is approximated by the dots at the time instants t1 , t2 , t3 and Tn+1 . At each iteration, the accuracy of the approximate solution increases with approximately one order.
Emmett and Minion [45] have proposed to solve the sub-steps of the spectral deferred correction method in parallel and use a multi-grid solver in time to perform the least amount of iterations or sweeps on the fine level. The coarse grid performs the SDC sweeps in serial, whereas the fine grid solves each sub-step in parallel. The aim of the technique is to achieve
73
Chapter 5. Higher order time integration schemes
.
Tn
. t1
.
Line: exact solution
.
.
Dots: current approximation
t2
t3
Tn+1
(a) Sweep 1
.
Tn
. . t1
. .
Line: exact solution
New dots: second order approximation
t2
..
t3
. .
Tn+1
(b) Sweep 2
.
Tn
.. . t1
.. .
Line: exact solution
New dots: third order approximation
.. .
t2
t3
.. .
Tn+1
(c) Sweep 3
Figure 5.2.: Schematic of SDC sweeps. The red dots are the current approximations of the solution at the times t1 , t2 , t3 and Tn+1 . The blue line is the exact solution. The accuracy of the approximate solution increases quickly with each iteration.
74
5.3. Integral deferred corrections better parallel scalability of an already existing code, which uses a domain decomposition to solve the spatial discretization in parallel. We introduce the notation SDCxy, where x represents the number of quadrature nodes, and y the theoretical order of convergence. For example, SDC23 is a third order method, where one SDC sweep consists of two substeps.
5.3. Integral deferred corrections Integral deferred corrections are closely related to spectral deferred corrections, namely uniform quadrature nodes are chosen, instead of for example Gauss-Lobatto, Gauss-Radau or Clenshaw-Curtis nodes. Additionally, in [29] it is proven, under mild conditions, that using an rth order RungeKutta integrator to solve the update equation, the order of accuracy of the method increases by r orders at every correction sweep. This is not necessarily the case for the spectral deferred correction method [29]. Equation (5.9) is an example where the first-order implicit Euler integrator is used to solve the update equation. The focus is on quadrature rules that do not depend on the left-hand endpoint, i.e. right-hand quadrature rules. These methods have good stability properties as shown by Hansen and Strain [59] and Layton and Minion [73], and are expected to be good candidates for the simulation of incompressible flows. The notation IDCx is used throughout this thesis, where x represents the number of quadrature nodes which equals the order of accuracy.
5.4. Picard Integral Exponential Solver (PIES) The Picard Integral Exponential Solver is closely related to SDC methods [53, 69]. However, its main difference with the SDC method is the assumption that the solution can be accurately represented by a combination of complex exponential functions. The selection of the exponential functions is based on a matrix skeletonization step and the solution of a linear least squares system. Highly accurate quadrature weights are computed on uniform quadrature nodes and can be determined off-line or once during every simulation. A short description of the method is given here.
75
Chapter 5. Higher order time integration schemes For further details, the reader is referred to Glaser and Rokhlin [53] and Kushnir and Rokhlin [69]. First, the solution of an initial value problem is approximated by the summation of complex valued exponential functions: u (t) ≈
n X
αj eλj t ,
(5.14)
j=1
with the coefficients αj and a-priori chosen complex numbers λj . A set λ1 , . . . , λn is chosen based on a numerical scheme called matrix skeletonization [27] (applied on (5.17)). When λ1 , . . . , λn are known, the integration coefficients ω for the numerical integration are computed based on a least squares approach. These coefficients are comparable to the coefficients qm,j of the spectral deferred correction method. Furthermore, the set λ1 , . . . , λn is selected for which λ lies in the complex semi-disk Sρ Sρ = {λ ∈ C|Re (λ) ≤ 0, |λ| ≤ ρ} , (5.15)
with radius ρ. With Lemma 13 by Glaser and Rokhlin [53], it is concluded that it is sufficient to only discretize the boundary of the semi-disk Sρ . Exponentials of the form eλ t up to precision δ are selected such that n λt X ci eλi t < δ t ∈ [−1, 1] , (5.16) e − i=1
with coefficients ci . Assume that λ1 , . . . , λN and t1 , . . . , tM are sufficiently dense uniform discretization of the semi-disk Sρ , and the time interval [−1, 1]. Then, the subset λ1 , . . . , λn is selected based on the skeleton of the matrix B λ t e 1 1 eλ2 t1 · · · eλN t1 eλ1 t2 eλ2 t2 · · · eλN t2 (5.17) B= . .. .. . . . . . . . eλ1 tM eλ2 tM · · · eλN tM with an error term smaller than δ, which can be computed with a QRdecomposition. This results in n columns with indices i1 , . . . in . The se-
76
5.4. Picard Integral Exponential Solver (PIES)
Imaginary axis
2
0
−2 −6
−4
−2 0 Real axis
2
Figure 5.3.: Example of selection of complex numbers λ1 , . . . , λn on the boundary of the semi-disk with radius 3.15 and δ = 1 · 10−12
� lected complex numbers λ1 , . . . , λn span eλt |λ ∈ δSρ on the boundary of the�semi-disk up to precision δ and are therefore a suitable representation of eλt |λ ∈ Sρ . An example of the selected complex numbers λ1 , . . . , λn is shown in Fig. 5.3. The radius of the semi-circle ρ is set to 3.15 as suggested by Glaser and Rokhlin [53]. The semi-disk is discretized with 800 points, and the selection criterion δ is set to 1 · 10−12 . Another example is given in Fig. 5.4 where the selection criterion δ is set to 1 · 10−5 . As can be seen, a substantially smaller set complex numbers λ1 , . . . , λn is selected. Similarly to spectral deferred correction methods, the numerical integration of one time-step can be evaluated by the quadrature rule Z
tj
−1
u (s) ds ≈
k X
u (ti ) ωij ,
(5.18)
i=1
with the real valued weights ωij ∈ R. Note that the weight matrix ω = 77
Chapter 5. Higher order time integration schemes
Imaginary axis
2
0
−2 −6
−4
−2 0 Real axis
2
Figure 5.4.: Example of selection of complex numbers λ1 , . . . , λn on the boundary of the semi-disk with radius 3.15 and δ = 1 · 10−5
(ωij ) ∈ Rn×k has to satisfy the linear system (5.19)
A ω = b, with the complex valued matrix A ∈ C n×k λt e 1 1 eλ1 t2 · · · eλ1 tk eλ2 t1 eλ2 t2 · · · eλ2 tk A= . , .. .. ... .. . . eλn t1 eλn t2 · · · eλn tk and the complex valued matrix b ∈ C n×k R t R t2 λ s 1 eλ1 s ds −1 e 1 ds −1 R t2 λ s R t1 λ2 s −1 e ds −1 e 2 ds b= .. .. . . R R t2 λ s t1 λn s ds −1 e n ds −1 e 78
R tk λ s · · · −1 e 1 ds R tk λ s · · · −1 e 2 ds . .. .. . . R tk λ s · · · −1 e n ds
(5.20)
(5.21)
5.4. Picard Integral Exponential Solver (PIES) We use a singular value decomposition to solve the linear system (5.19) for the coefficients ωij , which have the same function as the coefficients qm,j of the spectral deferred correction method (see Eqn. (5.3)). The node-to-node integration coefficients ωsij can be computed with a different definition of the matrix bs : R tk λ s R t2 λ s e 1 ds 0 t1 e 1 ds · · · tk−1 R R tk t eλ2 s ds 0 t12 eλ2 s ds · · · tk−1 . (5.22) bs = . .. .. .. . .. . . Rt R tk λ s 0 t12 eλn s ds · · · tk−1 e n ds The rest of the procedure is the same as the spectral deferred correction method. So, the update equation (5.9) is now solved with the newly obtained coefficients ωsij . Kushnir and Rokhlin [69] show that when the left-hand endpoint tn is excluded, an L-stable method is found. Since uniform sub-steps are assumed, the convergence rate of the non-linear solver will not differ significantly from one sub-step to the next, just as the IDC technique. We use the notation PIESx, where x denotes the number of sweeps. This is equal to the expected order of accuracy under the assumption that the systems solved accurately enough. Unless explicitly stated otherwise, δ is set to δ = 1 · 10−13 . Summarizing, the procedure to determine the sub-steps and coefficients with the Picard Integral Exponential Solver is as follows: 1. Create a fine discretization of the boundary of the semi-disk Sρ with radius ρ; 2. Create a fine discretization of the time interval t ∈ [ −1, 1 ]; 3. Compute the matrix B as shown in Eqn. (5.17), copied here for completeness: λ t e 1 1 eλ2 t1 · · · eλN t1 eλ1 t2 eλ2 t2 · · · eλN t2 B= . (5.23) .. .. , .. .. . . . eλ1 tM eλ2 tM · · · eλN tM 79
Chapter 5. Higher order time integration schemes Table 5.1.: Butcher tableau of a SDIRK method
c1 c2 .. .
γ a21 .. .
0 γ .. .
0 0 .. .
0 0
cs
as1
...
ass−1
0 γ
as1
...
ass−1
ass
and perform the skeletonization process up to precision δ to select the subset λ1 , . . . , λn ; 4. Then, solve for the node-to-note coefficients ωs as in Eqn. (5.19) by using the definitions of A and bs in Eqn. (5.20) and (5.22), respectively. Thereafter, the coefficients can be divided by two in order to scale the coefficients to the unit time interval t ∈ [ 0, 1 ]. In Table A.1 the coefficients are given for the node-to-node integration with ρ = 3.15 and δ = 1·10−2 . Coefficients for schemes with smaller values of δ are not shown, due to a large number of coefficients.
5.5. Implicit Runge-Kutta We consider the singly-diagonally-implicit Runge-Kutta (SDIRK) method, which subdivides a time step into s stages. SDIRK schemes are of the form s X ki = f un + ∆t aij kj , tn + ci ∆t , i, . . . , s, (5.24) j=1
un+1 = un + ∆t
s X
bi ki ,
(5.25)
i=1
where the coefficients aij , bi , ci depend on the chosen scheme, and are chosen such that some order conditions are satisfied in order to reach the specified order of accuracy. Also, the coefficients can be found in a Butcher tableau, as shown in Table 5.1.
80
5.5. Implicit Runge-Kutta
.
Tn
. t1
.
t2
. . t3
Tn+1
Figure 5.5.: Schematic of one time step solved with a SDIRK scheme. The red dots are the current approximations of the solution at the times t1 , t2 , t3 and Tn+1 . The blue line is the exact solution. Only the final solution at Tn+1 has a high order of accuracy.
Here, we only consider stiffly-accurate SDIRK schemes, i.e. the last row of the Butcher tableau is identical to bT which is advantageous in solving stiff problems [58]. In other words, the solution at the next time step equals to the last sub-step solution. Just as the integral deferred correction schemes, each sub-step or stage corresponds to solving an implicit Euler time step with an extra source term. However, it is a direct method contrasting the IDC technique. Thus, when all the stages are solved, the solution at the next time step is found. The scheme moves then to the next time step. A schematic of one time step solved with the SDIRK scheme is shown in Fig. 5.5. The explicit-singly-diagonally-implicit Runge-Kutta (ESDIRK) method is closely related the SDIRK method. The a11 entry of the Butcher tableau equals zero for an ESDIRK scheme, resulting in an explicit first stage. This is in contrast to the SDIRK method for which every stage is implicit. Therefore, ESDIRK schemes need the function value f at the start of the time interval. Since the first stage is explicit, the implicit stages can be constructed to be second order accurate instead of first order accurate for the SDIRK scheme. The Butcher tableau’s of the considered time integration schemes can be found in: Ellsiepen [44] (SDIRK2), Cash [25] (SDIRK3, SDIRK4), Kennedy and Carpenter [67] (ESDIRK3, ESDIRK4, ESDIRK5), Rang [84] (SDIRK2PR) and Rang [83] (ESDIRK53PR, ESDIRK63PR, ESDIRK74PR). For convenience and fast look up, the Butcher tableau’s are also included
81
Chapter 5. Higher order time integration schemes in Appendix B and C. This concludes the description of the time integration methods. The finite volume method used to discretize the Navier-Stokes equations is discussed in the following chapter.
82
Chapter 6. Spatial and temporal discretization of the incompressible Navier-Stokes equations The fundamental laws necessary for the mathematical treatment of a large part of physics and the whole of chemistry are thus completely known, and the difficulty lies only in the fact that application of these laws leads to equations that are too complex to be solved. (Paul Dirac)
Where the previous chapter focused on several higher order time integration schemes, here we show the solution procedure of the incompressible Navier-Stokes equations. Details of the numerical method are shown which preserves the theoretical orders of accuracy in time, including the appropriate treatment of the velocity flux (time-consistent Rhie-Chow interpolation), and use of an iterative time advancing algorithm (iterated PISO) to minimize the influence of iterative errors on temporal order. Parts of this chapter have been published in D. S. Blom et al. “Arbitrarily high order time integration for partitioned fluid-structure interaction simulations using integral deferred corrections”. In: Journal of Computational Physics under review (2016).
83
Chapter 6. Discretization of the incompressible Navier-Stokes equations
6.1. Introduction We consider the incompressible Navier-Stokes equations, which consist of the momentum and continuity equations: u˙ + ∇u · u − ν∆u + ∇p = 0,
(6.1)
∇ · u = 0.
(6.2)
u and p denote the velocity and pressure, and ν represents the kinematic viscosity. We use the iterated PISO algorithm [63] to solve the NavierStokes equations with a finite volume method on unstructured grids. Also, the momentum interpolation of Lien and Leschziner [74] (later also published in Yu et al. [100]) is used in order to obtain a temporally consistent formulation. First, the solution procedure for static meshes is discussed. After that, the changes necessary for simulations on deforming meshes are shown.
6.2. Static grids By applying the finite volume method, the momentum equation per control volume is: Z I Z Z d u dV + n · u u dS − ∇ · (ν∇u) dV = − ∇p dV. (6.3) d t VC SC VC VC We introduce a control volume VC , cell surface area SC , and n as the normal vector to the cell surface. The discrete form of the continuity equation is written as X uf · nf Sf = 0, (6.4) f
where we introduce the velocity uf which is defined on the face centers, and can be used to compute the mass flux through the face with φf = uf ·nf Sf . The subscript f defines a variable which is defined on the face center. The discrete form of the momentum equation is given as V
X X du X + φu + ν (∇u)f · nf Sf = − (p)f nf Sf . dt f
84
f
f
(6.5)
6.3. Face-velocity interpolation After dividing by the volume V , and choosing appropriate schemes for the spatial operators, Eqn. (6.5) can be written as du + a u + B u = q − ∇p, dt
(6.6)
with the diagonal a and off diagonal B coefficients of the discretization matrix. q consists of the remaining source terms. The H operator is defined in the following way: H (u) = q − B u.
(6.7)
Note that the volume V can only be assumed to be constant for static grids, therefore Eqn. (6.6) is not valid for moving grids. To obtain a method which is consistent in time, the H operator needs to contain contributions only from the spatial discretization. Hence, the momentum equation can be simplified to du + a u = H (u) − ∇p. dt
(6.8)
By applying implicit Euler time integration we find � un+1 − un + a un+1 = H un+1 − ∇pn+1 . ∆t Hence, the residual vector F is defined as follows: � F = −a un+1 + H un+1 − ∇pn+1 .
(6.9)
(6.10)
Finally, we arrive at the following initial value problem which can be integrated in time using one of the chosen time integration schemes: du = F (u, p, t) . dt
(6.11)
6.3. Face-velocity interpolation To avoid pressure-velocity decoupling, we follow the solution algorithm of Rhie and Chow [85]. Thus, a fully discretized momentum equation for the
85
Chapter 6. Discretization of the incompressible Navier-Stokes equations face velocities is applied. The method of Rhie and Chow [85] does not result in a consistent time integration. Thus the momentum interpolation of Lien and Leschziner [74] is used to obtain a temporally consistent formulation. Equivalent to the cell centered formulation of the momentum equation (see Eqn. 6.8), we can write the momentum equation for the face centers as follows: d uf + a uf = Hf − (∇p)f , (6.12) dt with (∇p)f as the face pressure gradient normal to the surface. The notation H and a indicates a linear interpolation from the cell centers to the cell face of the H and a operators. After discretization in time with the implicit Euler method we find − unf un+1 f ∆t
= Hf − ∇pn+1 + a un+1 f
� f
.
(6.13)
Equation (6.13) is slightly rewritten to find the face velocity un+1 = f
� � � 1 ∆t Hf − ∆t ∇pn+1 f + unf . 1 + ∆t a
After recalling the continuity equation X X ∇·u= uf · nf Sf = φf = 0, f
(6.14)
(6.15)
f
Equation (6.14) is substituted into the continuity equation, which yields the Laplace equation for the pressure: � ! ! X ∆t ∇pn+1 f X ∆t Hf + unf · nf S f = · nf Sf . (6.16) 1 + ∆t a 1 + ∆t a f
f
6.4. Solution algorithm Since a segregated solution procedure is used to find the velocity and pressure, and the nonlinear convection term is treated implicitly, an iterative solution procedure is applied. Thus, for each sub-step of the integral deferred correction scheme, or for each stage of the SDIRK method, a
86
6.4. Solution algorithm backward Euler step with extra source term qt is solved in the following manner. 1. Solve the discretized momentum equation for the velocity vector un+1 r+1 with outer iteration counter r: n � un+1 r+1 − u n+1 + a un+1 r+1 = H ur+1 − ∇pr + qt . ∆t
(6.17)
The pressure of the previous time step is used as initial guess for ∇pr . 2. Calculate the intermediate mass flux with � n + ∆t q ∆t H un+1 + u t f r+1 f f · nf Sf . φ?f = 1 + ∆t a
(6.18)
Note the linear interpolation from the cell centers to the cell faces for Hf and a, as indicated by the overline notation . The term qt f is the higher order source term of the time derivative of the face velocity. 3. Solve for the pressure at the next iteration r + 1 with � ! X ∆t ∇pn+1 X r+1 f · nf Sf = φ?f . 1 + ∆t a f
(6.19)
f
4. Correct the flux and velocities defined in the cell centers and face centers as follows: � � n+1 n ∆t H un+1 r+1 − ∆t ∇pr+1 + u + ∆t qt n+1 , ur+1 = 1 + ∆t a � � (6.20) ∆t H un+1 − ∆t ∇pn+1 + unf + ∆t qt f r+1 r+1 f f n+1 ur+1f = , 1 + ∆t a φf = uf · nf Sf . 87
Chapter 6. Discretization of the incompressible Navier-Stokes equations We use the non-linear residual defined on the cell centers to monitor the convergence of the outer iterations: R=
n � un+1 r+1 − u n+1 + a un+1 r+1 − H ur+1 + ∇pr+1 − qt . ∆t
(6.21)
When the norm of the non-linear residual falls below a certain threshold, the procedure moves to the next sub step or time step. Otherwise, the algorithm restarts at step 1 with updated velocity and pressure solutions.
6.5. Moving grids For deforming domains, the Arbitrary Lagrangian Eulerian (ALE) framework is applied onto the incompressible Navier-Stokes equations. Thus, the discretized momentum equation reads as follows: X X X duV + (φ − φmesh ) u + ν (∇u)f · nf Sf = − pf nf Sf , (6.22) dt f
f
f
with the mesh velocity flux φmesh , and the inclusion of the volumes in the time derivative. After discretizing in space, and applying the implicit Euler time integration scheme, the following form of the momentum equation is found: X � un+1 V n+1 − un V n Sfn+1 . + a un+1 V n+1 = H un+1 V n+1 − pf nn+1 f ∆t f
(6.23) Note that the equation is not divided by the volume V , due to the fact that the volumes are not constant during the simulation. The residual vector F follows as: X � F = −a un+1 V n+1 + H un+1 V n+1 − pf nn+1 Sfn+1 . (6.24) f f
Hence, the following initial value problem is found: duV = F (u, p, t, V ) . dt
88
(6.25)
6.5. Moving grids The momentum equation for the face center velocity uf also includes the contributions of the changing volumes: un+1 V n+1 − unf V n f ∆t
+a un+1 V n+1 = Hf V n+1 − f
X
pf nn+1 Sfn+1 . (6.26) f
f
After solving for the face center velocity uf we find: un+1 f
1 = 1 + ∆t a
�
n+1
∆t Hf − ∆t ∇p
� f
+
unf
Vn V n+1
� ,
(6.27)
which is sufficient to implement a time consistent solver for the incompressible Navier-Stokes on moving meshes. For completeness, the solution algorithm is laid out here including higher order source terms qt and qt f . These source terms have the unit m4 /s2 , as it is an acceleration term multiplied by a volume term. 1. Solve the discretized momentum equation for the velocity vector un+1 r+1 at iteration r + 1: n+1 − un n+1 un+1 r+1 V r+1 V + a un+1 V n+1 ∆t � n+1 X Sfn+1 + qt . = H un+1 − pr nn+1 r+1 V f f
(6.28) As mentioned before, of the previous time step is used P the pressure n+1 n+1 as initial guess for f pr nf Sf , i.e. pn+1 = pn . 0 2. Calculate the intermediate mass flux φ?f by taking the change in volume into account: � n V n + ∆t qt f ∆t H un+1 + u r+1 f f V n+1 V n+1 φ?f = · nn+1 Sfn+1 . (6.29) f 1 + ∆t a Linear interpolation of the volumes from the cell centers to the face centers is necessary to take the change in volume into account. Note
89
Chapter 6. Discretization of the incompressible Navier-Stokes equations that the volumes are first interpolated to the faces, and thereafter n n � divided: Vn+1 instead of VVn+1 . V
3. Solve for the pressure with � X � ∆t X n+1 n+1 · nn+1 S = φ?f . (∇pr+1 ) f f 1 + ∆t a f
(6.30)
f
4. Correct the flux and velocities defined in the cell centers and face centers as follows: � � ∆t qt n+1 n Vn ∆t H un+1 r+1 − ∆t ∇pr+1 + u V n+1 + V n+1 n+1 ur+1 = , 1 + ∆t a � � ∆t qt f n+1 n Vn (6.31) ∆t H un+1 r+1 f − ∆t ∇pr+1 f + uf V n+1 + V n+1 n+1 ur+1f = , 1 + ∆t a φf = uf · nf Sf . Similar to the static grid case, we use the nonlinear residual as defined on the cell centers to monitor the convergence of the outer iterations: un+1 V n+1 − unr+1 V n+1 R = r+1 + a un+1 V n+1 ∆t � n+1 X Sfn+1 − qt . − H un+1 + pr+1 nn+1 r+1 V f
(6.32)
f
When the norm of the non-linear residual falls below a certain threshold, the procedure moves to the next sub step or time step. Otherwise, the algorithm performs step 1 through 4 again with updated velocity and pressure solutions.
6.6. Higher order time integration So far, we only considered the implicit Euler scheme (or only included the source term qt in the formulation), which is first order accurate. To obtain a higher order approximation in time, we apply spectral deferred corrections, the integral deferred correction scheme, the Picard Integral
90
6.7. Discrete Geometric Conservation Law Exponential Solver, and the diagonally implicit Runge-Kutta method. The time derivative occurs in the cell centered momentum equation, i.e. face centered momentum equation, and in the Laplace equation for the pressure. When the spectral or integral deferred correction scheme is applied to the cell centered momentum equation, we find the following equation: k+1 k+1 k+1 � � uk+1 m+1 Vm+1 − um Vm k+1 k+1 = F uk+1 , p , V , t m+1 m+1 m+1 m+1 ∆t � � ∆t k k k Z . − F Um+1 , pkm+1 , Vm+1 , tm+1 + ∆tm m (6.33)
The residual vector F is defined as in Eqn. (6.24). The equations for the face centered velocity, and the Laplace equation for the pressure follow in a similar fashion. The solution procedure for the Navier-Stokes equations used in this thesis only results in an explicit function operator for the cell centered terms, but not for the face value terms. Also, the function value F cannot be evaluated straightforward at the left end point (start of the time interval) for the Discrete Geometric Conservation Law (see Sect. 6.7). Therefore, the left end point is not included in the quadrature nodes to not further complicate the implementation of the complete method. Thus, at the end of each implicit solve, the function F is determined by rewriting the update Equation (6.33) instead of performing a separate function call: � uk+1 V k+1 − uk+1 V k+1 � m m m+1 m+1 k+1 k+1 , t , V , p F uk+1 m+1 m+1 m+1 m+1 = ∆t � � ∆t k k k Z . + F Um+1 , pkm+1 , Vm+1 , tm+1 − ∆tm m (6.34)
6.7. Discrete Geometric Conservation Law The mesh fluxes φm are determined with the Discrete Geometric Conservation Law (DGCL), and are consequently based on the swept volumes. Violation of the DGCL results in spurious oscillations due to additional
91
Chapter 6. Discretization of the incompressible Navier-Stokes equations sources and sinks of mass [39]. The DGCL states that the change in volume of a moving control volume must be equal to the sum of the total volume swept by the faces that enclose the volume. When applying the backward Euler (BE) method, we find the mesh fluxes φmesh as follows: φmesh, BE =
∆Vfn+1 ∆t
,
(6.35)
with the swept volumes of a face ∆Vf . When applying the integral deferred correction scheme, we find: � � � � ∆t k k φmesh, IDC = f∆V ∆V k+1 , t − f ∆V , t Z , ∆V m+1 m+1 + m+1 m+1 ∆tm m (6.36) with the function f∆V defined as f∆V =
∆Vf . ∆t
(6.37)
6.8. Boundary conditions at the fluid-structure interface At the fluid-structure interface Γf s , the balance of stresses (i.e. dynamic boundary condition) is enforced through σf n = σsn
on Γf s ,
(6.38)
with the unit vector n normal to the fluid-structure interface Γf s , and the stress tensors σ f and σ s . Also, at the fluid-structure interface the velocities v f and v s must be equal (i.e. kinematic boundary condition): vf = vs
on Γf s .
(6.39)
6.9. Integral deferred corrections applied to fluid-structure interaction simulations We consider the partitioned fluid-structure interaction setup because highly specialized solvers have already been developed for fluid as well as structure
92
6.9. IDC applied to fluid-structure interaction simulations simulations. It is desired to reuse these applications for fluid-structure interaction computations where separate fluid and structure solvers need to be coupled. We shortly discuss the used coupling method and convergence measures which should be used when using an integral deferred correction method.
6.9.1. Anderson acceleration combined with higher order time integration Chapter 2 discusses the Anderson acceleration method, which is used in this part as well to accelerate the convergence of the sub-iterations within one sub-step. Note that special care has to be taken when combining the Anderson acceleration method with a high-order time integration method. With uniform sub-steps, information from previous sub-steps and previous time steps can easily be reused to speed up the convergence of the coupling iterations in the current sub-step. However, in the case of spectral deferred corrections or the SDIRK method, non-uniform sub-steps are applied. In this case, it is necessary to scale the values of the interface Jacobian by the used sub-step. Otherwise, the change in sub-step size will be incorporated in the approximation of the interface Jacobian possibly increasing the number of coupling iterations instead of accelerating the method.
6.9.2. Convergence measures for partitioned fluid-structure interaction As mentioned in Chap. 2, a standard way to measure the convergence of the coupling iterations is to use a relative convergence criterion based on input and output information with a tolerance τ : ||R (x)||2 ≤ τf , ||x||2 + ε
(6.40)
√ with ε = 2−52 = 2−26 when computing with double precision floats, and the fluid-structure interface residual R. This is the preferred way to measure convergence for the SDIRK time integration scheme or backward differencing. However, in case of the integral deferred correction method,
93
Chapter 6. Discretization of the incompressible Navier-Stokes equations each sweep increases the accuracy of the solution, and it is not necessary to solve the FSI problem up to a strict tolerance τ . Following the ideas of Speck et al. [93], the norm of the residual is scaled by the norm of the first residual of each sub step and each correction sweep: ||R (x)||2 ≤ τ. ||R0 ||2 + ε
(6.41)
Now, at each sweep the norm of R0 decreases, and convergence is assumed in case the SDC residual is small enough. Thus, it is sufficient to set the tolerance τ to 10−1 or 10−2 . This approach can be combined with an absolute convergence criterion for the interface residual to avoid oversolving. Concluding, the convergence of each sub-step is assumed when the absolute convergence criteria are met, or in case (6.41) is satisfied.
94
Chapter 7. Numerical results for incompressible flows I write by hand, making many, many corrections. I would say I cross out more than I write. I have to hunt for words when I speak, and I have the same difficulty when writing. (Italo Calvino)
In this chapter, we consider the application of arbitrarily high-order time integration using spectral deferred corrections (SDC), integral deferred corrections (IDC) and the Picard Integral Exponential Solver (PIES) to cell-centered collocated finite volume discretization of the unsteady incompressible Navier-Stokes equations. By considering some test cases, the theoretical order of convergence is confirmed for both the velocity and pressure. Furthermore, the accuracy and computational efficiency of SDC, IDC, and PIES compared to diagonally implicit Runge-Kutta methods and second order backward differencing scheme are investigated. The numerical results demonstrate a clear advantage over second order backward differencing regarding efficiency for a given temporal accuracy. For moderate accuracies, diagonally implicit Runge-Kutta methods prove to be competitive to SDC, IDC, and PIES. For high accuracies, it is certainly beneficiary to increase the order to five or higher. The next chapter investigates several numerical examples when the higher Parts of this chapter have been published in D. S. Blom et al. “On the application of spectral deferred corrections to incompressible flow on unstructured grids”. In: Journal of Computational Physics under review (2016).
95
Chapter 7. Numerical results for incompressible flows order schemes are applied to incompressible flows on moving meshes and partitioned fluid-structure interaction simulations.
7.1. Travelling waves First, the well-known two-dimensional traveling waves test case is considered. An exact analytical solution of the incompressible Navier-Stokes equations exists [80]. The analytical solution is used as the initial solution of the simulations: u (x, y, t) = 0.75 + 0.25 cos (2π (x − t)) sin (2π (y − t)) e−8π
2 t/Re
,
(7.1)
v (x, y, t) = 0.75 − 0.25 sin (2π (x − t)) cos (2π (y − t)) e , 1 2 p (x, y, t) = − (cos (4π (x − t)) − cos (4π (y − t))) e−16π t/Re . 64
(7.2)
−8π 2 t/Re
(7.3)
Periodic boundary conditions are used for the velocity as well as the pressure. The Reynolds number is set to Re = 10. The size of the square domain is two meter in both directions, with x in [-1,1] and y in [-0.5,1.5]. A uniform grid with size 50 × 50 is used. The simulations are carried out until t = 0.05 s. The convection and diffusion terms of the Navier-Stokes equations are discretized with second order central schemes. Figure 7.1 shows the pressure and velocity contours at t = 0 s and at t = 0.05 s. To minimize the computational costs of the simulations, the nonlinear systems are solved based on the convergence criterion: rnon-linear < τEuler , rnon-linear,initial
(7.4)
with τEuler = 1.0·10−2 , and the initial momentum residual rnon-linear,initial evaluated at the start of each non-linear solve. The tolerance τSDC is set to 1.0 · 10−13 . The reference solution is obtained with the SDC611 scheme with ∆t = 0.00125 s. The relative error is defined as the L2 norm of the difference between the approximation and reference solution scaled by the L2 norm of the reference solution. Figure 7.2 shows the convergence study for both the velocity and pressure field when using the spectral deferred correction method. Note that both the velocity and the pressure show the expected convergence order
96
7.1. Travelling waves
1.5
1.20
1.0
1.14
0.5
1.08 1.02
0.0 0.5
0.96 1.0
0.5
0.0
0.5
1.0
0.90
1.0
1.14
0.5
1.08
0.5
1.02 0.96 1.0
0.5
0.0
0.5
1.0
(c) Final velocity contours
0.01
0.5
0.00 0.01
0.0 0.5
0.02 1.0
0.5
0.0
0.5
1.0
0.03
(b) Initial pressure contours
1.20
0.0
0.02
1.0
(a) Initial velocity contours
1.5
0.03
1.5
0.90
0.03
1.5
0.02
1.0
0.01
0.5
0.00 0.01
0.0 0.5
0.02 1.0
0.5
0.0
0.5
1.0
0.03
(d) Final pressure contours
Figure 7.1.: Travelling waves test case: pressure and velocity contours of the initial and final solution.
97
Chapter 7. Numerical results for incompressible flows
SDC11 SDC23
SDC35 SDC47
SDC59 SDC611
SDC11 SDC23
SDC59 SDC611
10−1
−3
10
1
10−5 −7
1
10
−9
10
1
10−11 10−13 10−15
1 3 5
Relative error [-]
Relative error [-]
10−1
SDC35 SDC47
10−3
1
10−5
1
−7
10
1
−9
10
1 3 5
10−11 10−13 10−15
−2
10−2
Time step [s]
Time step [s]
10
(a) Velocity error for SDC schemes
(b) Pressure error for SDC schemes
Figure 7.2.: Travelling waves test case: time step study for the SDC scheme. The temporal L2 error norm of the velocity and pressure fields are shown.
when decreasing the time step. Below an error of 10−12 , the numerical round-off error starts dominating the temporal error. Due to the high order of accuracy of the SDC scheme, machine precision is quickly reached for the SDC47, SDC59, and SDC611 methods. Figure 7.3 shows the results of the time step studies for the IDC, PIES, SDIRK, ESDIRK and BDF methods. The results for the mentioned schemes show the expected order behavior. For the ESDIRK schemes, the ESDIRK5 reaches the highest level of accuracy. Figure 7.3b and 7.3c show the convergence plots when the PIES method is used with δ = 1 · 10−13 and δ = 1 · 10−5 , respectively. When the selection criterion is set to δ = 1 · 10−5 , the accuracy of the interpolation with the exponential functions is decreased. This can also be observed in the plots, as the convergence plots level off quicker compared to Fig. 7.3b.
98
7.1. Travelling waves
IDC1 IDC2
IDC3 IDC4
IDC5 IDC6
PIES1 PIES2
10
−5
10
−7
10
10−9 10−11 10−13 −15
10
1 1 1 1 1
1 2 3 4 5
6
1
10−3 10−5
1
−7
10
1
−9
10
1
10−11
2 3
10−13
10−2
10−2
Time step [s]
Time step [s]
PIES1 PIES2
1
10−15
(b) Velocity error PIES schemes, δ = 1·10−13
(a) Velocity error IDC schemes
PIES3 PIES4
BDF2 SDIRK3 ESDIRK3 ESDIRK5 ESDIRK74PR
PIES5 PIES6
10−1
10−3 10−5
1
10−7
1
−9
1
10
10−11 −13
10
1 2 3
Relative error [-]
10−1
Relative error [-]
PIES5 PIES6
10−1
−3
Relative error [-]
Relative error [-]
10−1
PIES3 PIES4
10−3 10−7 10−9 10−11 10−13 10
10
2
10−5
−15
−15
1
SDIRK2 SDIRK4 ESDIRK4 ESDIRK53PR
1 1 1
3 4 5
10−2
10−2
Time step [s]
Time step [s]
(c) Velocity error PIES schemes, δ = 1 · 10−5 (d) Velocity error SDIRK, ESDIRK and BDF schemes
Figure 7.3.: Travelling waves test case: time step study for IDC, PIES, SDIRK, ESDIRK and BDF schemes. The temporal L2 error norm of the velocity field is shown.
99
Chapter 7. Numerical results for incompressible flows
7.2. Lid-driven cavity flow The lid-driven cavity flow has been used by other researchers to study different time integration schemes [8, 66]. A two-dimensional flow is considered with Reynolds number Re = 10. The computational domain consists of a unit square with solid boundaries. At the top, a Dirichlet boundary condition is applied to the velocity in the x-direction with the value 1 m/s. A uniform mesh of size 50×50 is used. A zero gradient boundary condition is used for the pressure, and the no-slip boundary condition is applied on the solid walls for the velocity. Second order centered schemes are used for the spatial discretization. For the time step study, the initial transient of the simulation is considered. The flow is initially at rest, and the simulations are carried out until t = 0.05 s. The reference solution is obtained with the SDC815 scheme with ∆t = 0.000625 s. Figure 7.4 shows the temporal error of the velocity field against time step size for the SDC, IDC, SDIRK, ESDIRK and BDF schemes. The orders of accuracy for the different methods are confirmed. Again, due to the high order of accuracy of the SDC method with Gauss-Radau nodes, machine precision is quickly reached for the SDC611 method. For the PIES method, an accuracy of 10−12 is reached due to the tolerance settings for computing the coefficients. The error constant of the PIES method is significantly smaller compared to the other time integration methods, due to the relatively large number of sub-steps with δ = 1.0 · 10−13 , namely 27. When the selection criterion is set to δ = 1.0 · 10−5 , as shown in Fig. 7.5, the convergence plots level off at an accuracy of 10−10 . Figure 7.6 shows temporal error versus computational time for the same computations. As the order for the SDC method increases, the efficiency of the method increases substantially until machine precision is reached. This effect is not that large for the IDC method since the order of the method increases only by one when a sub-step is added. Hence, the SDC schemes outperform the IDC methods due to a higher order of convergence for the same number of quadrature nodes. The PIES methods become more efficient with an increasing number of sweeps and show a relatively large increase in costs when decreasing the time step compared to the other methods. This is again explained by
100
7.2. Lid-driven cavity flow
SDC11 SDC23
SDC35 SDC47
SDC59 SDC611
IDC1 IDC2
10
1
10−5 10−7
1
10−9 10−11
1
−13
10
1 3 5
−15
10−3
1
10−5
1
2 1 3 1 4 1 5 6 1 1
10−7 10−9 10−11 10−13 10−15
10
−3
−2
10
10−3
10
Time step [s]
PIES1 PIES2
PIES3 PIES4
(b) Velocity error IDC schemes BDF2 SDIRK3 ESDIRK3 ESDIRK5 ESDIRK74PR
PIES5 PIES6 10−1
10−3
10−3
1
−7
10
10−9
1
10−11
1
Relative error [-]
10−1 10−5
1 2 3
10−7 10−9 10−11 10−13
10−15
10−15
10−2
SDIRK2 SDIRK4 ESDIRK4 ESDIRK53PR
10−5
10
−13
10−3
10−2
Time step [s]
(a) Velocity error for SDC schemes
Relative error [-]
IDC5 IDC6
10−1
−3
Relative error [-]
Relative error [-]
10−1
IDC3 IDC4
10−3
10−2
Time step [s]
Time step [s] −13
(c) Velocity error PIES schemes, δ = 1·10
(d) Velocity error SDIRK, ESDIRK and BDF schemes
Figure 7.4.: Lid-driven cavity flow: time step study for SDC, IDC, PIES, SDIRK, ESDIRK and BDF schemes. The temporal L2 error norm of the velocity field is shown.
101
Chapter 7. Numerical results for incompressible flows PIES1 PIES2
PIES3 PIES4
PIES5 PIES6
Relative error [-]
10−1 10−3 10−5 −7
10
−9
10
10−11
1 1 1
1 2 3
−13
10
10−15 10−3
10−2
Time step [s]
Figure 7.5.: Lid-driven cavity flow: time step study for the PIES scheme with δ = 1 · 10−5 . The temporal L2 error norm of the velocity field is shown.
the large number of sub-steps selected. Note that the coefficients of the method are computed off-line, and the corresponding computational times are therefore not included in this plot. Judging from Fig. 7.7 (δ = 1 · 10−5 and δ = 1 · 10−13 ), the same observations can be made. Note though that due to the smaller number of sub-steps, the computational costs are not decreased but approximately at the same level as for the simulations with δ = 1 · 10−13 . The only difference between the two sets of simulations is a difference in the number of sub-steps. The order of convergence is the same, thus selecting more sub-steps only results in a smaller error constant. The difference in computational cost for the BDF and ESDIRK methods are relatively small compared to the SDC, IDC and PIES methods due to the lower orders of accuracy, i.e. 1 to 5. It can be concluded that increasing the order is beneficial and enhances both efficiency and accuracy. Note that the fourth order ESDIRK74PR method is competitive to the ESDIRK5 method. Figure 7.8 summarizes the results of Fig. 7.6 by using a linear fit through the best data points, thus only differentiating between SDC, IDC, PIES, BDF, SDIRK and ESDIRK methods. The result of the largest time step of the PIES simulations is used in Fig. 7.8. The SDIRK and ESDIRK
102
7.2. Lid-driven cavity flow
SDC35 SDC47
SDC59 SDC611
IDC1 IDC2
10−1
10−1
10−3
10−3
10
−5
10
−7
Relative error [-]
Relative error [-]
SDC11 SDC23
10−9 10
−11
10
−13
10−15 10
10−7 10−9 10−11 10−13 10−15
0
1
10
10
2
3
100
10
PIES3 PIES4
BDF2 SDIRK3 ESDIRK3 ESDIRK5 ESDIRK74PR
PIES5 PIES6
10−1
10−1
10−3
10−3
10
−7
10−9 10
−11
10
−13
10−15 10
102
103
(b) Velocity error IDC schemes
Relative error [-]
Relative error [-]
PIES1 PIES2
101
Computational costs [s]
(a) Velocity error for SDC schemes
10
IDC5 IDC6
10−5
Computational costs [s]
−5
IDC3 IDC4
SDIRK2 SDIRK4 ESDIRK4 ESDIRK53PR
10−5 10−7 10−9 10−11 10−13 10−15
0
1
10
10
2
Computational costs [s]
(c) Velocity error PIES schemes
3
10
100
101
102
103
Computational costs [s]
(d) Velocity error SDIRK, ESDIRK and BDF schemes
Figure 7.6.: Lid-driven cavity flow: comparison of computational efficiency versus temporal error in velocity for the SDC, IDC, PIES, SDIRK, ESDIRK and BDF schemes.
103
Chapter 7. Numerical results for incompressible flows
PIES1, PIES2, PIES3, PIES4, PIES5, PIES6,
δ δ δ δ δ δ
= 10−5 = 10−5 = 10−5 = 10−5 = 10−5 = 10−5
PIES1, PIES2, PIES3, PIES4, PIES5, PIES6,
101
102
δ δ δ δ δ δ
= 10−13 = 10−13 = 10−13 = 10−13 = 10−13 = 10−13
Relative error [-]
10−1 10−3 10−5 10−7 10−9 10−11 10−13 10−15 100
103
Computational costs [s]
Figure 7.7.: Lid-driven cavity flow: comparison of computational efficiency versus temporal error in velocity for the PIES scheme with δ = 1 · 10−5 and δ = 1 · 10−13 .
104
7.3. Lid-driven cavity flow with time dependent boundary conditions
Relative error [-]
SDC ESDIRK
IDC BDF2
SDIRK PIES
10−1 10−2 10−3 10−4 10−5 10−6 10−7 10−8 10−9 10−10 10−11 10−12 10−13 10−14 101
102
Computational costs [s] Figure 7.8.: Lid-driven cavity flow: smoothed computational costs versus error for SDC, IDC and ESDIRK.
schemes are computationally more efficient than the SDC, IDC and PIES methods for the accuracy range shown. The PIES method is competitive to SDC and becomes more efficient when the number of sweeps is increased. Note that in contrast to the other time integration schemes, the ESDIRK methods need the function values f at the left end point of the time domain. Comparing the results of PIES and SDC with SDIRK, it is expected that they will outperform the SDIRK scheme for high accuracies.
7.3. Lid-driven cavity flow with time dependent boundary conditions The third case consists again of a lid-driven cavity flow. Now an oscillating boundary condition is applied on the top wall [66] to study the behavior for the different time integration schemes with a time dependent boundary condition. Hence, a non-autonomous system is considered, with the initial
105
Chapter 7. Numerical results for incompressible flows value problem defined as d u (t) = f (u (t) , t) , dt
u(0) = u0 ,
t ∈ [ 0, T ] ,
(7.5)
in contrast to an autonomous system, for which the function does not depend on time: d u (t) = f (u (t)) , dt
u(0) = u0 ,
t ∈ [ 0, T ] .
(7.6)
A sinusoidal forcing is imposed on the top wall: ux = sin (ω t) , (7.7) � � u with the velocity u = x , the frequency of the oscillations ω, and the uy time t. The Reynolds number is set to Re = 400, and the frequency of oscillations to ω = 0.5 π. A uniform grid is used with 1292 cells. After the initial transient, the flow reaches a periodic state of which one period is simulated with the different time integration schemes. Figure 7.9, 7.10, 7.11 and 7.12 show the results of the performed simulations. The expected order of accuracy of the spectral deferred correction, integral deferred correction schemes, and PIES is confirmed for this test case when a time dependent boundary condition is imposed. However, the SDIRK4 and ESDIRK5 methods reduce to third order accuracy. The ESDIRK74PR results in the lowest temporal error compared to the other (E)SDIRK methods. The efficiency of the SDC, IDC, PIES and ESDIRK methods is shown in Fig. 7.13 where the results are summarized with a linear fit through the best data points of Fig. 7.11. The (E)SDIRK schemes prove to be competitive to SDC and IDC for the accuracy range shown. IDC and SDC exhibit very similar computational cost for a given accuracy. The PIES method shows similar computation times to SDC for accuracies between 10−4 –10−8 .
106
7.3. Lid-driven cavity flow with time dependent boundary conditions
100 10−1 10−2 10−3 10−4 10−5 10−6 10−7 10−8 10−9 10−10 10−11 10−12 10−13
1 1 1
SDC35 SDC47
SDC59 SDC611
IDC1 IDC2
1
Relative error [-]
Relative error [-]
SDC11 SDC23
3 5
10−1
100 10−1 10−2 10−3 10−4 10−5 10−6 10−7 10−8 10−9 10−10 10−11 10−12 10−13
Time step [s]
1 1 1
1 2 3
10−1
Time step [s]
1 1 1
1 2 3 4 5 1
6
10−1
(b) Velocity error for IDC schemes BDF2 SDIRK3 ESDIRK3 ESDIRK5 ESDIRK74PR
PIES5 PIES6
Relative error [-]
Relative error [-]
100 10−1 10−2 10−3 10−4 10−5 10−6 10−7 10−8 10−9 10−10 10−11 10−12 10−13
PIES3 PIES4
1
IDC5 IDC6
Time step [s]
(a) Velocity error for SDC schemes
PIES1 PIES2
1
IDC3 IDC4
100 10−1 10−2 10−3 10−4 10−5 10−6 10−7 10−8 10−9 10−10 10−11 10−12 10−13
SDIRK2 SDIRK4 ESDIRK4 ESDIRK53PR
10−1
Time step [s]
(c) Velocity error for PIES schemes, δ = 1 ·(d) Velocity error for SDIRK, ESDIRK and 10−13 BDF schemes
Figure 7.9.: Lid-driven cavity flow with time dependent boundary condition: time step convergence study. The temporal L2 error norm of the velocity field is shown.
107
Chapter 7. Numerical results for incompressible flows
Relative error [-]
PIES1 PIES2 100 10−1 10−2 10−3 10−4 10−5 10−6 10−7 10−8 10−9 10−10 10−11 10−12 10−13
1 1 1
PIES3 PIES4
PIES5 PIES6
1 2 3
10−1
Time step [s]
Figure 7.10.: Lid-driven cavity flow with time dependent boundary condition: time step convergence study for PIES with δ = 1 · 10−5 . The temporal L2 error norm of the velocity field is shown.
7.4. Flow around a cylinder Finally, a more complex benchmark problem of the flow around a cylinder is considered [64, 89]. John [64] has also studied this test case with different time integration schemes, namely the second order Crank-Nicolson scheme and the fractional-step θ-scheme. The influence of the time integration scheme on the lift coefficient is considered here. The length of the domain is 2.2 m, and the height H is 0.41 m. The diameter of the cylinder is 0.1 m, with the center of the cylinder located at (0.2, 0.2), where the origin of the domain is located at the bottom left corner. A schematic of the test case is shown in Fig. 7.14. A time-dependent inflow profile � � 6y πt ux (y, t) = 2 (H − y) sin 0≤y≤H (7.8) H 8 is prescribed for 0 ≤ t ≤ 8 s. The mean inflow velocity equals ux (t) = � sin π8t m/s. Therefore, the maximum inlet velocity is umax = 1 m/s. For the velocity, zero gradient boundary conditions are applied at the
108
7.4. Flow around a cylinder
100 10−1 10−2 10−3 10−4 10−5 10−6 10−7 10−8 10−9 10−10 10−11 10−12 10−13 2 10
SDC35 SDC47
SDC59 SDC611
IDC1 IDC2
Relative error [-]
Relative error [-]
SDC11 SDC23
103
104
105
100 10−1 10−2 10−3 10−4 10−5 10−6 10−7 10−8 10−9 10−10 10−11 10−12 10−13 2 10
Computational costs [s]
103
BDF2 SDIRK3 ESDIRK3 ESDIRK5 ESDIRK74PR
PIES5 PIES6
104
104
105
(b) Velocity error IDC schemes
Relative error [-]
Relative error [-]
100 10−1 10−2 10−3 10−4 10−5 10−6 10−7 10−8 10−9 10−10 10−11 10−12 10−13 2 10
PIES3 PIES4
IDC5 IDC6
Computational costs [s]
(a) Velocity error for SDC schemes
PIES1 PIES2
103
IDC3 IDC4
105
Computational costs [s]
100 10−1 10−2 10−3 10−4 10−5 10−6 10−7 10−8 10−9 10−10 10−11 10−12 10−13 2 10
103
SDIRK2 SDIRK4 ESDIRK4 ESDIRK53PR
104
105
Computational costs [s] −13
(c) Velocity error PIES schemes, δ = 1·10
(d) Velocity error SDIRK, ESDIRK and BDF schemes
Figure 7.11.: Lid-driven cavity flow with time dependent boundary condition: comparison of computational efficiency versus error in velocity.
109
Chapter 7. Numerical results for incompressible flows
Relative error [-]
PIES1, PIES2, PIES3, PIES4, PIES5, PIES6, 100 10−1 10−2 10−3 10−4 10−5 10−6 10−7 10−8 10−9 10−10 10−11 10−12 10−13 2 10
δ δ δ δ δ δ
= 10−5 = 10−5 = 10−5 = 10−5 = 10−5 = 10−5
PIES1, PIES2, PIES3, PIES4, PIES5, PIES6,
103
104
δ δ δ δ δ δ
= 10−13 = 10−13 = 10−13 = 10−13 = 10−13 = 10−13
105
Computational costs [s]
Figure 7.12.: Lid-driven cavity flow with time dependent boundary condition: comparison of computational efficiency versus error in velocity for PIES with δ = 1 · 10−5 and δ = 1 · 10−13 .
110
7.4. Flow around a cylinder
Relative error [-]
SDC ESDIRK
IDC BDF2
SDIRK PIES
100 10−1 10−2 10−3 10−4 10−5 10−6 10−7 10−8 10−9 10−10 10−11 10−12 10−13 103
104
Computational costs [s] Figure 7.13.: Lid-driven cavity flow with time dependent boundary condition: smoothed computational costs versus error for SDC, IDC and ESDIRK.
Inlet
Outlet
Figure 7.14.: Schematic of the domain for the flow around a cylinder test case
111
Chapter 7. Numerical results for incompressible flows outlet and at the other boundaries the no-slip condition is imposed. At the outlet, the average pressure is set to zero, and the zero gradient boundary condition is applied on the remaining boundaries. The kinematic viscosity is ν = 1.0 · 10−3 m2 /s, and the fluid density is ρ = 1.0 kg/m3 . A zero initial solution is used for both the velocity and pressure. The mesh consists of 38 156 control volumes. Based on the mean inflow velocity, the Reynolds number varies between zero and 100. A second order upwind scheme is used for the convection term of the Navier-Stokes equations. The diffusion term is discretized with a second order centered scheme including a non-orthogonality correction. A time step of 0.01 s is used for all time integration schemes. Figure 7.15 shows the lift coefficient cl , drag coefficient cd and the difference of the pressure between the front and back of the cylinder ∆p for a subset of the studied time integration schemes, namely SDC, ESDIRK and BDF schemes. The lift and drag coefficient are defined as: cl (t) = − cd (t) =
2 L (t) , ρ umax 2 S
2 D (t) , ρ umax 2 S
(7.9) (7.10)
with the lift force L, drag force D, and reference area S (0.1 m). The lift coefficient is the most sensitive to the used time discretization scheme. Also, it is immediately clear that the backward Euler method produces inaccurate results for cl . BDF2 follows the general trend of the lift history but introduces a phase shift in time. Fig. c shows a zoom of the lift coefficient. Note that the ESDIRK4, ESDIRK5, SDC35, and SDC47 methods produce identical results indicating that the temporal discretization error is not dominating for these simulations. The third order SDC23 and ESDIRK53PR lie close to the reference values. Table 7.1 shows the computational times, relative error of the lift coefficient for 0 ≤ t ≤ 8 for a second set of simulations. Namely, the length of a sub-step or stage of each method is approximately the same for each time integration scheme. The relative error of the lift coefficient is determined by using a cubic interpolation of the lift coefficient in the complete time interval to the time instants of the reference solution, thereafter computing the L2 -norm of the difference between the approximation and reference
112
7.4. Flow around a cylinder
SDC23 SDC47 ESDIRK4 ESDIRK53PR BDF2
SDC35 ESDIRK3 ESDIRK5 BDF1
2.5 2 1.5 1 0.5 0
0
1
2
3
4
5
6
7
−0.5
8
0
1
2
3
Time [s]
SDC23 SDC47 ESDIRK4 ESDIRK53PR BDF2
SDC35 ESDIRK3 ESDIRK5
0.495 0.495 0.494 0.494 0.493 0.493 0.492 5.51
5.52
5.53
6
7
8
SDC35 ESDIRK3 ESDIRK5 BDF1
2.5
0.496
0.492 5.5
5
(b) Drag coefficient
Pressure difference [Pa]
SDC23 SDC47 ESDIRK4 ESDIRK53PR
4
Time [s]
(a) Lift coefficient
Lift coefficient [-]
SDC35 ESDIRK3 ESDIRK5 BDF1
3
0.5 0.4 0.3 0.2 0.1 0 −0.1 −0.2 −0.3 −0.4 −0.5
Drag coefficient [-]
Lift coefficient [-]
SDC23 SDC47 ESDIRK4 ESDIRK53PR BDF2
5.54
Time [s]
(c) Zoom of lift coefficient
5.55
2 1.5 1 0.5 0 0
1
2
3
4
5
6
7
8
Time [s] (d) Pressure difference
Figure 7.15.: Lift, drag coefficient, and pressure difference for SDC, ESDIRK and BDF time integration schemes
113
Chapter 7. Numerical results for incompressible flows Table 7.1.: Flow around a cylinder test case: time step versus computational time for different time discretization schemes
Method SDC47 SDC35 SDC23 ESDIRK53PR ESDIRK5 ESDIRK4 ESDIRK3 BDF2 BDF1
Time step [s]
Computational time [h]
Relative error
0.04 0.03 0.02 0.04 0.07 0.05 0.03 0.01 0.01
33.1 28.3 24.4 13.5 14.9 14.1 14.5 10.6 13.8
1.10 · 10−3 1.55 · 10−3 9.76 · 10−3 8.73 · 10−2 2.03 · 10−2 2.59 · 10−2 1.23 · 10−1 6.16 · 10−1 1.01 · 10+0
solution, and scaling by the L2 -norm of the reference solution. The ESDIRK schemes have similar computational costs but show a clear increase in accuracy for higher orders. The SDC schemes have higher timings, however also smaller errors for the lift coefficient. It is interesting to point out that large errors for the BDF1 and BDF2 methods occur, where the error of BDF1 is larger than 100% for this simulation run. Similar conclusions for the ESDIRK and SDC methods can be drawn from this case, namely that ESDIRK proves to be an efficient time integration method for moderate accuracies. SDC schemes of higher order are good candidates for even higher accuracies.
114
Chapter 8. Numerical results for partitioned fluid-structure interaction simulations using integral deferred corrections Before I came here I was confused about this subject. Having listened to your lecture I am still confused. But on a higher level. (Enrico Fermi)
Now, we consider arbitrarily high-order time integration schemes using integral deferred corrections for partitioned fluid-structure interaction simulations. The integral deferred correction method is applied for the first time to a fluid-structure interaction problem. By partitioning the computational domain into a fluid and solid domain, a partitioning error is introduced. Furthermore, the use of a segregated solution technique (iterated PISO) for the incompressible Navier-Stokes equations introduces a second splitting error. By using sub-iterations accelerated by Anderson acceleration, the partitioning error is minimized. In this chapter, we apply the IDC method which uses uniform sub-steps. With uniform sub-steps, information from previous sub-steps and previous time steps can easily be reused by the Anderson acceleration technique to Parts of this chapter have been published in D. S. Blom et al. “Arbitrarily high order time integration for partitioned fluid-structure interaction simulations using integral deferred corrections”. In: Journal of Computational Physics under review (2016).
115
Chapter 8. Numerical results for partitioned fluid-structure interaction
z
r
p
p r h
L
Figure 8.1.: Geometry of the one-dimensional model for the unsteady, incompressible flow through an elastic tube. The length L, the inner radius r, the pressure p acting on the inner wall of the tube, and the wall thickness h is shown. Deformation of the tube walls in radial direction is caused by the fluid pressure p acting on the inner tube walls. The figure is taken from Mehl et al. [76].
speed up the convergence of the coupling iterations in the current substep. In the case of spectral deferred corrections or the SDIRK method, non-uniform sub-steps are applied. Then, it is necessary to scale the values of the interface Jacobian by the used sub-step. Otherwise, the change in sub-step size will be incorporated in the approximation of the interface Jacobian possibly increasing the number of coupling iterations instead of accelerating the method. By considering several test cases, the theoretical order of convergence is confirmed for the velocity as well as the pressure. The accuracy of the integral deferred method is compared to singly-diagonally-implicit RungeKutta methods (SDIRK). The numerical results show an order reduction for the SDIRK methods for which the coefficients do not satisfy order conditions derived from the Prothero-Robinson example, whereas the integral deferred correction achieves the expected order of accuracy. The use of different time integration schemes for the fluid and solid domain shows that the IDC method can be effectively combined with a second-order time integration scheme for the structural domain.
8.1. Unsteady flow in a one-dimensional tube The first case consists of an incompressible, unsteady flow in a one-dimensional flexible tube [34, 36]. The tube has a circular cross-section and length L,
116
8.1. Unsteady flow in a one-dimensional tube as shown in Fig. 8.1. This example is straightforward to implement and is a good example of a strongly coupled fluid-structure interaction problem. Two different structural models are considered based on a Hookean constitutive equation, and a generalized string model based on linear elasticity theory where an inertia term is included.
8.1.1. Governing equation for the fluid model The flow is governed by the equations for conservation of mass and conservation of momentum written in conservative form as ρf ∂ a ρf ∂ a v + = 0, ∂t ∂z and
1 ∂ a v ∂ a v2 + + ∂t ∂z ρf
�
∂ ap ∂a −p ∂z ∂z
(8.1) � = 0,
(8.2)
with the coordinate z along the axis of the elastic tube, the cross-sectional area a and the velocity v in z-direction. r is the inner radius of the tube, the time is denoted by t, p represents the pressure, and ρf is the density of the fluid. Gravity and viscosity are not taken into account by the model.
8.1.2. Governing equation for the structural model A Hookean constitutive relation describes the behavior of the elastic tube wall. The inertia of the tube wall is neglected with respect to the inertia of the fluid, resulting in a structure without mass. The stress acting in circumferential direction σφφ is approximated with σφφ = E
r − r0 + σφφ0 r0
(8.3)
for a given Young’s modulus E and radius r0 for which σφφ = σφφ0 . Only radial motion of the tube wall is allowed. The forces acting on the fluidstructure interface are in balance, thus rp = σφφ h.
(8.4)
The following relation can be found after substitution of the constitutive
117
Chapter 8. Numerical results for partitioned fluid-structure interaction equation (8.3) into (8.4) rp =
Eh (r − r0 ) + r0 p0 , ρr0
(8.5)
which can also be written as a = a0
p0 2 ρf p 2 ρf
− c2M K
!2
− c2M K
,
given the Moens-Korteweg wave speed cM K s Eh . cM K = 2 ρf r0
(8.6)
(8.7)
8.1.3. Generalized string model for the structural model Since the previously discussed structural model does not take inertia into account and hence does not include a time derivative, we consider a second structural model. The model is based on linear elasticity theory for a cylindrical tube with a small thickness. The axial and circumferential displacement of the wall are not taken into account. The governing equation for the structure is as follows: ρs h
∂2r ∂3r ∂2r E h r − r0 −γ 2 − κGh 2 + = p, 2 2 2 ∂t ∂z 1−ν ∂ z ∂t r0
(8.8)
with the inner radius r, the structural density ρs , and the thickness of the wall h. The shear modulus G, Young’s modulus E, and Poisson’s coefficient ν are introduced as well. The model is further simplified by neglecting the viscoelastic term, i.e. γ = 0 [52]. The Timoshenko shear corrector factor κ is related to Poisson’s coefficient with [30] κ=
118
2 (1 + ν) . 4 + 3ν
(8.9)
8.1. Unsteady flow in a one-dimensional tube
8.1.4. Discretization The tube is discretized with N cells of length ∆z. The velocity and pressure of the flow are determined in the cell centers. A central discretization is employed for the continuity and momentum equation. However, the convective term of the momentum equation is discretized with a first-order upwind scheme. The velocity at the inlet is calculated as � � v0 2 π v0 t vin = v0 + sin . (8.10) 10 L The problem can be described with two dimensionless parameters, namely the dimensionless stiffness κ q p0 Eh 2ρf r0 − 2ρf c0 κ= = , (8.11) v0 v0 and the dimensionless time step τ = v0L∆t . For the computations shown in this section, κ is set to κ = 10, and τ is varied to show the order of convergence of the time stepping schemes. This results in a strong coupling between the fluid and the structure [36]. The initial conditions are the dimensionless velocity vc00 = 0.1, the dimensionless pressure ρ pc2 = 0, and f 0 the dimensionless cross-sectional area aa0 = 1.
8.1.5. Numerical results Three separate simulation sets are used to compare integral deferred corrections with implicit Runge-Kutta methods. First, we use a structural model without inertia or time-derivative term. Then, we introduce a time derivative into the structural equals and compare IDC with SDIRK. Finally, we look at combining different time integration schemes for the fluid and solid domains. Results for integral deferred corrections and SDIRK Figure 8.2 shows the convergence study for both the velocity and crosssectional area of the tube. Both the cross-sectional area and the velocity
119
Chapter 8. Numerical results for partitioned fluid-structure interaction
10−3 10−4 10−5 10−6 10−7 10−8 10−9 10−10 10−11 10−12 10−13
1 1
1 1
IDC1 IDC3 IDC5 SDIRK2 SDIRK4 ESDIRK74PR
IDC2 IDC4 IDC6 SDIRK3 SDIRK2PR
1
Error in velocity [-]
Error in area [-]
IDC1 IDC3 IDC5 SDIRK2 SDIRK4 ESDIRK74PR
2
3 4
5
1 10−1
Time step [s] (a) Area
100
10−2 10−3 10−4 10−5 10−6 10−7 10−8 10−9 10−10 10−11 10−12
1 1
1 1
IDC2 IDC4 IDC6 SDIRK3 SDIRK2PR
1 2
3 4
5
1 10−1
100
Time step [s] (b) Velocity
Figure 8.2.: Unsteady flow in a one-dimensional tube: order of convergence confirmed for the IDC method when applied to a fluid-structure interaction problem. Order reduction observed for the fourth order SDIRK4 method.
show the expected order of convergence for the IDC method when increasing the order from 1 to 6. However, for the SDIRK method, an order reduction to third order is apparent for SDIRK4 as shown in Fig. 8.2a. An order reduction is also observed for the velocity (Fig. 8.2b). Results for IDC and SDIRK with inertia for the solid Figure 8.3 shows the results of the time step study for the fluid-structure interaction problem with the second structural model, i.e. an inertia term for the solid is added. The figure shows the relative error for the velocity of the fluid and the velocity of the structure. The observed order of accuracy for both the SDIRK3 and SDIRK4 methods is reduced to second order, as shown in Fig. 8.3b. However, the IDC method still shows the expected orders of accuracy.
120
8.1. Unsteady flow in a one-dimensional tube
10−2 10−3 10−4 10−5 10−6 10−7 10−8 10−9 10−10 10−11
1 1
1 1
IDC1 IDC3 IDC5 SDIRK3 SDIRK2PR
IDC2 IDC4 SDIRK2 SDIRK4 SDIRK74PR
Error in solid velocity [-]
Error in fluid velocity [-]
IDC1 IDC3 IDC5 SDIRK3 SDIRK2PR 1 2
3 4 10−1
Time step [s] (a) Velocity of the fluid
100
100 10−1 10−2 10−3
1 1
IDC2 IDC4 SDIRK2 SDIRK4 SDIRK74PR
1 2
10−4 10−5 10−6 10−7 10−8
1 1
3 4 10−1
100
Time step [s] (b) Velocity of the structure
Figure 8.3.: Unsteady flow in a one-dimensional tube with inertia for the solid: order of convergence confirmed for the IDC method when applied to a fluid-structure interaction problem. Again an order reduction observed for the fourth order SDIRK4 method, and now also for the SDIRK3 method.
121
Chapter 8. Numerical results for partitioned fluid-structure interaction Note that the ESDIRK74PR method does not suffer from an order reduction for this fluid-structure interaction problem. The coefficients for the method have been derived by Rang [83] by analyzing the ProtheroRobinson example and are of interest when index-2 differential algebraic equations (DAE) are considered [57] such as the incompressible NavierStokes equations. However, the simulation with the smallest time step did not finish, due to convergence problems of the coupling iterations. The SDIRK2PR also satisfies the new order conditions derived from the Prothero-Robinson example and shows the expected second order of accuracy. The SDIRK3 and SDIRK4 methods do not satisfy those extra order conditions and do show an order reduction to second order, as mentioned earlier. When the integral deferred correction method is used, the theoretical orders of convergence are observed. Also, convergence problems for the coupling iterations did not occur. IDC5 with time step ∆t = 0.03125 s is used as the reference simulation, and is therefore not shown in the convergence plots. Different time integration schemes for the fluid and solid domains When considering the partitioned setup of the fluid-structure interaction simulation, it can be expected that the dedicated solvers for the different domains use different time integration methods. Here, we consider combining the IDC method for the fluid with the second order backward differencing method (BDF2) for the solid. Naturally, other time integration schemes can also be used for the solid mechanics solver. Different choices can be made how the fluid and solid solvers are coupled in time. One approach would be to only exchange information at tn+1 . For this example, we have chosen to perform sub-iterations at each sub-step and keep the solutions of each sub-step in memory for the solid solver for robustness and accuracy reasons. Figure 8.4 shows the procedure for one sweep. Figure 8.5 shows the results of the time step study when changing the order of accuracy of IDC in the fluid domain, while keeping the second order accurate BDF2 scheme in the structural domain. As can be seen in the figure, for large time steps the accuracy of the overall simulation using a third or higher order method is higher compared to IDC2-BDF2. However, for the velocity of the solid and for small time steps the accuracy
122
8.2. Lid-driven cavity flow with a moving mesh
2 Fluid
3
1
Structure Tn
4
t1
t2
t3
Tn+1
Figure 8.4.: Schematic of the conventional staggered procedure when combined with the integral deferred correction method.
is limited by the solid domain as can be expected. So, it can be concluded that it is beneficiary to use a higher order time integration scheme for the fluid domain to reach a high accuracy for the fluid solution assuming that the accuracy of the structure does not dominate the overall solution. Generally, the time scales of the fluid domain are much smaller than the time scales in the structural domain, which is the reason why some authors use sub-cycling [82] for those type of conditions, and why one expects a benefit using a high order of accuracy in the fluid domain and a lower order approximation for the structure.
8.2. Lid-driven cavity flow with a moving mesh The lid-driven cavity flow has been used by other researchers to study different time integration schemes [8, 66]. A two-dimensional incompressible flow is considered with Reynolds number Re = 10. The computational domain consists of a unit square with solid boundaries. At the top, a Dirichlet boundary condition is applied to the velocity in the x-direction with the value 1 m/s. A zero-gradient boundary condition is used for the pressure, and the no-slip boundary condition is applied on the solid walls for the velocity. Second order centered schemes are used for the spatial discretization.
123
Chapter 8. Numerical results for partitioned fluid-structure interaction
IDC1-BDF1 IDC3-BDF2
IDC2-BDF2 IDC4-BDF2
IDC1-BDF1 IDC3-BDF2
−3
10
10−4 10−5
1
1
−6
10
3 1
10−7 10−8 10−9
1 10−2
2 10−1
Time step [s] (a) Velocity of the fluid
100
Error in solid velocity [-]
Error in fluid velocity [-]
10−2
IDC2-BDF2 IDC4-BDF2
100 10−1 10−2 10−3
1
1 1
10−4
2
10−5 10−2
10−1
100
Time step [s] (b) Velocity of the structure
Figure 8.5.: Unsteady flow in a one-dimensional tube with inertia for the solid: BDF1/BDF2 time stepping for the solid domain, and IDC time stepping for the fluid domain. The accuracy of the overall simulation for large time steps using a third or higher order method is more accurate than the IDC2-BDF combination.
124
8.2. Lid-driven cavity flow with a moving mesh
8.2.1. Lid-driven cavity flow with internal moving mesh The internal mesh is deformed during the simulation as a first step to show the order of convergence for the velocity and pressure with a moving mesh. For the time step study, the initial transient of the simulation is considered. The flow is initially at rest, and the simulations are carried out until t = 0.05 s. The reference solution is obtained with the IDC6 scheme with ∆t = 0.00015625 s. A uniform mesh of size 25 × 25 is used. Figure 8.6 shows the temporal error of the velocity and pressure fields against the time step size for the IDC and SDIRK schemes. The theoretical order of accuracy for the velocity as well as for the pressure is confirmed for the integral deferred correction scheme. However, the SDIRK3 and SDIRK4 methods suffer from an order reduction to two for the pressure. Note that the SDIRK2PR shows the expected orders of convergence for the velocity, as well as for the pressure. This can be explained by the fact that the coefficients of the method satisfy extra order conditions as derived in Rang [84] by considering the Prothero-Robinson example, as mentioned in the previous section.
8.2.2. Lid-driven cavity flow with moving block The complexity of the lid-driven cavity flow is increased by including a block in the middle of the computation domain which follows a prescribed rigid body motion. The width and height of the block are 0.1 m. The flow is initially at rest, and the simulations are carried out until t = 0.05 s. The reference solution is obtained with the IDC6 scheme with ∆t = 0.00015625 s. A uniform mesh of size 24 × 24 is used. Figure 8.7 shows the pressure and vorticity contours at the end of the simulation. Figure 8.8 shows the temporal error of the velocity and pressure fields against the time step size for the IDC and SDIRK methods. The theoretical order of accuracy for the velocity as well as for the pressure is confirmed for the integral deferred correction scheme. SDIRK2, SDIRK3, and SDIRK4 reduce to first-order accuracy in time for the pressure, whereas the SDIRK2PR method shows second order accuracy for both the velocity and pressure. The pressure shows a reduction for the IDC5 and IDC6 methods when using small time steps. This can be explained by the fact that a zero-
125
Chapter 8. Numerical results for partitioned fluid-structure interaction
10−1 10−2 10−3 10−4 10−5 10−6 10−7 10−8 10−9 10−10 10−11 10−12 10−13 10−14 10−15 10−16
1 1 1 1 1
IDC2 IDC4 IDC5 SDIRK3 SDIRK2PR
1
IDC1 IDC3 IDC5 SDIRK2 SDIRK4
Relative error [-]
Relative error [-]
IDC1 IDC3 IDC5 SDIRK2 SDIRK4
2 3 4 5 10−3
Time step [s] (a) Velocity
10−2
10−1 10−2 10−3 10−4 10−5 10−6 10−7 10−8 10−9 10−10 10−11 10−12 10−13 10−14 10−15 10−16
1 1 1 1 1
IDC2 IDC4 IDC6 SDIRK3 SDIRK2PR
1 2 3 4 5 10−3
10−2
Time step [s] (b) Pressure
Figure 8.6.: Lid driven cavity with internal moving mesh: time step study for the IDC and SDIRK time integration schemes. The temporal L2 norm of the velocity and pressure error norm is shown. The SDIRK3 and SDIRK4 schemes suffer from an order reduction for the pressure. The integral deferred correction method performs as expected.
126
8.3. Three-dimensional flow over an elastic structure
(a) Pressure contours
(b) Vorticity contours
Figure 8.7.: Lid-driven cavity flow with moving block: pressure and vorticity contours at the end of the time interval
gradient boundary condition is used for the pressure at the (moving) walls. A more consistent boundary condition is proposed by Gresho and Sani [54] which evaluates the momentum equation on the boundary to obtain the pressure boundary condition. However, this is a non-trivial task for unstructured collocated grids and is therefore left to be assessed in future studies. Therefore, in this study, the often applied zero-gradient condition is used.
8.3. Three-dimensional flow over an elastic structure A three-dimensional incompressible flow is considered over a flexible beam fixed to a wall, discussed in [86]. The problem is considered to be symmetric in the x/y plane. Thus, the simulation is only performed in one-half of the domain. The width and height of the computational domain are 0.4 m, where the length is 1.5 m. The structure consists of a rectangular block with a width and height of 0.2 m, and a length of 0.1 m. The mesh of the flow domain is shown in Fig. 8.9.
127
Chapter 8. Numerical results for partitioned fluid-structure interaction
10−1 10−2 10−3 10−4 10−5 10−6 10−7 10−8 10−9 10−10 10−11 10−12 10−13 10−14 10−15
1 1 1 1 1
IDC2 IDC4 IDC6 SDIRK3 SDIRK2PR
1
IDC1 IDC3 IDC5 SDIRK2 SDIRK4
Relative error [-]
Relative error [-]
IDC1 IDC3 IDC5 SDIRK2 SDIRK4
2 3 4 5 10−3
Time step [s] (a) Velocity
10−2
10−1 10−2 10−3 10−4 10−5 10−6 10−7 10−8 10−9 10−10 10−11
1
1 1
IDC2 IDC4 IDC6 SDIRK3 SDIRK2PR
1 2
1
4
3
10−3
10−2
Time step [s] (b) Pressure
Figure 8.8.: Lid-driven cavity flow with moving block: time step study for integral deferred corrections. The temporal L2 norm of the velocity and pressure error norm is shown.
128
8.3. Three-dimensional flow over an elastic structure
8.3.1. Governing equation for the structural model The configuration of the structure domain is described by the displacement us . The structure is assumed to be elastic and compressible, and the governing equation is given by the balance of momentum ρs
∂v s + ρs (∇v s ) v s = ∇ · σ s + ρs g ∂t
in Ωst .
(8.12)
Eqn. (8.12) is modified to use the total Lagrangian description, i.e. with respect to the initial reference state Ωs , resulting in ρs
� ∂ 2 us = ∇ · Jσ s F −T + ρs g 2 ∂t
in Ωs ,
(8.13)
where the deformation gradient tensor F is defined as F = I + ∇us , and the Jacobian J is the determinant of the deformation gradient tensor F . By applying the constitutive law for the St. Venant-Kirchhoff material, the Cauchy stress tensor σ s is found by applying σs = with E =
1 2
1 F (λs (tr E) I + 2µs E) F T , J
(8.14)
� F T F − I , and the shear modulus µs [24].
8.3.2. Numerical results At the inflow boundary a parabolic velocity profile is imposed as a Dirichlet boundary condition with peak velocity vmax = 0.3 m/s. On the outflow boundary, the zero gradient condition is imposed on the velocity and the pressure has a Dirichlet boundary condition with zero pressure. A no-slip condition is used on the remaining boundaries. The incompressible fluid has a density ρ = 103 kg/m3 , and kinematic viscosity ν = 10−3 m2 /s. The density of the solid is 103 kg/m3 , the Poisson ratio ν s = 0.4 and the Young’s modulus E is set to 104 N/m2 , which is a smaller value as in [86] resulting in a larger displacement of the beam. Radial basis function interpolation is used to deform the fluid mesh. Anderson acceleration is used to perform the coupling iterations on the FSI interface. Matching grids are used at the FSI interface.
129
Chapter 8. Numerical results for partitioned fluid-structure interaction
Figure 8.9.: Three-dimensional flow over an elastic structure. Computational grid of the flow domain.
From t = 0 s until t = 5 s, the solid is assumed to be fixed. After that, a starting procedure is applied to use a smooth increase of the applied pressure and viscous force on the solid in time as ( F (t) =
0 0 < t