1
Efficient Processing of Deep Neural Networks: A Tutorial and Survey Vivienne Sze, Senior Member, IEEE, Yu-Hsin Chen, Student Member, IEEE, Tien-Ju Yang, Student Member, IEEE, Joel Emer, Fellow, IEEE
Abstract—Deep neural networks (DNNs) are currently widely used for many artificial intelligence (AI) applications including computer vision, speech recognition, and robotics. While DNNs deliver state-of-the-art accuracy on many AI tasks, it comes at the cost of high computational complexity. Accordingly, techniques that enable efficient processing of DNNs to improve energy efficiency and throughput without sacrificing application accuracy or increasing hardware cost are critical to the wide deployment of DNNs in AI systems. This article aims to provide a comprehensive tutorial and survey about the recent advances towards the goal of enabling efficient processing of DNNs. Specifically, it will provide an overview of DNNs, discuss various hardware platforms and architectures that support DNNs, and highlight key trends in reducing the computation cost of DNNs either solely via hardware design changes or via joint hardware design and DNN algorithm changes. It will also summarize various development resources that enable researchers and practitioners to quickly get started in this field, and highlight important benchmarking metrics and design considerations that should be used for evaluating the rapidly growing number of DNN hardware designs, optionally including algorithmic co-designs, being proposed in academia and industry. The reader will take away the following concepts from this article: understand the key design considerations for DNNs; be able to evaluate different DNN hardware implementations with benchmarks and comparison metrics; understand the trade-offs between various hardware architectures and platforms; be able to evaluate the utility of various DNN design techniques for efficient processing; and understand recent implementation trends and opportunities. Index Terms—Deep Learning, Deep Neural Networks, Convolutional Neural Networks, Machine Learning, Computer Architecture, VLSI, ASIC, Low Power, Energy-Efficient Accelerators, Dataflow Processing, Spatial Architectures
superior performance of DNNs comes from its ability to extract high-level features from raw sensory data after using statistical learning over a large amount of data to obtain an effective representation of an input space. This is different from earlier approaches that use hand-crafted features or rules designed by experts. The superior accuracy of DNNs, however, comes at the cost of high computational complexity. While general-purpose compute engines, especially graphics processing units (GPUs), have been the mainstay for much DNN processing, increasingly there is interest in providing more specialized acceleration of the DNN computation. This article aims to provide an overview of DNNs, the various tools for understanding their behavior, and the techniques being explored to efficiently accelerate their computation. This paper is organized as follows: • • • •
•
I. I NTRODUCTION Deep neural networks (DNNs) are currently the foundation for many modern artificial intelligence (AI) applications [1]. Since the breakthrough application of DNNs to speech recognition [2] and image recognition [3], the number of applications that use DNNs has exploded. These DNNs are employed in a myriad of applications from self-driving cars [4], to detecting cancer [5] to playing complex games [6]. In many of these domains, DNNs are now able to exceed human accuracy. The
•
•
Section II provides background on the context of why DNNs are important, their history and applications. Section III gives an overview of the basic components of DNNs and popular DNN models currently in use. Section IV describes the various resources used for DNN research and development. Section V describes the various hardware platforms used to process DNNs and the various optimizations used to improve throughput and energy efficiency without impacting application accuracy (i.e., produce bit-wise identical results). Section VI discusses how mixed-signal circuits and new memory technologies can be used for near-data processing to address the expensive data movement that dominates throughput and energy consumption of DNNs. Section VII describes various joint algorithm and hardware optimizations that can be performed on DNNs to improve both throughput and energy efficiency while trying to minimize impact on accuracy. Section VIII describes the key metrics that should be considered when comparing various DNN designs.
II. BACKGROUND ON D EEP N EURAL N ETWORKS (DNN) V. Sze, Y.-H. Chen and T.-J. Yang are with the Department of Electrical Engineering and Computer Science, Massachusetts Institute of Technology, Cambridge, MA 02139 USA. (e-mail:
[email protected];
[email protected],
[email protected]) J. S. Emer is with the Department of Electrical Engineering and Computer Science, Massachusetts Institute of Technology, Cambridge, MA 02139 USA, and also with Nvidia Corporation, Westford, MA 01886 USA. (e-mail:
[email protected])
In this section, we describe the position of DNNs in the context of AI in general and some of the concepts that motivated its development. We will also present a brief chronology of the major steps in its history, and some current domains to which it is being applied.
2
Artificial Intelligence Machine Learning
x0
axon
w0
synapse
w0 x0
Brain-Inspired Spiking
Neural Networks Deep Learning
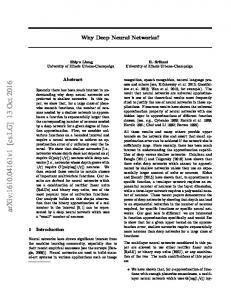
Fig. 1.
Deep Learning in the context of Artificial Intelligence.
dendrite neuron
w1 x1
⎛ ⎞ y j = f ⎜ ∑ wi xi + b ⎟ ⎝ i ⎠
yj
axon
w2 x2
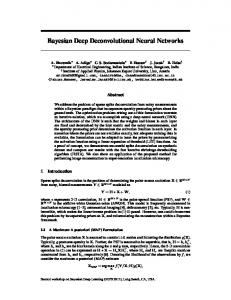
Fig. 2. Connections to a neuron in the brain. xi , wi , f (·), and b are the activations, weights, non-linear function and bias, respectively. (Figure adopted from [7].)
and output signals are referred to as activations. The axon of one neuron branches out and is connected to the dendrites of DNNs, also referred to as deep learning, are a part of many other neurons. The connections between a branch of the the broad field of AI, which is the science and engineering axon and a dendrite is called a synapse. There are estimated of creating intelligent machines that have the ability to to be 1014 to 1015 synapses in the average human brain. achieve goals like humans do, according to John McCarthy, A key characteristic of the synapse is that it can scale the the computer scientist who coined the term in the 1950s. signal (xi ) crossing it as shown in Fig. 2. That scaling factor The relationship of deep learning to the whole of artificial can be referred to as a weight (wi ), and the way the brain is intelligence is illustrated in Fig. 1. believed to learn is through changes to the weights associated Within artificial intelligence is a large sub-field called with the synapses. Thus, different weights result in different machine learning, which was defined in 1959 by Arthur Samuel responses to an input. Note that learning is the adjustment as the field of study that gives computers the ability to learn of the weights in response to a learning stimulus, while the without being explicitly programmed. That means a single organization (what might be thought of as the program) of the program, once created, will be able to learn how to do some brain does not change. This characteristic makes the brain an intelligent activities outside the notion of programming. This is excellent inspiration for a machine-learning-style algorithm. Within the brain-inspired computing paradigm there is a in contrast to purpose-built programs whose behavior is defined by hand-crafted heuristics that explicitly and statically define subarea called spiking computing. In this subarea, inspiration is taken from the fact that the communication on the dendrites their behavior. The advantage of an effective machine learning algorithm and axons are spike-like pulses and that the information being is clear. Instead of the laborious and hit-or-miss approach of conveyed is not just based on a spike’s amplitude. Instead, creating a distinct, custom program to solve each individual it also depends on the time the pulse arrives and that the problem in a domain, the single machine learning algorithm computation that happens in the neuron is a function of not just simply needs to learn, via a processes called training, to handle a single value but the width of pulse and the timing relationship between different pulses. An example of a project that was each new problem. Within the machine learning field, there is an area that is inspired by the spiking of the brain is the IBM TrueNorth [8]. often referred to as brain-inspired computation. Since the brain In contrast to spiking computing, another subarea of brainis currently the best ‘machine’ we know for learning and inspired computing is called neural networks, which is the 1 solving problems, it is a natural place to look for a machine focus of this article. learning approach. Therefore, a brain-inspired computation is a program or algorithm that takes some aspects of its basic B. Neural Networks and Deep Neural Networks (DNNs) form or functionality from the way the brain works. This is in Neural networks take their inspiration from the notion that contrast to attempts to create a brain, but rather the program a neuron’s computation involves a weighted sum of the input aims to emulate some aspects of how we understand the brain values. These weighted sums correspond to the value scaling to operate. performed by the synapses and the combining of those values Although scientists are still exploring the details of how the in the neuron. Furthermore, the neuron doesn’t just output that brain works, it is generally believed that the main computational weighted sum, since the computation associated with a cascade element of the brain is the neuron. There are approximately of neurons would then be a simple linear algebra operation. 86 billion neurons in the average human brain. The neurons Instead there is a functional operation within the neuron that themselves are connected together with a number of elements is performed on the combined inputs. This operation appears entering them called dendrites and an element leaving them called an axon as shown in Fig. 2. The neuron accepts the 1 Note: Recent work using TrueNorth in a stylized fashion allows it to be signals entering it via the dendrites, performs a computation on used to compute reduced precision neural networks [9]. These types of neural those signals, and generates a signal on the axon. These input networks are discussed in Section VII-A. A. Artificial Intelligence and DNNs
3
Neurons (activations)
C. Inference versus Training Layer 1
Layer 2
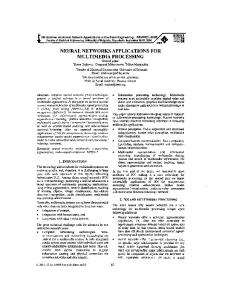
Since DNNs are an instance of a machine learning algorithm, the basic program does not change as it learns to perform its X given tasks. In the specific case of DNNs, this learning involves Y X determining the value of the weights (and bias) in the network, Y X and is referred to as training the network. Once trained, the W Y L2 Output Neurons L1 Input Neurons program can perform its task by computing the output of Synapses (e.g. image pixels) L1 Output Neurons a.k.a. Activations (weights) the network using the weights determined during the training (a) Neurons and synapses (b) Compute weighted sum for each layer process. Running the program with these weights is referred to as inference. Fig. 3. Simple neural network example and terminology (Figure adopted In this section, we will use image classification, as shown from [7]). in Fig. 6, as a driving example for training and using a DNN. When we perform inference using a DNN, we give an input image and the output of the DNN is a vector of scores, one for to be a non-linear function that causes a neuron to generate each object class; the class with the highest score indicates the an output only if the inputs cross some threshold. Thus by most likely class of object in the image. The overarching goal analogy, neural networks apply a non-linear function to the for training a DNN is to determine the weights that maximize weighted sum of the input values. We look at what some of the score of the correct class and minimize the scores of the those non-linear functions are in Section III-A1. incorrect classes. When training the network the correct class Fig. 3(a) shows a diagrammatic picture of a computational is often known because it is given for the images used for neural network. The neurons in the input layer receive some training (i.e., the training set of the network). The gap between values and propagate them to the neurons in the middle layer the ideal correct scores and the scores computed by the DNN of the network, which is also frequently called a ‘hidden based on its current weights is referred to as the loss (L). layer’. The weighted sums from one or more hidden layers are Thus the goal of training DNNs is to find a set of weights to ultimately propagated to the output layer, which presents the minimize the average loss over a large training set. final outputs of the network to the user. To align brain-inspired When training a network, the weights (wij ) are usually terminology with neural networks, the outputs of the neurons updated using a hill-climbing optimization process called are often referred to as activations, and the synapses are often gradient descent. A multiple of the gradient of the loss relative referred to as weights as shown in Fig. 3(a). We will use the to each weight, which is the partial derivative of the loss with activation/weight nomenclature in this article. respect to the weight, is used to update the weight (i.e., updated t+1 ∂L t Fig. 3(b) shows an example of the computation at each wij = wij −α ∂w , where α is called the learning rate). Note ij 3 P that this gradient indicates how the weights should change in layer: yj = f ( Wij × xi + b), where Wij , xi and yj are the order to reduce the loss. The process is repeated iteratively to i=1 weights, input activations and output activations, respectively, reduce the overall loss. and f (·) is a non-linear function described in Section III-A1. An efficient way to compute the partial derivatives of The bias term b is omitted from Fig. 3(b) for simplicity. the gradient is through a process called backpropagation. Within the domain of neural networks, there is an area called Backpropagation, which is a computation derived from the deep learning, in which the neural networks have more than chain rule of calculus, operates by passing values backwards three layers, i.e., more than one hidden layer. Today, the typical through the network to compute how the loss is affected by numbers of network layers used in deep learning range from each weight. five to more than a thousand. In this article, we will generally This backpropagation computation is, in fact, very similar use the terminology deep neural networks (DNNs) to refer to in form to the computation used for inference as shown the neural networks used in deep learning. in Fig. 4 [10]. Thus, techniques for efficiently performing DNNs are capable of learning high-level features with more inference can sometimes be useful for performing training. complexity and abstraction than shallower neural networks. An It is, however, important to note a couple of points. First, example that demonstrates this point is using DNNs to process backpropagation requires intermediate outputs of the network visual data. In these applications, pixels of an image are fed into to be preserved for the backwards computation, thus training the first layer of a DNN, and the outputs of that layer can be has increased storage requirements. Second, due to the gradients interpreted as representing the presence of different low-level use for hill-climbing, the precision requirement for training features in the image, such as lines and edges. At subsequent is generally higher than inference. Thus many of the reduced layers, these features are then combined into a measure of the precision techniques discussed in Section VII are limited to likely presence of higher level features, e.g., lines are combined inference only. into shapes, which are further combined into sets of shapes. A variety of techniques are used to improve the efficiency And finally, given all this information, the network provides a and robustness of training. For example, often the loss from probability that these high-level features comprise a particular multiple sets of input data, i.e., a batch, are collected before a object or scene. This deep feature hierarchy enables DNNs to single pass of weight update is performed; this helps to speed achieve superior performance in many tasks. up and stabilize the training process. W11
Y1
1
2
2
3
3
34
4
4
∂L ∂w11
X1 ∂L ∂y1
……..
∂L ∂y2 ∂L ∂y3
∂L ∂y4 ∂L ∂w34
DNN Timeline
backpropagation
X3
backpropagation
• •
W11 ∂L ∂x1
∂L ∂y2
∂L ∂x2 ∂L ∂x3
∂L ∂y1
∂L ∂y3
W34
∂L ∂y4
• • • • •
(a) Compute the gradient of the loss relative to the weights
(b) Compute the gradient of the loss relative to the filter inputs
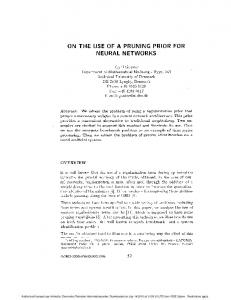
Fig. 4. There are two main iterative steps in backpropagation: (1) compute the gradient of the loss relative to the weights (Fig. 4(a)) using the filter inputs xi (i.e., the forward activations) and the gradients of the loss relative to the filter outputs; (2) compute the gradient of the loss relative to the filter inputs (Fig. 4(b)) using the filter weights wij and the gradients of the loss relative to the filter outputs.
There are multiple ways to train the weights. The most common approach, as described above, is called supervised learning, where all the training samples are labeled (e.g., with the correct class). Unsupervised learning is another approach where all the training samples are not labeled and essentially the goal is to find the structure or clusters in the data. Semisupervised learning falls in between the two approaches where only a small subset of the training data is labeled (e.g., use unlabeled data to define the cluster boundaries, and use the small amount of labeled data to label the clusters). Finally, reinforcement learning can be used to the train weights such that given the state of the current environment, the DNN can output what action the agent should take next to maximize expected rewards; however, the rewards might not be available immediately after an action, but instead only after a series of actions. Another commonly used approach to determine weights is fine-tuning, where previously-trained weights are available and are used as a starting point and then those weights are adjusted for a new dataset (e.g., transfer learning) or for a new constraint (e.g., reduced precision). This results in faster training than starting from a random starting point, and can sometimes result in better accuracy. This article will focus on the efficient processing of DNN inference rather than training, since DNN inference is often performed on embedded devices (rather than the cloud) where resources are limited as discussed in more details later. D. Development History Although neural nets were proposed in the 1940s, the first practical application employing multiple digital neurons didn’t appear until the late 1980s with the LeNet network for handwritten digit recognition [11]2 . Such systems are widely used by ATMs for digit recognition on checks. However, the early 2010s have seen a blossoming of DNN-based applications with highlights such as Microsoft’s speech recognition system in 2 In the early 1960s, single analog neuron systems were used for adaptive filtering [12, 13].
1940s - Neural networks were proposed 1960s - Deep neural networks were proposed 1989 - Neural networks for recognizing digits (LeNet) 1990s - Hardware for shallow neural nets (Intel ETANN) 2011 - Breakthrough DNN-based speech recognition (Microsoft) 2012 - DNNs for vision start supplanting hand-crafted approaches (AlexNet) 2014+ - Rise of DNN accelerator research (Neuflow, DianNao...)
Fig. 5. A concise history of neural networks. ’Deep’ refers to the number of layers in the network.
2011 [2] and the AlexNet system for image recognition in 2012 [3]. A brief chronology of deep learning is shown in Fig. 5. The deep learning successes of the early 2010s are believed to be a confluence of three factors. The first factor is the amount of available information to train the networks. To learn a powerful representation (rather than using a hand-crafted approach) requires a large amount of training data. For example, Facebook receives over 350 millions images per day, Walmart creates 2.5 Petabytes of customer data hourly and YouTube has 300 hours of video uploaded every minute. As a result, the cloud providers and many businesses have a huge amount of data to train their algorithms. The second factor is the amount of compute capacity available. Semiconductor device and computer architecture advances have continued to provide increased computing capability, and we appear to have crossed a threshold where the large amount of weighted sum computation in DNNs, which is required for both inference and training, can be performed in a reasonable amount of time. The successes of these early DNN applications opened the floodgates of algorithmic development. It has also inspired the development of several (largely open source) frameworks that make it even easier for researchers and practitioners to explore and use DNNs. Combining these efforts contributes to the third factor, which is the evolution of the algorithmic techniques that have improved application accuracy significantly and broadened the domains to which DNNs are being applied. An excellent example of the successes in deep learning can be illustrated with the ImageNet Challenge [14]. This challenge is a contest involving several different components. One of the components is an image classification task where algorithms are given an image and they must identify what is in the image, as shown in Fig. 6. The training set consists of 1.2 million images, each of which is labeled with one of 1000 object categories that the image contains. For the evaluation phase, the algorithm must accurately identify objects in a test set of images, which it hasn’t previously seen. Fig. 7 shows the performance of the best entrants in the ImageNet contest over a number of years. One sees that the accuracy of the algorithms initially had an error rate of 25% or more. In 2012, a group from the University of
5
is collected daily worldwide for video surveillance [17]. Computer vision is necessary to extract meaningful information from video. DNNs have significantly improved the Dog (0.7) accuracy of many computer vision tasks such as image Cat (0.1) Machine Bike (0.02) classification [14], object localization and detection [18], Learning Car (0.02) image segmentation [19], and action recognition [20]. (Inference) Plane (0.02) • Speech and Language DNNs have significantly improved House (0.04) the accuracy of speech recognition [21] as well as many related tasks such as machine translation [2], natural Fig. 6. Example of an image classification task. The machine learning language processing [22], and audio generation [23]. platform takes in an image and outputs the confidence scores for a predefined • Medical DNNs have played an important role in genomics set of classes. to gain insight into the genetics of diseases such as autism, cancers, and spinal muscular atrophy [24–27]. They have 30 also been used in medical imaging to detect skin cancer [5], 25 brain cancer [28] and breast cancer [29]. Large error rate reduction due to Deep CNN 20 • Game Play Recently, many of the grand AI challenges AlexNet OverFeat 15 involving game play have been overcome using DNNs. 10 VGG GoogLeNet These successes also required innovations in training ResNet 5 techniques and many rely on reinforcement learning [30]. 0 DNNs have surpassed human level accuracy in playing 2010 2011 2012 2013 2014 2015 Human Atari [31] as well as Go [6], where an exhaustive search of all possibilities is not feasible due to the unimaginably Fig. 7. Results from the ImageNet Challenge [14]. huge number of possible moves. • Robotics DNNs have been successful in the domain of robotic tasks such as grasping with a robotic arm [32], Toronto used graphics processing units (GPUs) for their high motion planning for ground robots [33], visual navigacompute capability and a deep neural network approach, named tion [4, 34], control to stabilize a quadcopter [35] and AlexNet, and dropped the error rate by approximately 10% [3]. driving strategies for autonomous vehicles [36]. Their accomplishment inspired an outpouring of deep learning DNNs are already widely used in multimedia applications style algorithms that have resulted in a steady stream of today (e.g., computer vision, speech recognition). Looking improvements. forward, we expect that DNNs will likely play an increasingly In conjunction with the trend to deep learning approaches important role in the medical and robotics fields, as discussed for the ImageNet Challenge, there has been a corresponding above, as well as finance (e.g., for trading, energy forecasting, increase in the number of entrants using GPUs. From 2012 and risk assessment), infrastructure (e.g., structural safety, and when only 4 entrants used GPUs to 2014 when almost all traffic control), weather forecasting and event detection [37]. the entrants (110) were using them. This reflects the almost The myriad application domains pose new challenges to the complete switch from traditional computer vision approaches efficient processing of DNNs; the solutions then have to be to deep learning-based approaches for the competition. adaptive and scalable in order to handle the new and varied In 2015, the ImageNet winning entry, ResNet [15], exceeded forms of DNNs that these applications may employ. 3 human-level accuracy with a top-5 error rate below 5%. Since then, the error rate has dropped below 3% and more focus is now being placed on more challenging components of the F. Embedded versus Cloud competition, such as object detection and localization. These The various applications and aspects of DNN processing successes are clearly a contributing factor to the wide range (i.e., training versus inference) have different computational of applications to which DNNs are being applied. needs. Specifically, training often requires a large dataset4 and significant computational resources for multiple weight-update iterations. In many cases, training a DNN model still takes E. Applications of DNN several hours to multiple days and thus is typically performed Many applications can benefit from DNNs ranging from in the cloud. Inference, on the other hand, can happen either multimedia to medical space. In this section, we will provide in the cloud or at the edge (e.g., IoT or mobile). examples of areas where DNNs are currently making an impact In many applications, it is desirable to have the DNN and highlight emerging areas where DNNs hope to make an inference processing near the sensor. For instance, in computer impact in the future. vision applications, such as measuring wait times in stores • Image and Video Video is arguably the biggest of the or predicting traffic patterns, it would be desirable to extract big data. It accounts for over 70% of today’s Internet meaningful information from the video right at the image traffic [16]. For instance, over 800 million hours of video sensor rather than in the cloud to reduce the communication Clarifai
Accuracy (Top-5 error)
Class Probabilities
3 The top-5 error rate is measured based on whether the correct answer appears in one of the top 5 categories selected by the algorithm.
4 One of the major drawbacks of DNNs is their need for large datasets to prevent over-fitting during training.
6
intermediate operations generate values that are stored internally in the network and used as inputs to other operations in conjunction with the processing of a later input. In this article, we will focus on feed-forward networks since (1) the major computation in RNNs is still the weighted sum (i.e., a matrixvector multiplication), which is covered by the feed-forward networks, and (2) to-date little attention has been given to hardware acceleration specifically for RNNs. (a) Feedforward versus feedback (re(b) Fully connected versus sparse DNNs can be composed solely of fully-connected (FC) current) networks layers (also referred to as multi-layer perceptrons, or MLP) as shown in the leftmost layer of Fig. 8(b). In a FC layer, Fig. 8. Different types of neural networks (Figure adopted from [7]). all output activations are composed of a weighted sum of all input activations (i.e., all outputs are connected to all cost. For other applications such as autonomous vehicles, inputs). This requires a significant amount of storage and drone navigation and robotics, local processing is desired since computation. Thankfully, in many applications, we can remove the latency and security risks of relying on the cloud are some connections between the activations by setting the weights too high. However, video involves a large amount of data, to zero without affecting accuracy. This results in a sparselywhich is computationally complex to process; thus, low cost connected layer. A sparsely connected layer is illustrated in hardware to analyze video is challenging yet critical to enabling the rightmost layer of Fig. 8(b). these applications. Speech recognition enables us to seamlessly We can also make the computation more efficient by limiting interact with electronic devices, such as smartphones. While the number of weights that contribute to an output. This sort of currently most of the processing for applications such as Apple structured sparsity can arise if each output is only a function Siri and Amazon Alexa voice services is in the cloud, it is of a fixed-size window of inputs. Even further efficiency can still desirable to perform the recognition on the device itself to be gained if the same set of weights are used in the calculation reduce latency and dependency on connectivity, and to improve of every output. This repeated use of the same weight values is privacy and security. called weight sharing and can significantly reduce the storage Many of the embedded platforms that perform DNN infer- requirements for weights. ence have stringent energy consumption, compute and memory An extremely popular windowed and weight-shared DNN cost limitations; efficient processing of DNNs have thus become layer arises by structuring the computation as a convolution, of prime importance under these constraints. Therefore, in this as shown in Fig. 9(a), where the weighted sum for each output article, we will focus on the compute requirements for inference activation is computed using only a small neighborhood of input rather than training. activations (i.e., all weights beyond beyond the neighborhood are set to zero), and where the same set of weights are shared for III. OVERVIEW OF DNN S every output (i.e., the filter is space invariant). Such convolutionDNNs come in a wide variety of shapes and sizes depending based layers are referred to as convolutional (CONV) layers. 5 on the application. The popular shapes and sizes are also evolving rapidly to improve accuracy and efficiency. In all A. Convolutional Neural Networks (CNNs) cases, the input to a DNN is a set of values representing the A common form of DNNs is Convolutional Neural Nets information to be analyzed by the network. For instance, these (CNNs), which are composed of multiple CONV layers as values can be pixels of an image, sampled amplitudes of an shown in Fig. 10. In such networks, each layer generates a audio wave or the numerical representation of the state of some successively higher-level abstraction of the input data, called system or game. a feature map (fmap), which preserves essential yet unique The networks that process the input come in two major information. Modern CNNs are able to achieve superior performs: feed forward and recurrent as shown in Fig. 8(a). In formance by employing a very deep hierarchy of layers. CNN feed-forward networks all of the computation is performed as a are widely used in a variety of applications including image sequence of operations on the outputs of a previous layer. The understanding [3], speech recognition [39], game play [6], final set of operations generates the output of the network, for robotics [32], etc. This paper will focus on its use in image example a probability that an image contains a particular object, processing, specifically for the task of image classification [3]. the probability that an audio sequence contains a particular Each of the CONV layers in CNN is primarily composed of word, a bounding box in an image around an object or the high-dimensional convolutions as shown in Fig. 9(b). In this proposed action that should be taken. In such DNNs, the computation, the input activations of a layer are structured as network has no memory and the output for an input is always a set of 2-D input feature maps (ifmaps), each of which is the same irrespective of the sequence of inputs previously given called a channel.6 Each channel is convolved with a distinct to the network. 5 Note: the structured sparsity in CONV layers is orthogonal to the sparsity In contrast, recurrent neural networks (RNNs), of which that occurs from network pruning as described in Section VII-B2. Long Short-Term Memory networks (LSTMs) [38] are a 6 For example, an input image (feature map) to the first layer of a CNN will popular variant, have internal memory to allow long-term contain three channels that correspond to the red, green and blue components dependencies to affect the output. In these networks, some of the input image. Feed Forward
Recurrent
Fully-Connected
Sparsely-Connected
7
input fmap
output fmap an output activation
filter (weights) H
R
E
S
W
Element-wise Multiplication
F
Partial Sum (psum) Accumulation
Shape Parameter N M C H/W R/S E/F
Description batch size of 3-D fmaps # of 3-D filters / # of ofmap channels # of ifmap/filter channels ifmap plane height/width filter plane height/width (= H or W in FC) ofmap plane height/width (= 1 in FC) TABLE I S HAPE PARAMETERS OF A CONV/FC LAYER .
(a) 2-D convolution in traditional image processing Input fmaps
O, I, W and B are the matrices of the ofmaps, ifmaps, filters and biases, respectively. U is a given stride size. Fig. 9(b) M C shows a visualization of this computation (ignoring biases). H To align the terminology of CNNs with the generic DNN, E R 1 1 1 • filters are composed of weights (i.e., synapses) S W F • input and output feature maps (ifmaps, ofmaps) are composed of activations (i.e., input and output neurons) M C C From five [3] to more than a thousand [15] CONV layers are commonly used in recent CNN models. A small number, R E M e.g., 1 to 3, of fully-connected (FC) layers are typically applied H N S after the CONV layers for classification purposes. A FC layer N F also applies filters on the ifmaps as in the CONV layers, but W the filters are of the same size as the ifmaps. Therefore, it (b) High dimensional convolutions in CNNs does not have the weight sharing property of CONV layers. Eq. (1) still holds for the computation of FC layers with a Fig. 9. Dimensionality of convolutions. few additional constraints on the shape parameters: H = R, F = S, E = F = 1, and U = 1. Modern Deep CNN: 5 – 1000 Layers 1 – 3 Layers In addition to CONV and FC layers, various optional layers Mid-Level Low-Level High-Level Class CONV CONV CONV FC can be found in a DNN such as the non-linearity, pooling, Features Features Features Layer Layer Layer Layer Scores and normalization. The function and computations for each of these layers are discussed next. 1) Non-Linearity: A non-linear activation function is typiNormaliza'on Convolu'on Non-linearity Pooling Fully Non-linearity Connected cally applied after each CONV or FC layer. Various non-linear × × functions are used to introduce non-linearity into the DNN as shown in Fig. 11. These include historically conventional nonOptional linear functions such as sigmoid or hyperbolic tangent as well as rectified linear unit (ReLU) [40], which has become popular Fig. 10. Convolutional Neural Networks. in recent years due to its simplicity and its ability to enable fast training. Variations of ReLU, such as leaky ReLU [41], 2-D filter from the stack of filters, one for each channel; this parametric ReLU [42], and exponential LU [43] have also been stack of 2-D filters is often referred to as a single 3-D filter. explored for improved accuracy. Finally, a non-linearity called The results of the convolution at each point are summed across maxout, which takes the max value of two intersecting linear all the channels. In addition, a 1-D bias can be added to the functions, has shown to be effective in speech recognition filtering results, but some recent networks [15] remove its tasks [44, 45]. 2) Pooling: A variety of computations that reduce the usage from parts of the layers. The result of this computation dimensionality of a feature map are referred to as pooling. is the output activations that comprise one channel of output Pooling, which is applied to each channel separately, enables feature map (ofmap). Additional 3-D filters can be used on the network to be robust and invariant to small shifts and the same input to create additional output channels. Finally, distortions. Pooling combines, or pools, a set of values in multiple input feature maps may be processed together as a its receptive field into a smaller number of values. It can be batch to potentially improve reuse of the filter weights. configured based on the size of its receptive field (e.g., 2×2) Given the shape parameters in Table I, the computation of and pooling operation (e.g., max or average), as shown in a CONV layer is defined as Fig. 12. Typically pooling occurs on non-overlapping blocks (i.e., the stride is equal to the size of the pooling). Usually a C−1 X S−1 X R−1 X O[z][u][x][y] = B[u] + I[z][k][U x + i][U y + j] × W[u][k][i][j], stride of greater than one is used such that there is a reduction k=0 i=0 j=0 in the dimension of the representation (i.e., feature map). 0 ≤ z < N, 0 ≤ u < M, 0 ≤ x < F, 0 ≤ y < E, 3) Normalization: Controlling the input distribution across E = (H − R + U )/U, F = (W − S + U )/U. layers can help to significantly speed up training and improve (1) Output fmaps
…
…
C
…
…
Filters
8
available for download; the DNN models are summarized in Table II. Two results for top-5 error results are reported. In the Traditional first row, the accuracy is boosted by using multiple crops from 0 0 Non-Linear the image and an ensemble of multiple trained models (i.e., Activation -1 -1 the DNN needs to be run several times); these results were Functions 0 1 0 1 -1 -1 used to compete in the ImageNet Challenge. The second row y=1/(1+e-x) y=(ex-e-x)/(ex+e-x) reports the accuracy if only a single crop was used (i.e., the Rectified Linear Unit Exponential LU Leaky ReLU (ReLU) DNN is run only once), which is more consistent with what 1 1 1 would likely be deployed in real-time and/or energy-constrained Modern applications. Non-Linear 0 0 0 LeNet [11] was one of the first CNN approaches introduced Activation Functions in 1989. It was designed for the task of digit classification in -1 -1 -1 0 1 0 1 0 1 -1 -1 -1 grayscale images of size 28×28. The most well known version, x, x≥0 y= y=max(0,x) y=max(αx,x) α(e x-1), LeNet-5, contains two CONV layers and two FC layers [48]. x 1) neighbor PEs is going to cost 1 or 2 orders of magnitude Input Fmaps Filters lower energy than from DRAM. Input Fmap Input Fmap Filter Filter Accelerators can be designed to support specialized process1 1 ing dataflows that leverage this memory hierarchy. The dataflow decides what data gets read into which level of the memory 2 hierarchy and when are they getting processed. Since there is 2 no randomness in the processing of DNNs, it is possible to Activations Reuse: Reuse: Activations Reuse: Filter weights design a fixed dataflow that can adapt to the DNN shapes and Filter weights sizes and optimize for the best energy efficiency. The optimized dataflow minimizes access from the more energy consuming levels of the memory hierarchy. Large memories that can store Fig. 23. Data reuse opportunities in DNNs [82]. a significant amount of data consume more energy than smaller memories. For instance, DRAM can store gigabytes of data, but consumes two orders of magnitude higher energy per access can be achieved by the local memory hierarchy, the 3000M than a small on-chip memory of a few kilobytes. Thus, every DRAM accesses in AlexNet can be reduced to only 61M. time a piece of data is moved from an expensive level to a The operation of DNN accelerators is analogous to that of lower cost level in terms of energy, we want to reuse that piece general-purpose processors as illustrated in Fig. 24 [83]. In of data as much as possible to minimize subsequent accesses conventional computer systems, the compiler translates the to the expensive levels. The challenge, however, is that the program into machine-readable binary codes for execution storage capacity of these low cost memories are limited. Thus given the hardware architecture (e.g., x86 or ARM); in the we need to explore different dataflows that maximize reuse processing of DNNs, the mapper translates the DNN shape under these constraints. and size into a hardware-compatible computation mapping For DNNs, we investigate dataflows that exploit three forms for execution given the dataflow. While the compiler usually of input data reuse (convolutional, feature map and filter) as optimizes for performance, the mapper optimizes for energy shown in Fig. 23. For convolutional reuse, the same input efficiency. The following taxonomy (Fig. 25) can be used to classify feature map activations and filter weights are used within a given channel, just in different combinations for different the DNN dataflows in recent works [84–95] based on their weighted sums. For feature map reuse, multiple filters are data handling characteristics [82]: applied to the same feature map, so the input feature map 1) Weight stationary (WS): The weight stationary dataflow activations are used multiple times across filters. Finally, for is designed to minimize the energy consumption of reading filter reuse, when multiple input feature maps are processed at weights by maximizing the accesses of weights from the register once (referred to as a batch), the same filter weights are used file (RF) at the PE (Fig. 25(a)). Each weight is read from multiple times across input features maps. DRAM into the RF of each PE and stays stationary for further If we can harness the three types of data reuse by storing accesses. The processing runs as many MACs that use the the data in the local memory hierarchy and accessing them same weight as possible while the weight is present in the RF; multiple times without going back to the DRAM, it can save it maximizes convolutional and filter reuse of weights. The a significant amount of DRAM accesses. For example, in inputs and partial sums must move through the spatial array AlexNet, the number of DRAM reads can be reduced by up to and global buffer. The input fmap activations are broadcast to 500× in the CONV layers. The local memory can also be used all PEs and then the partial sums are spatially accumulated for partial sum accumulation, so they do not have to reach across the PE array. DRAM. In the best case, if all data reuse and accumulation One example of previous work that implement weight
15
Implementation Details (µArch)
E
DNN Accelerator (Processor)
# Output Channels # Output Activations
Notes
Mapping (Binary)
Input Data
Fig. 24. An analogy between the operation of DNN accelerators (texts in black) and that of general-purpose processors (texts in red). Figure adopted from [83].
E
…
…
…
…
M E
…
Parallel Output Region
M
OSC
…
Dataflow, … (Architecture)
M
…
Processed Data
OSB …
DNN Shape and Size (Program)
Mapper (Compiler)
OSA
Execution …
Compilation
E
E
E
Single
Multiple
Multiple
Multiple
Multiple
Single
Targeting CONV layers
Targeting FC layers
Fig. 26. Variations of output stationary [82]. The parallel output region for each variant (i.e., the position of the output activations being computed in parallel) is highlighted in bright red.
each output activation value by fetching the corresponding input activations from neighboring PEs. The PE array implements Psum dedicated networks to pass data horizontally and vertically. Each PE also has data delay registers to keep data around for W0 W1 W2 W3 W4 W5 W6 W7 PE the required amount of cycles. At the system level, the global Weight buffer streams the input activations and broadcasts the weights (a) Weight Stationary into the PE array. The partial sums are accumulated inside each PE and then get streamed out back to the global buffer. Global Buffer Act Weight Other examples of output stationary are found in [90, 92]. There are multiple possible variants of output stationary as P0 P1 P2 P3 P4 P5 P6 P7 PE shown in Fig. 26 since the output activations that get processed Psum at the same time can come from different dimensions. For (b) Output Stationary example, the variant OSA targets the processing of CONV layers, and therefore focuses on the processing of output Global Buffer activations from the same channel at a time in order to Weight maximize data reuse opportunities. The variant OSC targets Act the processing of FC layers, and focuses on generating output PE Psum activations from all different channels, since each channel only has one output activation. The variant OSB is something in (c) No Local Reuse between OSA and OSC . Example of variants OSA , OSB , and Fig. 25. Dataflows for DNNs [82]. OSC are [91], [90], and [92], respectively. 3) No local reuse (NLR): While small register files are stationary dataflow is nn-X, or neuFlow [87], which uses efficient in terms of energy (pJ/bit), they are inefficient in terms eight 2-D convolution engines for processing a 10×10 filter. of area (µm2 /bit). In order to maximize the storage capacity, There are total 100 MAC units, i.e. PEs, per engine with each and minimize the off-chip memory bandwidth, no local storage PE having a weight that stays stationary for processing. The is allocated to the PE and instead all that area is allocated input fmap activations are broadcast to all MAC units and the to the global buffer to increase its capacity (Fig. 25(c)). The partial sums are accumulated across the MAC units. In order to no local reuse dataflow differs from the previous dataflows in accumulate the partial sums correctly, additional delay storage that nothing stays stationary inside the PE array. As a result, elements are required, which are counted into the required size there will be increased traffic on the spatial array and to the of local storage. Other weight stationary examples are found global buffer for all data types. Specifically, it has to multicast the activations, single-cast the filter weights, and then spatially in [84–86, 88, 89]. 2) Output stationary (OS): The output stationary dataflow is accumulate the partial sums across the PE array. designed to minimize the energy consumption of reading and In an example of the no local reuse dataflow from writing the partial sums (Fig. 25(b)). It keeps the accumulation UCLA [93], the filter weights and input activations are read of partial sums for the same output activation value local in the from the global buffer, processed by the MAC units with custom RF. In order to keep the accumulation of partial sums stationary adder trees that can complete the accumulation in a single cycle, in the RF, one common implementation is to stream the input and the resulting partial sums or output activations are then put activations across the PE array and broadcast the weight to all back to the global buffer. Another example is DianNao [94], PEs in the array. which also reads input activations and filter weights from One example that implements the output stationary dataflow the buffer, and processes them through the MAC units with is ShiDianNao [91], where each PE handles the processing for custom adder trees. However, DianNao implements specialized Global Buffer Act
16
Input Fmap
Filter a b c
a b c d e
*
=
Reg File
Partial Sums
Filter
a b c
a b c
PE
c b a
a b c d e
Partial Sums
Filter
a b c
a b c
=
Reg File
PE
e
(a) Step 1
b
(b) Step 2
*
Row 1
Partial Sums
a b c d e
=
Row 2
Row 3
a b c
PE 1
Row 1
PE
*
Row 1
Row 2
*
Row 2
Row 3
*
Row 3
c b a
d c b a
a
Input Fmap
Reg File
c b a
c b a e d
Input Fmap
*
e d c
PE 4
Row 1
*
Row 2
Row 2
*
Row 3
Row 3
*
Row 4
PE 2
b a c
(c) Step 3
registers to keep the partial sums in the PE array, which helps to further reduce the energy consumption of accessing partial sums. Another example of no local reuse dataflow is found in [95]. 4) Row stationary (RS): A row stationary dataflow is proposed in [82], which aims to maximize the reuse and accumulation at the RF level for all types of data (weights, pixels, partial sums) for the overall energy efficiency. This differs from WS or OS dataflows, which optimize for only weights and partial sums, respectively. The row stationary dataflow assigns the processing of a 1-D row convolution into each PE for processing as shown in Fig. 27. It keeps the row of filter weights stationary inside the RF of the PE and then streams the input activations into the PE. The PE does the MACs for each sliding window at a time, which uses just one memory space for the accumulation of partial sums. Since there are overlaps of input activations between different sliding windows, the input activations can then be kept in the RF and get reused. By going through all the sliding windows in the row, it completes the 1-D convolution and maximize the data reuse and local accumulation of data in this row. With each PE processing a 1-D convolution, multiple PEs can be aggregated to complete the 2-D convolution as shown in Fig. 28. For example, to generate the first row of output activations with a filter having three rows, three 1-D convolutions are required. Therefore, we can use three PEs in a column, each running one of the three 1-D convolutions. The partial sums are further accumulated vertically across the three PEs to generate the first output row. To generate the second row of output, we use another column of PEs, where three rows of input activations are shifted down by one row, and use the same rows of filters to perform the three 1-D convolutions. Additional columns of PEs are added until all rows of the output are completed (i.e., the number of PE columns equals the number of output rows). This 2-D array of PEs enables other forms of reuse to reduce accesses to the more expensive global buffer. For example, each filter row is reused across multiple PEs horizontally. Each row of input activations is reused across multiple PEs diagonally. And each row of partial sums are further accumulated across the PEs vertically. Therefore, 2-D convolutional data reuse and accumulation are maximized inside the 2-D PE array. To address the high-dimensional convolution of the CONV layer (i.e., multiple fmaps, filters, and channels), multiple rows can be mapped onto the same PE as shown in Fig. 29. The 2-D convolution is mapped to a set of PEs, and the additional dimensions are handled by interleaving or concatenating the
*
*
Row 3
Row 2
*
Row 4
Row 3
*
Row 5
PE 5
PE 3
Fig. 27. 1-D Convolutional reuse within PE for Row Stationary Dataflow [82].
PE 7
Row 1
PE 8
PE 6
*
=
PE 9
*
=
=
Fig. 28. 2-D convolutional reuse within spatial array for Row Stationary Dataflow [82].
PE
Row 1
*
Row 1
Row 2
*
Row 2
Row 3
*
Row 3
PE
Row 1
*
Row 2
Row 2
*
Row 3
Row 3
*
Row 4
PE
Row 4
Row 3 *
Row 5
PE
PE
Image Fmap 1 & 2
*
Psum 1 & 2
=
Filter 1 & 2
Filter 1
Multiple channels:
Row 2 * PE
Filter 1
Multiple filters:
Row 3
PE
PE
Multiple fmaps:
PE
Row 1 *
Image Fmap 1
* *
Psum 1 & 2
= Fmap 1 Image
Psum
=
Fig. 29. Multiple rows of different input feature maps, filters and channels are mapped to same PE within array for additional reuse in the Row Stationary Dataflow [82].
additional data. For filter reuse within the PE, different rows of fmaps are concatenated and run through the same PE as a 1-D convolution. For input fmap reuse within the PE, different filter rows are interleaved and run through the same PE as a 1-D convolution. Finally, to increase local partial sum accumulation within the PE, filter rows and fmap rows from different channels are interleaved, and run through the same PE as a 1-D convolution. The partial sums from different channels then naturally get accumulated inside the PE. The number of filters, channels, and fmaps that can be processed at the same time is programmable, and there exists an optimal mapping for the best energy efficiency, which depends on the shape configuration of the DNN as well as the hardware resources provided, e.g., the number of PEs and the size of the memory in the hierarchy. Since all of the variables are known before runtime, it is possible to build a compiler (i.e., mapper) to perform this optimization off-line to configure the hardware for different mappings of the RS dataflow for different DNNs as shown in Fig. 30. One example that implements the row stationary dataflow is Eyeriss [96]. It consists of a 14×12 PE array, a 108KB global buffer, ReLU and fmap compression units as shown in Fig. 31. The chip communicates with the off-chip DRAM using a 64-bit bidirectional data bus to fetch data into the global buffer. The global buffer then streams the data into the PE array for processing.
17
CNN Configurations
Replication
C
H
1
…
…
E
27
AlexNet Layer 2 5
.. .. ..
..
N
N
.. .. ..
.. ..
E
H
R
AlexNet Layer 3-5 3
..
M
Optimization Compiler
.. ..
R
1 H
C
C
13
E
1 R
…
R
Folding
M
C
E
H
Hardware Resources
Row Stationary Mapping PE
Global Buffer ALU
ALU
ALU
ALU
ALU
ALU
ALU
ALU
Row 1
*
Row 1
Row 2
*
Row 2
Row 3
*
Row 3
PE
Row 1
*
Row 2
Row 2
*
Row 3
Row 3
*
PE
PE
ALU
ALU
ALU
ALU
Multiple fmaps:
ALU
ALU
ALU
ALU
Multiple filters:
Row 4
Row 3 *
Row 5
PE
Row 4
*
Filter 1
Psum 1 & 2
= Image Fmap 1
*
3
13
3
13
3
13
3
13
Psum 1 & 2
= Fmap 1 Image
*
Psum
=
12
Physical PE Array Fig. 30. Mapping optimization takes in hardware and DNNs shape constraints to determine optimal energy dataflow [82].
Link Clock
Core Clock
Top-Level Control Filter
Configuration Bits
Config Scan Chain Filter
14
PE
Image Fmap 1 & 2
Filter 1 & 2
Multiple channels:
Row 3
Row 2 * PE
Filter 1
14
PE
Row 1 * PE
Accelerator 12✕14 PE Array
Processing Element
Unused PEs are Clock Gated
12
5 5
14 13
Physical PE Array
Fig. 32. Mapping uses replication and folding to maximized utilization of PE array [96].
a shared memory (global buffer) is on the order of 100 – 500kB. The sizes of these memories are selected to be comparable to Off-Chip Psum DRAM … 64 a typical accelerator for multimedia processing, such as video 108KB bits Psum coding [97]. The memory sizes are further adjusted for the … needs of each dataflow under the same area constraint. For example, since the no local reuse dataflow does not require any Fig. 31. Eyeriss DNN accelerator [96]. RF in PE, it is allocated with a much larger global buffer. The simulation uses the layer configurations from AlexNet with a batch size of 16. The simulation also takes into account the In order to support the RS dataflow, two problems need to be fact that accessing different levels of the memory hierarchy solved in the hardware design. First, how can the fixed-size PE requires different energy cost. Fig. 33 compares the chip and DRAM energy consumption array accommodate different layer shapes? Second, although the data will be passed in a very specific pattern, it still changes of each dataflow for the CONV layers of AlexNet with a with different shape configurations. How can the fixed design batch size of 16. The WS and OS dataflows have the lowest energy consumption for accessing weights and partial sums, pass data in different patterns? Two mapping strategies can be used to solve the first problem respectively. However, the RS dataflow has the lowest total as shown in Fig. 32. First, replication can be used to map shapes energy consumption since it optimizes for the overall energy that do not use up the entire PE array. For example, in the efficiency instead of only for a certain data type. third to fifth layers of AlexNet, each 2-D convolution only uses Fig. 33(a) shows the same results with breakdown in terms of a 13×3 PE array. This structure is then replicated four times, memory hierarchy. The RS dataflow consumes the most energy and runs different channels and filters in each replication. The in the RF, since by design most of the accesses have been second strategy is called folding. For example, in the second moved to the lowest level of the memory hierarchy. This helps layer of AlexNet, it requires a 27×5 PE array to complete the to achieve the lowest total energy consumption since RF has 2-D convolution. In order to fit it into the 14×12 physical PE the lowest energy per access. The NLR dataflow has the lowest array, it is folded into two parts, 14×5 and 13×5, and each energy consumption at the DRAM level, since it has a much are vertically mapped into the physical PE array. Since not all larger global buffer and thus higher on-chip storage capacity PEs are used by the mapping, the unused PEs can be clock compared to others. However, most of the data accesses in gated to save energy consumption. the NLR dataflow is from the global buffer, which still has a A custom multicast network is used to solve the second relatively large energy consumption per access compared to problem about flexible data delivery. The simplest way to pass accessing data from RF or inside the PE array. As a result, the data to multiple destinations is to broadcast the data to all PEs overall energy consumption of the NLR dataflow is still fairly and let each PE decide if it has to process the data or not. high. Overall, RS dataflow uses 1.4× to 2.5× lower energy However, it is not very energy efficient especially when the than other dataflows. size of PE array is large. Instead, a multicast network is used Fig. 34 shows the energy efficiency between different to send data to only the places where it is needed. dataflows in the FC layers of AlexNet with a batch size of 16. 5) Energy comparison of different dataflows: To evaluate Since there is not as much data reuse in the FC layers as in and compare different dataflows, the same total hardware area the CONV layers, all dataflows spend a significant amount of and number of PEs (256) are used in the simulation of a spatial energy on reading weights. However, RS dataflow still has the architecture for all dataflows. The local memory (register file) at lowest energy consumption because it optimizes for the energy each processing element (PE) is on the order of 0.5 – 1.0kB and of accessing input activations and partial sums. For the OS Global Ifmap Buffer
Spad MAC Control
…
…
…
Ifmap RLC Decoder Ofmap ReLU RLC Enc.
…
18
80%
1.5
Normalized Energy/MAC
NoC
Normalized Energy
buffer
(1 MAC = 1)
DRAM 0.5
20%
1.5e10
RF
1
ALU RF NoC
1.0e10
buffer DRAM
0.5e10
ALU 0
0
Total Energy
2.0e10
2
WS
OSA
OSB
OSC
NLR
RS
L1
L2
L3
L4
CONV Layers
DNN Dataflows
RF dominates
L5
L6
L7
L8
FC Layers
DRAM dominates
(a) Energy breakdown across memory hierarchy Fig. 35. Energy breakdown across layers of the AlexNet [82]. RF energy dominates in convolutional layers. DRAM energy dominates in the fully connected layer. Convolutional layer dominate energy consumption.
2 1.5
Normalized Energy/MAC
psums weights
1
pixels 0.5 0
WS
OSA
OSB
OSC
NLR
RS
DNN Dataflows (b) Energy breakdown across data type Fig. 33. Comparison of energy efficiency between different dataflows in the CONV layers of AlexNet with a batch size of 16 [3]: (a) breakdown in terms of storage levels and ALU, (b) breakdown in terms of data types. OSA , OSB and OSC are three variants of the OS dataflow that are commonly seen in different implementations [82].
2 1.5
Normalized Energy/MAC
psums weights
1
pixels 0.5 0
WS
OSA
OSB
OSC
NLR
RS
DNN Dataflows Fig. 34. Comparison of energy efficiency between different dataflows in the FC layers of AlexNet with a batch size of 16 [82].
dataflows, OSC now consumes lower energy than OSA since it is designed for the FC layers. Overall, RS still consumes 1.3× lower energy compared to other dataflows at the batch size of 16. Fig. 35 shows the RS dataflow design with energy breakdown in terms of different layers of AlexNet. In the CONV layers, the energy is mostly consumed by the RF, while in the FC layers, the energy is mostly consumed by DRAM. However, most of the energy is consumed by the CONV layers, which takes around 80% of the energy. As recent DNN models go deeper
with more CONV layers, the ratio between number of CONV and FC layers only gets larger. Therefore, moving forward, significant effort should be placed on energy optimizations for CONV layers. Finally, up until now, we have been looking at architectures with relatively limited storage on the order of a few hundred kilobytes. With much larger storage on the order of a few megabytes, additional dataflows can be considered. For example, Fused-Layer looks at dataflow optimizations across layers [98]. VI. N EAR -DATA P ROCESSING The previous section highlighted that data movement dominates energy consumption. While spatial architectures distribute the on-chip memory such that it is closer to the computation (e.g., into the PE), there have also been efforts to bring the off-chip high density memory closer to the computation or to integrate the computation into the memory itself; the latter is often referred to as processing-in-memory or logic-in-memory. In embedded systems, there have also been efforts to bring the computation into the sensor where the data is first collected. In this section, we will discuss how moving compute and data closer to reduce data movement (i.e., near-data processing) can be achieved using mixed-signal circuit design and advanced memory technologies. Many of these works use analog processing which has the drawback of increased sensitivity to circuit and device nonidealities. Consequentially, the computation is often performed at reduced precision, which can be accounted for during the training of the DNNs using the techniques discussed in Section VII. Another factor to take into consideration is that DNNs are often trained in the digital domain; thus for analog processing, there is an additional overhead cost for analogto-digital conversion (ADC) and digital-to-analog conversion (DAC). A. DRAM Advanced memory technology can reduce the access energy for high density memories such as DRAMs. For instance,
19
embedded DRAM (eDRAM) brings high density memory onWLDAC V1 chip to avoid the high energy cost of switching off-chip code capacitance [99]; eDRAM is 2.85× higher density than SRAM G1 and 321× more energy efficient than DRAM (DDR3) [95]. IBC I1 = V1×G1 eDRAM also offers higher bandwidth and lower latency V compared to DRAM. In DNN processing, eDRAM can be used 2 ΔV G2 Ideal transfer curve to store tens of megabytes of weights and activations on-chip Standard Deviation to avoid off-chip access, as demonstrated in DaDianNao [95]. 0.06 (from Monte Carlo simulations) The downside of eDRAM is that it has lower density than I2 = V2×G2 0.04 off-chip DRAM and can increase the cost of the chip. 0.02 Rather than integrating DRAM into the chip itself, the Nominal transfer curve DRAM can also be stacked on top of the chip using through I = I1 + I2 0 5 10 15 20 25 30 35 silicon vias (TSV). This technology is often referred to as = V WLDAC Code 1×G1 + V2×G2 3-D memory, and has been commercialized in the form of Hybrid Memory Cube (HMC) [100] and High Bandwidth (a) Multiplication performed by bit-cell (b) Gi is conductance of resistive (Figure from [104]) memory (Figure from [106]) Memory (HBM) [101]. 3-D memory delivers an order of magnitude higher bandwidth and reduces access energy by Fig. 36. Analog computation by (a) SRAM bit-cell and (b) non-volatile up to 5× relative to existing 2-D DRAMs, as TSV have lower resistive memory. capacitance than typical off-chip interconnects. Recent works have explored the use of HMC for efficient DNN processing referred to as memristors [107]. Specifically, a multiplication in a variety of ways. For instance, Neurocube [102] integrates is performed with the resistor’s conductance as the weight, the SIMD processors into the logic die of the HMC to bring voltage as the input, and the current as the output as shown in the memory and computation closer together. Tetris [103] Fig. 36(b). The addition is done by summing the currents of explores the use of HMC with the Eyeriss spatial architecture different memristors with Kirchhoff’s current law. This is the and row stationary dataflow. It proposes allocating more area ultimate form of a weight stationary dataflow, as the weights to computation than on-chip memory (i.e., larger PE array are always held in place. The advantages of this approach and smaller global buffer) in order to exploit the low energy include reduced energy consumption since the computation and high throughput properties of the HMC. It also adapts is embedded within memory which reduces data movement, the dataflow to account for the HMC memory and smaller and increased density since memory and computation can be on-chip memory. Tetris achieves a 1.5× reduction in energy densely packed with a similar density to DRAM [108].8 consumption and 4.1× increase in throughput over a baseline There are several popular candidates for non-volatile resistive system with conventional 2-D DRAM. memory devices including phase change memory (PCM), resistive RAM (RRAM or ReRAM), conductive bridge RAM B. SRAM (CBRAM), and spin transfer torque magnetic RAM (STTRather than bringing the memory near the compute, recent MRAM) [109]. These devices have different trade-offs in terms work has also investigated bringing the compute into the of endurance (i.e., how many times it can be written), retention memory. For instance, the multiply and accumulate operation time, write current, density (i.e., cell size), variations and speed. Processing with non-volatile resistive memories has several can be directly integrated into the bit-cells of an SRAM array [104], as shown in Fig. 36(a). In this work, a 5-bit drawbacks as described in [110]. First, it suffers from the DAC is used to drive the word line (WL) to an analog voltage reduced precision and ADC/DAC overhead of analog processthat represents the feature vector, while the bit-cells store the ing described earlier. Second, the array size is limited by the binary weights ±1. The bit-cell current (IBC ) is effectively wires that connect the resistive devices; specifically, wire energy a product of the value of the feature vector and the value of dominates for large arrays (e.g., 1k×1k), and the IR drop along the weight stored in the bit-cell; the currents from the bit- wire can degrade the read accuracy. Third, the write energy cells within a column add together to discharge the bitline to program the resistive devices can be costly, in some cases (VBL ). This approach gives 12× energy savings compared to requiring multiple pulses. Finally, the resistive devices can also reading the 1-bit weights from the SRAM and performing the suffer from device-to-device and cycle-to-cycle variations with computation separately. To counter circuit non-idealities, the non-linear conductance across the conductance range. DAC accounts for the non-linear bit-line discharge with respect There have been several recent works that explore the use of to the WL voltage, and boosting is used to combine the weak memristors for DNNs. ISAAC [106] replaces the eDRAM in classifiers that are susceptible to device variations to form a DaDianNao with memristors. To address the limited precision strong classifier [105]. support, ISAAC computes a 16-bit dot product operation with 8 memristors each storing 2-bits; a 1-bit×2-bit multiplication is performed at each memristor, where a 16-bit input requires C. Non-volatile Resistive Memories 16 cycles to complete. In other words, the ISAAC architecture The multiply and accumulate operation can also be directly integrated into advanced non-volatile high density memories 8 The resistive devices can be inserted between the cross-point of two wires by using them as programmable resistive elements, commonly and in certain cases can avoid the need for an access transistor.
ΔVBL (V)
BL
20
trades off area and time for increased precision. Finally, ISAAC arranges its 25.1M memristors in a hierarchical structure to avoid issues with large arrays. PRIME [111] also replaces the DRAM main memory with memristors; specifically, it uses 256×256 memristor arrays that can be configured for 4-bit multi-level cell computation or 1-bit single level cell storage. It should be noted that results from ISAAC and PRIME are obtained from simulations. The task of actually fabricating large memristors arrays is still very much a research challenge; for instance, [112] uses a fabricated 12×12 memristor array to demonstrate a linear classifier.
hardware. Note that unlike Section V, the techniques discussed in this section can affect the accuracy; thus, the goal is to not only substantially reduce energy consumption and increase throughput, but also to minimize any degradation in accuracy. The co-design approaches can be loosely grouped into the following categories: • Reduce precision of operations and operands. This includes going from floating point to fixed point, reducing the bitwidth, non-linear quantization and weight sharing. • Reduce number of operations and model size. This includes techniques such as compression, pruning and compact network architectures.
D. Sensors In certain applications, such as image processing, the data movement from the sensor itself can account for a significant portion of the system energy consumption. Thus there has also been research on performing the computation as close as possible to the sensor. In particular, much of the work focuses on moving the computation into the analog domain to avoid using the ADC within the sensor, which accounts for a significant portion of the sensor power. However, as mentioned earlier, lower precision is required for analog computation due to circuit non-idealities. In [113], the matrix multiplication is integrated into the ADC, where the most significant bits of the multiplications are performed using switched capacitors in an 8-bit successive approximation format. This is extended in [114] to not only perform the multiplications, but also the accumulations in the analog domain. In this work, it is assumed that 3-bits and 6-bits are sufficient to represent the weights and activations, respectively. This reduces the number of ADC conversions in the sensor by 21×. RedEye [115] takes this approach even further by performing the entire convolution layer (including convolution, max pooling and quantization) in the analog domain at the sensor. It should be noted that [113] and [114] report measured results from fabricated test chips, while results in [115] are from simulations. It is also feasible to embed the computation not just before the ADC, but into the sensor itself. For instance, in [116] an Angle Sensitive Pixels sensor is used to compute the gradient of the input, which along with compression, reduces the data movement from the sensor by 10×. In addition, since the first layer of the DNN often outputs a gradient-like feature map, it maybe possible to skip the computations in the first layer, which further reduces energy consumption as discussed in [117, 118].
A. Reduce Precision
Quantization involves mapping data to a smaller set of quantization levels. The ultimate goal is to minimize the error between the reconstructed data from the quantization levels and the original data. The number of quantization levels reflects the precision and ultimately the number of bits required to represent the data (usually log2 of the number of levels); thus, reduced precision refers to reducing the number of levels, and thus the number of bits. The benefits of reduced precision include reduced storage cost and/or reduced computation requirements. There are several ways to map the data to quantization levels. The simplest method is a linear mapping with uniform distance between each quantization level (Fig. 37(a)). Another approach is to use a simple mapping function such as a log function (Fig. 37(b)) where the distance between the levels varies; this mapping can often be implemented with simple logic such as a shift. Alternatively, a more complex mapping function can be used where the quantization levels are determined or learned from the data (Fig. 37(c)), e.g., using k-means clustering; for this approach, the mapping is usually implemented with a look up table. Finally, the quantization can be fixed (i.e., the same method of quantization is used for all data types and layers, filters, and channels in the network); or it can be variable (i.e., different methods of quantization can be used for weights and activations, and different layers, filters, and channels in the network). Reduced precision research initially focused on reducing the precision of the weights rather than the activations, since weights directly increase the storage capacity requirement, while the impact of activations on storage capacity depends on the network architecture and dataflow. However, more recent works have also started to look at the impact of quantization on activations. Most reduced precision research also focuses on reducing the precision for inference rather than training VII. C O - DESIGN OF DNN MODELS AND H ARDWARE (with some exceptions [90, 121, 122]) due to the sensitivity of In earlier work, the DNN models were designed to maximize the gradients to quantization. The key techniques used in recent work to reduce precision accuracy without much consideration of the implementation complexity. However, this can lead to designs that are chal- are summarized in Table III; both linear and non-linear lenging to implement and deploy. To address this, recent quantization applied to weights and activations are explored. work has shown that DNN models and hardware can be co- The impact on accuracy is reported relative to a baseline designed to jointly maximize accuracy and throughput, while precision of 32-bit floating point, which is the default precision minimizing energy and cost, which increases the likelihood of used on platforms such as GPUs and CPUs. adoption. In this section, we will highlight various efforts that 1) Linear quantization: The first step of reducing precision have been made towards the co-design of DNN models and is usually to convert values and operations from floating point
21
2N+M-bits
Weight (N-bits) 2N-bits Activation (N-bits)
Fig. 39. (a) Linear Quantization
+
Accumulate
Quantize to N-bits
Output (N-bits)
NxN multiply
Reducing the precision of multiply and accumulate (MAC).
(b) Log Quantization •
(c) Non-Linear Quantization
approximately linearly with the number of bits. An 8-bit fixed point multiply consumes 15.5× less energy (12.4× less area) than a 32-bit fixed point multiply, and 18.5× less energy (27.5× less area) than a 32-bit floating point multiply. The energy and area of a fixedpoint multiply scales approximately quadratically with the number of bits.
Reducing the precision also reduces the energy and area cost for storage, which is important since memory access and data movement dominate energy consumption as described earlier. sign exponent (8-bits) mantissa (23-bits) The energy and area of the memory scale approximately linearly sign exponent (8-bits) mantissa (23-bits) 32-bit float 10100101000000000101000000000100 with number of bits. It should be noted, however, that changing 32-bit float -1.42122425 x 10 s 1= 0 1 1 0e0= 1700 1 0 0 0 0 0 0 0 0 0 1m0= 120482 000000000100 from floating point to fixed point, without reducing bit-width, -1.42122425 x 10 s=1 e = 70 m = 20482 (a) 32-bit floating point example does not reduce the energy or area cost of the memory. For completeness, it should be noted that the precision of sign mantissa (7-bits) sign mantissa (7-bits) the internal values of a fixed-point multiply and accumulate 01100110 0 1100110 8-bit 8-bit (MAC) operation are typically higher than the weights and dynamic dynamic integer fractional fractional activations. To guarantee no precision loss, weights and input fixed fixed ([7-f ]-bits) (f-bits) (f-bits) activations with N-bit fixed-point precision would require an 12.75 s=0 m=102 f = 3 0.19921875 s=0 m=102 f = 9 N-bit×N-bit multiplication which generates a 2N-bit output (b) 8-bit dynamic fixed point examples product; that output would need to be accumulated with 2N+Mbit precision, where M is determined based on the largest filter Fig. 38. Various methods of number representations. size log2 (C × R × S from Fig. 9(b)), which is in the range of 10 to 16 bits for the popular DNNs described in Section III-B. to fixed point. A 32-bit floating point number, as shown in After accumulation, the precision of the final output activation Fig. 38(a), is represented by (−1)s × m × 2(e−127) , where s is typically reduced to N-bits [90, 123], as shown in Fig. 39. is the sign bit, e is the 8-bit exponent, and m is the 23-bit The reduced output precision does not have a significant impact mantissa, and covers the range of 10−38 to 1038 . on accuracy if the distribution of the weights and activations An N-bit fixed point number is represented by (−1)s × m × are centered near zero such that the accumulation would not 2−f , where s is the sign bit, m is the (N-1)-bit mantissa, and move only in one direction; this is particularly true when batch f determines the location of the decimal point and acts as a normalization is used. scale factor. For instance, for an 8-bit integer, when f = 0, The reduced precision is not only explored in research, the dynamic range is -128 to 127, whereas when f = 10, the but has been used in recent commercial platforms for DNN dynamic range is -0.125 to 0.124023438. Dynamic fixed point processing. For instance, Google’s Tensor Processing Unit representation allows f to vary based on the desired dynamic (TPU) which was announced in May 2016, was designed for range as shown in Fig. 38(b). This is useful for DNNs, since 8-bit integer arithmetic [125]. Similarly, Nvidia’s PASCAL the dynamic range of the weights and activations can be quite GPU, which was announced in April 2016, also has 8-bit different. In addition, the dynamic range can also vary across integer instructions for deep learning inference [126]. In general layers and layer types (e.g., convolutional vs. fully connected). purpose platforms such as CPUs and GPUs, the main benefit Using dynamic fixed point, the bitwidth can be reduced to 8 of using 8-bit computation is an increase in throughput, as bits for the weights and 10 bits for the activations without any four 8-bit operations rather than one 32-bit operation can be fine-tuning of the weights [123]; with fine-tuning, both weights performed for a given clock cycle. and activations can reach 8-bits [124]. While general purpose platforms usually support 8-bit, Using 8-bit fixed point has the following impact on energy 16-bit and/or 32-bit operations, it has been shown that the and area [81]: minimum bit precision for DNNs can actually vary in a more • An 8-bit fixed point add consumes 3.3× less energy fine grained manner. For instance, the weight and activation (3.8× less area) than a 32-bit fixed point add, and 30× precision can vary between 4 and 9 bits for AlexNet across less energy (116× less area) than a 32-bit floating point different layers without significant impact on accuracy (i.e., a add. The energy and area of a fixed-point add scales change of less than 1%) [127, 128]. This fine-grained variation Fig. 37. Various methods of quantization (Figures from [119, 120]).
-13
-13
22
can be exploited for increased throughput or reduced energy consumption with specialized hardware. For instance, if bitserial processing is used, where the number of clock cycles to complete an operation is proportional to the bitwidth, adapting to fine-grain variations in bit precision can result in a 2.24× speed up versus 16-bits [127]. Alternatively, a multiplier can be designed such that its critical path reduces based on the bit precision as fewer adders are needed to resolve the product; this can be combined with voltage scaling for a 2.56× energy savings versus 16-bits [128]. While these bit scaling results are reported relative to 16-bit, it would be interesting to see their impact relative to the maximum precision required across layers (i.e., 9-bits for [127, 128]). The precision can be reduced even more aggressively to a single bit; this area of research is often referred to as binary nets. BinaryConnect (BC) [129] introduced the concept of binary weights (i.e., -1 and 1), where using a binary weight reduced the multiplication in the MAC to addition and subtraction only. This was later extended in Binarized Neural Networks (BNN) [130] that uses binary weights and activations, which reduces the MAC to an XNOR. However, BC and BNN have an accuracy loss of 19% and 29.8%, respectively [131]. In order to reduce this accuracy loss, Binary Weight Nets (BWN) and XNOR-Nets introduced several significant modifications to the DNN processing [131]. This includes multiplying the outputs with a scale factor to recover the dynamic range (i.e., the weights effectively become -w and w, where w is the average of the absolute values of the weights in the filter)9 , keeping the first and last layers at 32-bit floating point precision, and performing normalization before convolution to reduce the dynamic range of the activations. With these changes, BWN reduced the accuracy loss to 0.8%, while XNOR-Nets reduced the loss to 11%. The loss of XNORNet can be further reduced by increasing the precision of the activations to be slightly larger than one bit. For instance, Quantized Neural Networks (QNN) [121], DoReFa-Net [122], and HWGQ-Net [132] allow the activations to have 2-bits, while the weights remain at 1-bit; in HWGQ-Net, this reduces the accuracy loss to 5.2%. All the previously described binary nets limit the weights to two values (-w and w); however, there may be benefits for allowing weights to be zero (i.e., -w, 0, w). Although this requires an additional bit per weight compared to binary weights, the sparsity of the weights can be exploited to reduce computation and storage cost, which can potentially cancel out the cost of the additional bit. This is explored in Ternary Weight Nets (TWN) [133] and then extended in Trained Ternary Quantization (TTQ) where a different scale is trained for each weight (i.e., -w1 , 0, w2 ) for an accuracy loss of 0.6% [134], assuming 32-bit floating point for the activations. Hardware implementations for binary/ternary nets have been explored in recent publications. YodaNN [135] uses binary weights, while BRein [136] uses binary weights and activations. Binary weights are also used in the compute in SRAM work [104] described in Section VI. Finally, the
nominally spike-inspired TrueNorth chip can implement a reduced precision neural network with binary activations and ternary weights using TrueNorth’s quantized weight table [9]. These works tend not to support state-of-the-art DNN models (with the exception of YodaNN). 2) Non-linear quantization: The previous works described involve linear quantization where the levels are uniformly spaced out. It has been shown that the distributions of the weights and activations are not uniform [120, 137], and thus a non-linear quantization can potentially improve accuracy. Specifically, there have been two popular approaches taken in recent works: (1) log domain quantization; (2) learned quantization or weight sharing. Log domain quantization If the quantization levels are assigned based on a logarithmic distribution as shown in Fig 37(b), the weights and activations are more equally distributed across the different levels and each level is used more efficiently resulting in less quantization error. For instance, using 4 bits in linear quantization results in a 27.8% loss in accuracy versus a 5% loss for log base-2 quantization for VGG-16 [119]. Furthermore, when weights are quantized to powers of two, the multiplication can be replaced with a bitshift [124, 137].10 Incremental Network Quantization (INQ) can be used to further reduce the loss in accuracy by dividing the large and small weights into different groups, and then iteratively quantizing and re-training the weights [138]. Weight Sharing forces several weights to share a single value; this reduces the number of unique weights in a filter or a layer. The weights can be grouped using a hashing function [139] or a k-means algorithm [120], and one value is assigned to each group. A codebook is then built to map each group of weights to its shared value. Accordingly, an index to the corresponding group in the codebook is stored for each position in the filter rather than a weight value. This leads to a two step process to fetch the weight (as shown in Fig. 40): (1) read the group index from the weight memory; (2) using the group index, read the value of the weight from the codebook. This approach can reduce the cost of reading and storing the weights if the bitwidth of the group index (log2 of the number of unique weights) is less than the bitwidth of the weight itself. Finally, rather than having an index for each weight position in the filter, an index can be used for a vector of weight positions in the filter, which reduces the storage cost of the indexes [140]. Deep Compression [120] is an example of weight sharing. The number of unique weights per layer is reduced to 256 for convolutional layers and 16 for fully-connected layers in
9 This can also be thought of as a form of weights sharing, where only two weights are used per filter.
10 Note however that multiplications do not account for a significant portion of the total energy.
Weight Memory CRSM x log2U-bits
Weight Group index index (log2U-bits)
Weight
Weight (16-bits) Codebook U x 16b
Input Activation (16-bits)
Fig. 40.
MAC
Output Activation (16-bits)
Weight sharing hardware.
23
Reduce Precision Method Dynamic Fixed Point
Reduce Weight
Reduce Weight and Activation
Non-linear Quantization
w/o fine-tuning [123] w/ fine-tuning [124] BinaryConnect [129] Binary Weight Network (BWN) [131] Ternary Weight Networks (TWN) [133] Trained Ternary Quantization (TTQ) [134] XNOR-Net [131] Binarized Neural Networks (BNN) [130] DoReFa-Net [122] Quantized Neural Networks (QNN) [121] HWGQ-Net [132] LogNet [137] Incremental Network Quantization (INQ) [138] Deep Compression [120]
bitwidth Weights Activations 8 10 8 8 1 32 (float) 1* 32 (float) 2* 32 (float) 2* 32 (float) 1* 1* 1 1 1* 2* 1 2* 1* 2* 5 (conv), 4 (fc) 4 5 32 (float) 8 (conv), 4 (fc) 16 4 (conv), 2 (fc) 16
Accuracy loss vs. 32-bit float (%) 0.4 0.6 19.2 0.8 3.7 0.6 11 29.8 7.63 6.5 5.2 3.2 -0.2 0 2.6
TABLE III M ETHODS TO REDUCE NUMERICAL PRECISION FOR A LEX N ET. ACCURACY MEASURED FOR T OP -5 ERROR ON I MAGE N ET. *N OT APPLIED TO FIRST AND / OR LAST LAYERS
AlexNet, requiring 8-bit and 4-bit weight indexes, respectively. Assuming there are U unique weights and the size of the filters in the layer is C×R×S×M from Fig. 9(b), there will be energy savings if reading from a CRSM × log2 U -bit memory plus a U ×16-bit memory (as shown in Fig. 40) cost less than reading from a CRSM ×16-bit memory. Note that unlike the previous quantization methods, the weight sharing approach does not reduce the precision of the MAC computation itself and only reduces the weight storage requirement.
ReLU
9 -1 -3 1 -5 5 -2 6 -1
9 0 0 1 0 5 0 6 0
(a) ReLU non-linearity # of activations
# of non-zero activations
1 0.8
B. Reduce Number of Operations and Model Size
0.6
(Normalized) 0.4
In addition to reducing the size of each operation or operand 0.2 (weight/activation), there is also a significant amount of research 0 1 2 3 4 5 on methods to reduce the number of operations and model CONV Layer size. These techniques can be loosely classified as exploiting (b) Distribution of activation after ReLU of AlexNet activation statistics, network pruning, network architecture design and knowledge distillation. Fig. 41. Sparsity in activations due to ReLU. 1) Exploiting Activation Statistics: As discussed in Section III-A1, ReLU is a popular form of non-linearity used in DNNs that sets all negative values to zero as shown in Fig. 41(a). The activations can be made to be even more sparse by prunAs a result, the output activations of the feature maps after the ing the low-valued activations. For instance, if all activations ReLU are sparse; for instance, the feature maps in AlexNet with small values are pruned, this can be translated into an have sparsity between 19% to 63% as shown in Fig. 41(b). additional 11% speed up [141] or 2× power reduction [142] This sparsity gives ReLU an implementation advantage over with little impact on accuracy. Aggressively pruning more other non-linearities such as sigmoid, etc. activations can provide additional throughput improvement at The sparsity can be exploited for energy and area savings a cost of reduced accuracy. using compression, particularly for off-chip DRAM access 2) Network Pruning: To make network training easier, the which is expensive. For instance, a simple run length coding networks are usually over-parameterized. Therefore, a large that involves signaling non-zero values of 16-bits and then runs amount of the weights in a network are redundant and can of zeros up to 31 can reduce the external memory bandwidth be removed (i.e., set to zero). This process is called network of the activations by 2.1× and the overall external bandwidth pruning. Aggressive network pruning often requires some fine11 (including weights) by 1.5× [61]. In addition to compression, tuning of the weights to maintain the original accuracy. This the hardware can also be modified such that it skips reading the was first proposed in 1989 through a technique called Optimal weights and performing the MAC for zero-valued activations Brain Damage [143]. The idea was to compute the impact of to reduce energy cost by 45% [96]. Rather than just gating the each weight on the training loss (discussed in Section II-C), read and MAC computation, the hardware could also skip the referred to as the weight saliency. The low-saliency weights cycle to increase the throughput by 1.37× [141]. were removed and the remaining weights were fine-tuned; this process was repeated until the desired weight reduction and 11 This simple run length compression is within 5-10% of the theoretical entropy limit. accuracy were reached.
24
Hardware Energy Costs of each MAC and Memory Access # acc. at mem. level 1
# of MACs Calculation
CNN Weights and Input Data [0.3, 0, -0.4, 0.7, 0, 0, 0.1, …]
# acc. at mem. level 2 …
Memory Accesses Optimization
Edata
# acc. at mem. level n # of MACs
89%
VGG-16
GoogLeNet
87% 85% 83% AlexNet
SqueezeNet
79% 77% 5E+08
Energy
5E+09 Normalized Energy Consump9on
5E+10
Original DNN
L1 L2 L3 … CNN Energy Consumption
Fig. 42. Energy estimation methodology from [145], which estimates the energy based on data movement from different levels of the memory hierarchy, number of MACs, and data sparsity.
ResNet-50
91%
81%
Ecomp
(a) Energy versus accuracy trade-off of popular DNN models. 93% Top-5 Accuracy
CNN Shape Configuration (# of channels, # of filters, etc.)
Top-5 Accuracy
93%
ResNet-50
91% 89% 87%
GoogLeNet
VGG-16
GoogLeNet
85%
83% SqueezeNet 1.74x In 2015, a similar idea was applied to modern DNNs in [144]. 81% SqueezeNet AlexNet Rather than using the saliency as a metric, which is too difficult AlexNet AlexNet SqueezeNet 79% to compute for the large-scaled DNNs, the pruning was simply 77% 5E+08 5E+09 5E+10 based on the magnitude of the weights. Small weights were Normalized Energy Consump9on pruned and the model was fine-tuned to restore the accuracy. Original DNN Magnitude-based Pruning Energy-aware Pruning Without fine-tuning the weights, about 50% of the weights (b) Impact of energy-aware pruning. could be pruned. With fine-tuning, over 80% of the weights were pruned. Overall this approach can reduce the number Fig. 43. Energy values estimated with methodology in [145]. of weights in AlexNet by 9× and the number of MACs by 3×. Most of the weight reduction comes from the fullyconnected layers (9.9× for fully-connected layers versus 2.7× to determine how to store the sparse weight matrix in a for convolutional layers). However, the number of weights alone is not a good metric compressed format. The compression can be applied either for energy. For instance, in AlexNet, the number of weights in row or column order. A compressed sparse row (CSR) in the fully-connected layers is much larger than in the format, as shown in Fig. 44(a), is often used to perform Sparse convolutional layers; however, the energy of the convolutional Matrix-Vector multiplication. However, the input vector needs layers is much higher than the fully-connected layers as shown to be read in multiple times even though only a subset of it is in Fig. 35 [82]. Rather than using the number of weights used since each row of the matrix is sparse. Alternatively, and MAC operations as proxies for energy, the pruning of a compressed sparse column (CSC) format, as shown in the weights can be directly driven by energy itself [145]. An Fig. 44(b), can be used, where the output is updated several energy evaluation method can be used to estimate the DNN times, and only one element of the input vector is read at energy that accounts for the data movement from different a time [147]. The CSC format will provide an overall lower levels of the memory hierarchy, the number of MACs, and the memory bandwidth than CSR if the output is smaller than the data sparsity as shown in Fig. 42; this energy estimation tool input, or in the case of DNN, if the number of filters is not is available at [146]. The resulting energy values for popular significantly larger than the number of weights in the filter DNN models are shown in Fig. 43(a). Energy-aware pruning (C × R × S from Fig. 9(b)). Since this is often true, CSC can can then be used to prune weights based on energy to reduce be an effective format for sparse DNN processing. the overall energy across all layers by 3.7× for AlexNet, which Custom hardware has been explored to efficiently support is 1.74× more efficient than magnitude-based approaches [144] pruned DNN models. Many works aim to perform the processas shown in Fig. 43(b). As mentioned previously, it is well ing without decompressing the weights or activations. EIE [148] known that AlexNet is over-parameterized. The energy-aware performs the sparse matrix-vector multiplication specifically for pruning can also be applied to GoogleNet, which is already a the fully connected layers. It stores the weights in a CSC format small DNN model, for a 1.6× energy reduction. along with the start location of each column, which needs to be Recent works have examine how to efficiently support stored since the compressed weights have variable length. When processing of sparse weights in hardware. One area of interest the input is not zero, the compressed weight column is read and is how to best store the sparse weights after pruning. Similar to the output is updated. To handle the sparsity, additional logic compressing the sparse activations discussed in Section VII-B1, is used to keep track of the location of the output that should the sparse weights can be compressed to reduce memory access be updated. SCNN [149] supports processing of convolutional bandwidth by 20 to 30% [120]. layers in a compressed format. It uses an input stationary When DNN processing is performed as a matrix-vector dataflow to deliver the compressed weights and activations to multiplication, as shown in Fig. 18(a), one challenge is a multiplier array followed by a scatter network to add the
25
trained network into a series of filters without non-linearity between them. a) Before Training: In recent DNN models, filters with a smaller width and height are used more frequently because # of filters concatenating several of them can emulate a larger filter as shown in Fig. 13. For example, one 5×5 convolution can be replaced with two 3×3 convolutions. Alternatively, one N×N convolution can be decomposed into two 1-D convolutions, one 1×N and one N×1 convolution [53]; this basically imposes a restriction that the 2-D filter must be separable, which is a common constraint in image processing [154]. Similarly, a 3-D convolution can be replaced by a set of 2-D convolutions (i.e., applied only on one of the input channels) followed by 1×1 3-D convolutions as demonstrated in Xception [155] and (a) Compressed sparse row (CSR) MobileNets [156]. The order of the 2-D convolutions and 1×1 3-D convolutions can be switched. 1×1 convolutional layers can also be used to reduce the number of channels in the output feature map for a given layer, which reduces the number of filter channels and thus computation cost for the filters in the next layer as demonstrated in [15, 51, 52]; this is often referred to as a ‘bottleneck’ as discussed in Section III-B. For this purpose, the number of 1×1 filters has to be less than the number of channels in the 1×1 filter. For example, 32 filters of 1×1×64 can transform an input with 64 channels to an output of 32 channels and reduce the (b) Compressed sparse column (CSC) number of filter channels in the next layer to 32. SqueezeNet Fig. 44. Sparse matrix-vector multiplications using different storage formats uses many 1×1 filters to aggressively reduce the number of weights [157]. It proposes a fire module that first ‘squeezes’ (Figure from [147]). the network with 1×1 convolution filters and then expands it with multiple 1×1 and 3×3 convolution filters. It achieves scattered partial sums. an overall 50× reduction in number of weights compared to Recent works have also explored the use of structured AlexNet, while maintaining the same accuracy. It should be pruning to avoid the need for custom hardware [150, 151]. noted, however, that reducing the number of weights does not Rather than pruning individual weights (also referred to as fine- necessarily reduce energy; for instance, SqueezeNet consumes grained pruning), structured pruning involves pruning groups more energy than AlexNet, as shown in Fig. 43(a). of weights (also referred to as coarse-grained pruning). The b) After Training: Tensor decomposition can be used to benefits of structured pruning are (1) the resulting weights can decompose filters in a trained network without impacting the better align with the data-parallel architecture (e.g., SIMD) accuracy. It treats weights in a layer as a 4-D tensor and breaks found in existing general purpose hardware, which results in it into a combination of smaller tensors (i.e., several layers). more efficient processing [152]; (2) it amortizes the overhead Low-rank approximation can then be applied to further increase cost required to signal the location of the non-zero weights the compression rate at the cost of accuracy degradation, which across a group of weights, which improves compression and can be restored by fine-tuning the weights. thus reduces storage cost. These groups of weights can include This approach is demonstrated using Canonical Polyadic (CP) a pair of neighboring weights, an entire row or column of a decomposition, a high-order extension of singular value decomfilter, an entire channel of a filter or the entire filter itself; using position that can be solved by various methods, such as a greedy larger groups tends to result in higher loss in accuracy [153]. algorithm [158] or a non-linear least-square method [159]. 3) Compact Network Architectures: The number of weights Combining CP-decomposition with low-rank approximation and operations can also be reduced by improving the network achieves a 4.5× speed-up on CPUs [159]. However, CParchitecture itself. The trend is to replace a large filter with a decomposition cannot be computed in a numerically stable series of smaller filters, which have fewer weights in total; when way when the dimension of the tensor, which represents the the filters are applied sequentially, they achieve the same overall weights, is larger than two [159]. To alleviate this problem, effective receptive field (i.e., the region the filter uses from input Tucker decomposition is adopted instead in [160]. image to compute an output). This approach can be applied 4) Knowledge Distillation: Using a deep network or avduring the network architecture design (before training) or by eraging the predictions of different models (i.e., ensemble) decomposing the filters of a trained network (after training). gives a better accuracy than using a single shallower network. The latter one avoids the hassle of training networks from However, the computational complexity is also higher. To get scratch. However, it is less flexible than the former one. For the best of both worlds, knowledge distillation transfers the example, existing methods can only decompose a filter in a knowledge learned by the complex model (teacher) to the # of weights
26
Complex DNN B (teacher)
softmax
Complex DNN A (teacher)
class probabilities
softmax
scores
Simple DNN (student)
softmax
Try to match
Fig. 45. Knowledge distillation matches the class scores of a small DNN to an ensemble of large DNNs.
simpler model (student). The student network can therefore achieve an accuracy that would be unachievable if it was directly trained with the same dataset [161, 162]. For example, [163] shows how using knowledge distillation can improve the speech recognition accuracy of a student net by 2%, which is similar to the accuracy of a teacher net that is composed of an ensemble of 10 networks. Fig. 45 shows the simplest knowledge distillation method [161]. The softmax layer is commonly used as the output layer in the image classification networks to generate the class probabilities from the class scores12 ; it squashes the class scores into values between 0 and 1 that sum up to 1. For this knowledge distillation method, soft targets (values between 0 and 1) such as the class scores of the teacher DNN (or an ensemble of teacher DNNs) are used instead of the hard targets (values of either 0 or 1) such as the labels in the dataset. The objective is to minimize the squared difference between the soft targets and the class scores of the student DNN. Class scores are used as the soft targets instead of the class probabilities because small values in the class scores contain important information that may be eliminated by the softmax. Alternatively, class probabilities after the softmax layer can be used as soft targets if the softmax is configured to generate softer class probabilities where the smaller values retain more information [163]. Finally, the intermediate representations of the teacher DNN can also be incorporated as the extra hints to train the student DNN [164]. VIII. B ENCHMARKING M ETRICS FOR DNN E VALUATION AND C OMPARISON As we have seen in this article, there has been a significant amount of research on efficient processing of DNNs. We should consider several key metrics to compare the various strengths and weaknesses of different designs and proposed techniques. These metrics should cover important attributes such as accuracy/robustness, power/energy consumption, throughput/latency and cost. Reporting all these metrics is important in order to provide a complete picture of the trade-offs made by a proposed design or technique. We have prepared a website to collect these metrics from various publications [165]. 12 Also
commonly referred to as logits.
In terms of accuracy and robustness, it is important that the accuracy be reported on widely-accepted datasets as discussed in Section IV. The difficulty of the dataset and/or task should be considered when measuring the accuracy. For instance, the MNIST dataset for digit recognition is significantly easier than the ImageNet dataset. As a result, a DNN that performs well on MNIST may not necessarily perform well on ImageNet. Thus it is important that the same dataset and task is used when comparing the accuracy of different DNN models; currently ImageNet is preferred since it presents a challenge for DNNs, as opposed to MNIST, which can also be addressed with simple non-DNN techniques. To demonstrate primarily hardware innovations, it would be desirable to report results for widelyused DNN models (e.g., AlexNet, GoogLeNet) whose accuracy and robustness have been well studied and tested. Energy and power are important when processing DNNs at the edge in embedded devices with limited battery capacity (e.g., smart phones, smart sensors, UAVs, and wearables), or in the cloud in data centers with stringent power ceilings due to cooling costs, respectively. Edge processing is preferred over the cloud for certain applications due to latency, privacy or communication bandwidth limitations. When evaluating the power and energy consumption, it is important to account for all aspects of the system including the chip and external memory accesses. High throughput is necessary to deliver real-time performance for interactive applications such as navigation and robotics. For data analytics, high throughput means that more data can be analyzed in a given amount of time. As the amount of visual data is growing exponentially, high-throughput big data analytics becomes important, particularly if an action needs to be taken based on the analysis (e.g., security or terrorist prevention; medical diagnosis). Low latency is necessary for real-time interactive applications. Latency measures the time between when the pixel arrives to a system and when the result is generated. Latency is measured in terms of seconds, while throughput is measured in operations/second. Often high throughput is obtained by batching multiple images/frames together for processing; this results in multiple frame latency (e.g., at 30 frames per second, a batch of 100 frames results in a 3 second delay). This delay is not acceptable for real-time applications, such as high-speed navigation where it would reduce the time available for course correction. Thus achieving low latency and high throughput simultaneously can be a challenge. Hardware cost is in large part dictated by the amount of on-chip storage and the number of cores. Typical embedded processors have limited on-chip storage on the order of a few hundred kilobytes. Since there is a trade-off between the amount of on-chip memory and the external memory bandwidth, both metrics should be reported. Similarly, there is a correlation between the number of cores and the throughput. In addition, while many cores can be built on a chip, the number of cores that can actually be used at a given time should be reported. It is often unrealistic to assume peak utilization and performance due to limitations of mapping and memory bandwidth. Accordingly, the power and throughput should be reported for running actual DNNs as opposed to only reporting theoretical limits.
27
A. Metrics for DNN Models To evaluate the properties of a given DNN model, we should consider the following metrics: • The accuracy of the model in terms of the top-5 error on datasets such as ImageNet. Also, the type of data augmentation used (e.g., multiple crops, ensemble models) should be reported. • The network architecture of the model should be reported, including number of layers, filter sizes, number of filters and number of channels. • The number of weights impact the storage requirement of the model and should be reported. If possible, the number of non-zero weights should be reported since this reflects the theoretical minimum storage requirements. • The number of MACs that needs to be performed should be reported as it is somewhat indicative of the number of operations and potential throughput of the given DNN. If possible, the number of non-zero MACs should also be reported since this reflects the theoretical minimum compute requirements. Table IV shows how these metrics are reported for various well known DNNs. The accuracy is reported for the case where only a single crop for a single model is used for classification, such that the number of weights and MACs in the table are consistent.13 Note that accounting for the number of non-zero (NZ) operations significantly reduces the number of MACs and weights. Since the number of NZ MACs depends on the input data, we propose using the publicly available 50,000 validation images from ImageNet for the computation. Finally, there are various methods to reduce the weights in a DNN (e.g., network pruning in Section VII-B2). Table IV shows another example of these DNN model metrics, by comparing sparse DNNs pruned using [145] to dense DNNs. B. Metrics for DNN Hardware To measure the efficiency of the DNN hardware, we should consider the following additional metrics: • The power and energy consumption of the design should be reported for various DNN models; the DNN model specifications should be provided including which layers and bit precision are supported by the hardware during measurement. In addition, the amount of off-chip accesses (e.g., DRAM accesses) should be included since it accounts for a significant portion of the system power; it can be reported in terms of the total amount of data that is read and written off-chip per inference. • The latency and throughput should be reported in terms of the batch size and the actual run time for various DNN models, which accounts for mapping and memory bandwidth effects. This provides a more useful and informative metric than peak throughput. 13 Data augmentation is often used to increase accuracy. This includes using multiple crops of an image to account for misalignment; in addition, an ensemble of multiple models can be used where each model has different weights due to different training settings, such as using different initializations or datasets, or even different network architectures. If multiple crops and models are used, then the number of MACs and weights required would increase.
Metrics Top-5 error Number of CONV Layers Depth in (Number of CONV Layers) Filter Sizes Number of Channels Number of Filters Stride NZ Weights NZ MACs FC Layers Filter Sizes Number of Channels Number of Filters NZ Weights NZ MACs Total NZ Weights Total NZ MACs
AlexNet dense sparse 19.6 20.4 5 5 5
5
GoogLeNet v1 dense sparse 11.7 12.7 57 57 21
21
3,5,11 1,3,5,7 3-256 3-832 96-384 16-384 1,4 1,2 2.3M 351k 6.0M 1.5M 395M 56.4M 806M 220M 3 3 1 1 1,6 1 256-4096 1024 1000-4096 1000 58.6M 5.4M 1M 870k 14.5M 1.9M 635k 663k 61M 5.7M 7M 2.4M 410M 58.3M 806M 221M TABLE IV M ETRICS FOR P OPULAR DNN M ODELS . S PARSITY IS ACCOUNT FOR BY REPORTING NON - ZERO (NZ) WEIGHTS AND MAC S .
•
The cost of the chip depends on the area efficiency, which accounts for the size and type of memory (e.g., registers or SRAM) and the amount of control logic. It should be reported in terms of the core area in squared millimeters per multiplier along with process technology.
In terms of cost, different platforms will have different implementation-specific metrics. For instance, for an FPGA, the specific device should be reported, along with the utilization of resources such as DSP, BRAM, LUT and FF; performance density such as GOPs/slice can also be reported. Each processor should report various specifications for each metric as shown in Table V, using the Eyeriss chip as an example. It is important that all metrics and specifications are accounted for in order fairly evaluate all the design trade-offs. For instance, without the accuracy given for a specific dataset and task, one could run a simple DNN and easily claim low power, high throughput, and low cost – however, the processor might not be usable for a meaningful task; alternatively, without reporting the off-chip bandwidth, one could build a processor with only multipliers and easily claim low cost, high throughput, high accuracy, and low chip power – however, when evaluating system power, the off-chip memory access would be substantial. Finally, the test setup should also be reported, including whether the results are measured or obtained from simulation14 and how many images were tested. In summary, the evaluation process for whether a DNN system is a viable solution for a given application might go as follows: (1) the accuracy determines if it can perform the given task; (2) the latency and throughput determine if it can run fast enough and in real-time; (3) the energy and power consumption will primarily dictate the form factor of the device where the processing can operate; (4) the cost, which is primarily dictated by the chip area, determines how much one would pay for this solution. 14 If obtained from simulation, it should be clarified whether it is from synthesis or post place-and-route and what library corner was used.
28
Metrics
Specifications Eyeriss Process Technology 65nm LP TSMC (1.0V) Total Core Area (mm2 ) 12.25 Total On-chip Memory (kB) 192 Number of Multipliers 168 Cost Core area 0.073 per Multiplier (mm2 ) On-chip Memory 1.14 per Multiplier (kB) Measured or Simulated Measured Test Setup If Simulated, Syn or PnR n/a DNN Model AlexNet VGG-16 Top-5 error on ImageNet 19.8 8.8 Dense/Sparse Dense Dense Accuracy Supported Layers All CONV layers All CONV layers Bits per Weight 16 16 Bits per Input Activation 16 16 Batch Size 4 3 Latency and Throughput Run Time (msec) 115.3 4309.4 Power (mW) 278 236 Power and Energy Off-chip Accesses 3.85 107.03 per Image Inference (MBytes) Test Setup Number of Images Tested 100 100 TABLE V E XAMPLE B ENCHMARK M ETRICS FOR E YERISS [96].
IX. S UMMARY The use of deep neural networks (DNNs) has seen explosive growth in the past few years. They are currently widely used for many artificial intelligence (AI) applications including computer vision, speech recognition and robotics and are often delivering better than human accuracy. However, while DNNs can deliver this outstanding accuracy, it comes at the cost of high computational complexity. Consequently, techniques that enable efficient processing of deep neural network to improve energy-efficiency and throughput without sacrificing accuracy with cost-effective hardware are critical to expanding the deployment of DNNs in both existing and new domains. Creating a system for efficient DNN processing should begin with understanding the current and future applications and the specific computations required both now and the potential evolution of those computations. This article surveys a number of the current applications, focusing on computer vision applications, the associated algorithms, and the data being used to drive the algorithms. These applications, algorithms and input data are experiencing rapid change. So extrapolating these trends to determine the degree of flexibility desired to handle next generation computations, becomes an important ingredient of any design project. During the design-space exploration process, it is critical to understand and balance the important system metrics. For DNN computation these include the accuracy, energy, throughput and hardware cost. Evaluating these metrics is, of course, key, so this article surveys the important components of a DNN workload. In specific, a DNN workload has two major components. First, the workload is the form of each DNN network including the ‘shape’ of each layer and the interconnections between layers. These can vary both within and between applications. Second, the workload consists of the specific the data input to the DNN. This data will vary with the input set used for training or the data input during operation for inference.
This article also surveys a number of avenues that prior work have taken to optimize DNN processing. Since data movement dominates energy consumption, a primary focus of some recent research has been to reduce data movement while maintaining accuracy, throughput and cost. This means selecting architectures with favorable memory hierarchies like a spatial array, and developing dataflows that increase data reuse at the low-cost levels of the memory hierarchy. We have included a taxonomy of dataflows and an analysis of their characteristics. Other work is presented that aims to save space and energy by changing the representation of data values in the DNN. Still other work saves energy and sometimes increases throughput by exploiting the sparsity of weights and/or activations. The DNN domain also affords an excellent opportunity for joint hardware/software co-design. For example, various efforts have noted that efficiency can be improved by increasing sparsity (increasing the number of zero values) or optimizing the representation of data by reducing the precision of values or using more complex mappings of the stored value to the actual value used for computation. However, to avoid losing accuracy it is often useful to modify the network or fine-tune the network’s weights to accommodate these changes. Thus, this article both reviews a variety of these techniques and discusses the frameworks that are available for describing, running and training networks. Finally, DNNs afford the opportunity to use mixed-signal circuit design and advanced technologies to improve efficiency. These include using memristors for analog computation and 3-D stacked memory. Advanced technologies can also can facilitate moving computation closer to the source by embedding computation near or within the sensor and the memories. Of course, all of these techniques should also be considered in combination, while being careful to understand their interactions and looking for opportunities for joint hardware/algorithm co-optimization. In conclusion, although much work has been done, deep
29
neural networks remain an important area of research with many promising applications and opportunities for innovation at various levels of hardware design. ACKNOWLEDGMENTS Funding provided by DARPA YFA, MIT CICS, and gifts from Nvidia and Intel. The authors thank the anonymous reviewers as well as James Noraky, Mehul Tikekar and Zhengdong Zhang for providing valuable feedback on this paper. R EFERENCES [1] Y. LeCun, Y. Bengio, and G. Hinton, “Deep learning,” Nature, vol. 521, no. 7553, pp. 436–444, May 2015. [2] L. Deng, J. Li, J.-T. Huang, K. Yao, D. Yu, F. Seide, M. Seltzer, G. Zweig, X. He, J. Williams et al., “Recent advances in deep learning for speech research at Microsoft,” in ICASSP, 2013. [3] A. Krizhevsky, I. Sutskever, and G. E. Hinton, “ImageNet Classification with Deep Convolutional Neural Networks,” in NIPS, 2012. [4] C. Chen, A. Seff, A. Kornhauser, and J. Xiao, “Deepdriving: Learning affordance for direct perception in autonomous driving,” in ICCV, 2015. [5] A. Esteva, B. Kuprel, R. A. Novoa, J. Ko, S. M. Swetter, H. M. Blau, and S. Thrun, “Dermatologist-level classification of skin cancer with deep neural networks,” Nature, vol. 542, no. 7639, pp. 115–118, 2017. [6] D. Silver, A. Huang, C. J. Maddison, A. Guez, L. Sifre, G. van den Driessche, J. Schrittwieser, I. Antonoglou, V. Panneershelvam, M. Lanctot, S. Dieleman, D. Grewe, J. Nham, N. Kalchbrenner, I. Sutskever, T. Lillicrap, M. Leach, K. Kavukcuoglu, T. Graepel, and D. Hassabis, “Mastering the game of Go with deep neural networks and tree search,” Nature, vol. 529, no. 7587, pp. 484–489, Jan. 2016. [7] F.-F. Li, A. Karpathy, and J. Johnson, “Stanford CS class CS231n: Convolutional Neural Networks for Visual Recognition,” http://cs231n.stanford.edu/. [8] P. A. Merolla, J. V. Arthur, R. Alvarez-Icaza, A. S. Cassidy, J. Sawada, F. Akopyan, B. L. Jackson, N. Imam, C. Guo, Y. Nakamura et al., “A million spiking-neuron integrated circuit with a scalable communication network and interface,” Science, vol. 345, no. 6197, pp. 668–673, 2014. [9] S. K. Esser, P. A. Merolla, J. V. Arthur, A. S. Cassidy, R. Appuswamy, A. Andreopoulos, D. J. Berg, J. L. McKinstry, T. Melano, D. R. Barch et al., “Convolutional networks for fast, energy-efficient neuromorphic computing,” Proceedings of the National Academy of Sciences, 2016. [10] M. Mathieu, M. Henaff, and Y. LeCun, “Fast training of convolutional networks through FFTs,” in ICLR, 2014. [11] Y. LeCun, L. D. Jackel, B. Boser, J. S. Denker, H. P. Graf, I. Guyon, D. Henderson, R. E. Howard, and W. Hubbard, “Handwritten digit recognition: applications of neural network chips and automatic learning,” IEEE Commun. Mag., vol. 27, no. 11, pp. 41–46, Nov 1989. [12] B. Widrow and M. E. Hoff, “Adaptive switching circuits,” in 1960 IRE WESCON Convention Record, 1960. [13] B. Widrow, “Thinking about thinking: the discovery of the LMS algorithm,” IEEE Signal Process. Mag., 2005. [14] O. Russakovsky, J. Deng, H. Su, J. Krause, S. Satheesh, S. Ma, Z. Huang, A. Karpathy, A. Khosla, M. Bernstein, A. C. Berg, and L. Fei-Fei, “ImageNet Large Scale Visual Recognition Challenge,” International Journal of Computer Vision (IJCV), vol. 115, no. 3, pp. 211–252, 2015. [15] K. He, X. Zhang, S. Ren, and J. Sun, “Deep Residual Learning for Image Recognition,” in CVPR, 2016. [16] “Complete Visual Networking Index (VNI) Forecast,” Cisco, June 2016.
[17] J. Woodhouse, “Big, big, big data: higher and higher resolution video surveillance,” technology.ihs.com, January 2016. [18] R. Girshick, J. Donahue, T. Darrell, and J. Malik, “Rich Feature Hierarchies for Accurate Object Detection and Semantic Segmentation,” in CVPR, 2014. [19] J. Long, E. Shelhamer, and T. Darrell, “Fully Convolutional Networks for Semantic Segmentation,” in CVPR, 2015. [20] K. Simonyan and A. Zisserman, “Two-stream convolutional networks for action recognition in videos,” in NIPS, 2014. [21] G. Hinton, L. Deng, D. Yu, G. E. Dahl, A.-r. Mohamed, N. Jaitly, A. Senior, V. Vanhoucke, P. Nguyen, T. N. Sainath et al., “Deep neural networks for acoustic modeling in speech recognition: The shared views of four research groups,” IEEE Signal Process. Mag., vol. 29, no. 6, pp. 82–97, 2012. [22] R. Collobert, J. Weston, L. Bottou, M. Karlen, K. Kavukcuoglu, and P. Kuksa, “Natural language processing (almost) from scratch,” Journal of Machine Learning Research, vol. 12, no. Aug, pp. 2493–2537, 2011. [23] A. van den Oord, S. Dieleman, H. Zen, K. Simonyan, O. Vinyals, A. Graves, N. Kalchbrenner, A. Senior, and K. Kavukcuoglu, “Wavenet: A generative model for raw audio,” CoRR abs/1609.03499, 2016. [24] H. Y. Xiong, B. Alipanahi, L. J. Lee, H. Bretschneider, D. Merico, R. K. Yuen, Y. Hua, S. Gueroussov, H. S. Najafabadi, T. R. Hughes et al., “The human splicing code reveals new insights into the genetic determinants of disease,” Science, vol. 347, no. 6218, p. 1254806, 2015. [25] J. Zhou and O. G. Troyanskaya, “Predicting effects of noncoding variants with deep learning-based sequence model,” Nature methods, vol. 12, no. 10, pp. 931–934, 2015. [26] B. Alipanahi, A. Delong, M. T. Weirauch, and B. J. Frey, “Predicting the sequence specificities of dna-and rna-binding proteins by deep learning,” Nature biotechnology, vol. 33, no. 8, pp. 831–838, 2015. [27] H. Zeng, M. D. Edwards, G. Liu, and D. K. Gifford, “Convolutional neural network architectures for predicting dna–protein binding,” Bioinformatics, vol. 32, no. 12, pp. i121–i127, 2016. [28] M. Jermyn, J. Desroches, J. Mercier, M.-A. Tremblay, K. StArnaud, M.-C. Guiot, K. Petrecca, and F. Leblond, “Neural networks improve brain cancer detection with raman spectroscopy in the presence of operating room light artifacts,” Journal of Biomedical Optics, vol. 21, no. 9, pp. 094 002–094 002, 2016. [29] D. Wang, A. Khosla, R. Gargeya, H. Irshad, and A. H. Beck, “Deep learning for identifying metastatic breast cancer,” arXiv preprint arXiv:1606.05718, 2016. [30] L. P. Kaelbling, M. L. Littman, and A. W. Moore, “Reinforcement learning: A survey,” Journal of artificial intelligence research, vol. 4, pp. 237–285, 1996. [31] V. Mnih, K. Kavukcuoglu, D. Silver, A. Graves, I. Antonoglou, D. Wierstra, and M. Riedmiller, “Playing Atari with Deep Reinforcement Learning,” in NIPS Deep Learning Workshop, 2013. [32] S. Levine, C. Finn, T. Darrell, and P. Abbeel, “End-to-end training of deep visuomotor policies,” Journal of Machine Learning Research, vol. 17, no. 39, pp. 1–40, 2016. [33] M. Pfeiffer, M. Schaeuble, J. Nieto, R. Siegwart, and C. Cadena, “From Perception to Decision: A Data-driven Approach to Endto-end Motion Planning for Autonomous Ground Robots,” in ICRA, 2017. [34] S. Gupta, J. Davidson, S. Levine, R. Sukthankar, and J. Malik, “Cognitive mapping and planning for visual navigation,” in CVPR, 2017. [35] T. Zhang, G. Kahn, S. Levine, and P. Abbeel, “Learning deep control policies for autonomous aerial vehicles with mpc-guided policy search,” in ICRA, 2016. [36] S. Shalev-Shwartz, S. Shammah, and A. Shashua, “Safe, multiagent, reinforcement learning for autonomous driving,” in NIPS Workshop on Learning, Inference and Control of Multi-Agent Systems, 2016.
30
[37] N. Hemsoth, “The Next Wave of Deep Learning Applications,” Next Platform, September 2016. [38] S. Hochreiter and J. Schmidhuber, “Long short-term memory,” Neural computation, vol. 9, no. 8, pp. 1735–1780, 1997. [39] T. N. Sainath, A.-r. Mohamed, B. Kingsbury, and B. Ramabhadran, “Deep convolutional neural networks for LVCSR,” in ICASSP, 2013. [40] V. Nair and G. E. Hinton, “Rectified Linear Units Improve Restricted Boltzmann Machines,” in ICML, 2010. [41] A. L. Maas, A. Y. Hannun, and A. Y. Ng, “Rectifier nonlinearities improve neural network acoustic models,” in ICML, 2013. [42] K. He, X. Zhang, S. Ren, and J. Sun, “Delving deep into rectifiers: Surpassing human-level performance on imagenet classification,” in ICCV, 2015. [43] D.-A. Clevert, T. Unterthiner, and S. Hochreiter, “Fast and Accurate Deep Network Learning by Exponential Linear Units (ELUs),” ICLR, 2016. [44] X. Zhang, J. Trmal, D. Povey, and S. Khudanpur, “Improving deep neural network acoustic models using generalized maxout networks,” in ICASSP, 2014. [45] Y. Zhang, M. Pezeshki, P. Brakel, S. Zhang, , C. Laurent, Y. Bengio, and A. Courville, “Towards End-to-End Speech Recognition with Deep Convolutional Neural Networks,” in Interspeech, 2016. [46] Y. Jia, E. Shelhamer, J. Donahue, S. Karayev, J. Long, R. Girshick, S. Guadarrama, and T. Darrell, “Caffe: Convolutional architecture for fast feature embedding,” in ACM International Conference on Multimedia, 2014. [47] S. Ioffe and C. Szegedy, “Batch normalization: Accelerating deep network training by reducing internal covariate shift,” in ICML, 2015. [48] Y. LeCun, L. Bottou, Y. Bengio, and P. Haffner, “Gradientbased learning applied to document recognition,” Proc. IEEE, vol. 86, no. 11, pp. 2278–2324, Nov 1998. [49] P. Sermanet, D. Eigen, X. Zhang, M. Mathieu, R. Fergus, and Y. LeCun, “OverFeat: Integrated Recognition, Localization and Detection using Convolutional Networks,” in ICLR, 2014. [50] K. Simonyan and A. Zisserman, “Very Deep Convolutional Networks for Large-Scale Image Recognition,” in ICLR, 2015. [51] C. Szegedy, W. Liu, Y. Jia, P. Sermanet, S. Reed, D. Anguelov, D. Erhan, V. Vanhoucke, and A. Rabinovich, “Going Deeper With Convolutions,” in CVPR, 2015. [52] M. Lin, Q. Chen, and S. Yan, “Network in Network,” in ICLR, 2014. [53] C. Szegedy, V. Vanhoucke, S. Ioffe, J. Shlens, and Z. Wojna, “Rethinking the inception architecture for computer vision,” in CVPR, 2016. [54] C. Szegedy, S. Ioffe, V. Vanhoucke, and A. Alemi, “Inceptionv4, Inception-ResNet and the Impact of Residual Connections on Learning,” in AAAI, 2017. [55] G. Urban, K. J. Geras, S. E. Kahou, O. Aslan, S. Wang, R. Caruana, A. Mohamed, M. Philipose, and M. Richardson, “Do Deep Convolutional Nets Really Need to be Deep and Convolutional?” ICLR, 2017. [56] “Caffe LeNet MNIST,” http://caffe.berkeleyvision.org/gathered/ examples/mnist.html. [57] “Caffe Model Zoo,” http://caffe.berkeleyvision.org/model zoo. html. [58] “Matconvnet Pretrained Models,” http://www.vlfeat.org/ matconvnet/pretrained/. [59] “TensorFlow-Slim image classification library,” https://github. com/tensorflow/models/tree/master/slim. [60] “Deep Learning Frameworks,” https://developer.nvidia.com/ deep-learning-frameworks. [61] Y.-H. Chen, T. Krishna, J. Emer, and V. Sze, “Eyeriss: An Energy-Efficient Reconfigurable Accelerator for Deep Convolutional Neural Networks,” IEEE J. Solid-State Circuits, vol. 51, no. 1, 2017.
[62] C. J. B. Yann LeCun, Corinna Cortes, “THE MNIST DATABASE of handwritten digits,” http://yann.lecun.com/exdb/ mnist/. [63] L. Wan, M. Zeiler, S. Zhang, Y. L. Cun, and R. Fergus, “Regularization of neural networks using dropconnect,” in ICML, 2013. [64] A. Krizhevsky, V. Nair, and G. Hinton, “The CIFAR-10 dataset,” https://www.cs.toronto.edu/∼kriz/cifar.html. [65] A. Torralba, R. Fergus, and W. T. Freeman, “80 million tiny images: A large data set for nonparametric object and scene recognition,” IEEE Trans. Pattern Anal. Mach. Intell., vol. 30, no. 11, pp. 1958–1970, 2008. [66] A. Krizhevsky and G. Hinton, “Convolutional deep belief networks on cifar-10,” Unpublished manuscript, vol. 40, 2010. [67] B. Graham, “Fractional max-pooling,” arXiv preprint arXiv:1412.6071, 2014. [68] “Pascal VOC data sets,” http://host.robots.ox.ac.uk/pascal/ VOC/. [69] “Microsoft Common Objects in Context (COCO) dataset,” http: //mscoco.org/. [70] “Google Open Images,” https://github.com/openimages/dataset. [71] “YouTube-8M,” https://research.google.com/youtube8m/. [72] “AudioSet,” https://research.google.com/audioset/index.html. [73] Intel Architecture Instruction Set Extensions Programming Reference, Intel, April 2017, ref. #319433-029. [74] S. Condon, “Facebook unveils Big Basin, new server geared for deep learning,” ZDNet, March 2017. [75] C. Dubout and F. Fleuret, “Exact acceleration of linear object detectors,” in ECCV, 2012. [76] A. Lavin and S. Gray, “Fast algorithms for convolutional neural networks,” in CVPR, 2016. [77] J. Cong and B. Xiao, “Minimizing computation in convolutional neural networks,” in ICANN, 2014. [78] “using strassen’s algorithm to accelerate the solution of linear systems.” [79] “Intel Math Kernel Library,” https://software.intel.com/en-us/ mkl. [80] S. Chetlur, C. Woolley, P. Vandermersch, J. Cohen, J. Tran, B. Catanzaro, and E. Shelhamer, “cuDNN: Efficient Primitives for Deep Learning,” arXiv preprint arXiv:1410.0759, 2014. [81] M. Horowitz, “Computing’s energy problem (and what we can do about it),” in ISSCC, 2014. [82] Y.-H. Chen, J. Emer, and V. Sze, “Eyeriss: A Spatial Architecture for Energy-Efficient Dataflow for Convolutional Neural Networks,” in ISCA, 2016. [83] ——, “Using Dataflow to Optimize Energy Efficiency of Deep Neural Network Accelerators,” IEEE Micro’s Top Picks from the Computer Architecture Conferences, vol. 37, no. 3, May-June 2017. [84] M. Sankaradas, V. Jakkula, S. Cadambi, S. Chakradhar, I. Durdanovic, E. Cosatto, and H. P. Graf, “A Massively Parallel Coprocessor for Convolutional Neural Networks,” in ASAP, 2009. [85] V. Sriram, D. Cox, K. H. Tsoi, and W. Luk, “Towards an embedded biologically-inspired machine vision processor,” in FPT, 2010. [86] S. Chakradhar, M. Sankaradas, V. Jakkula, and S. Cadambi, “A Dynamically Configurable Coprocessor for Convolutional Neural Networks,” in ISCA, 2010. [87] V. Gokhale, J. Jin, A. Dundar, B. Martini, and E. Culurciello, “A 240 G-ops/s Mobile Coprocessor for Deep Neural Networks,” in CVPR Workshop, 2014. [88] S. Park, K. Bong, D. Shin, J. Lee, S. Choi, and H.-J. Yoo, “A 1.93TOPS/W scalable deep learning/inference processor with tetra-parallel MIMD architecture for big-data applications,” in ISSCC, 2015. [89] L. Cavigelli, D. Gschwend, C. Mayer, S. Willi, B. Muheim, and L. Benini, “Origami: A Convolutional Network Accelerator,” in GLVLSI, 2015.
31
[90] S. Gupta, A. Agrawal, K. Gopalakrishnan, and P. Narayanan, “Deep Learning with Limited Numerical Precision,” in ICML, 2015. [91] Z. Du, R. Fasthuber, T. Chen, P. Ienne, L. Li, T. Luo, X. Feng, Y. Chen, and O. Temam, “ShiDianNao: Shifting Vision Processing Closer to the Sensor,” in ISCA, 2015. [92] M. Peemen, A. A. A. Setio, B. Mesman, and H. Corporaal, “Memory-centric accelerator design for Convolutional Neural Networks,” in ICCD, 2013. [93] C. Zhang, P. Li, G. Sun, Y. Guan, B. Xiao, and J. Cong, “Optimizing FPGA-based Accelerator Design for Deep Convolutional Neural Networks,” in FPGA, 2015. [94] T. Chen, Z. Du, N. Sun, J. Wang, C. Wu, Y. Chen, and O. Temam, “DianNao: A Small-footprint High-throughput Accelerator for Ubiquitous Machine-learning,” in ASPLOS, 2014. [95] Y. Chen, T. Luo, S. Liu, S. Zhang, L. He, J. Wang, L. Li, T. Chen, Z. Xu, N. Sun, and O. Temam, “DaDianNao: A Machine-Learning Supercomputer,” in MICRO, 2014. [96] Y.-H. Chen, T. Krishna, J. Emer, and V. Sze, “Eyeriss: An Energy-Efficient Reconfigurable Accelerator for Deep Convolutional Neural Networks,” in ISSCC, 2016. [97] V. Sze, M. Budagavi, and G. J. Sullivan, “High Efficiency Video Coding (HEVC): Algorithms and Architectures,” in Integrated Circuit and Systems. Springer, 2014, pp. 1–375. [98] M. Alwani, H. Chen, M. Ferdman, and P. Milder, “Fused-layer CNN accelerators,” in MICRO, 2016. [99] D. Keitel-Schulz and N. Wehn, “Embedded DRAM development: Technology, physical design, and application issues,” IEEE Des. Test. Comput., vol. 18, no. 3, pp. 7–15, 2001. [100] J. Jeddeloh and B. Keeth, “Hybrid memory cube new DRAM architecture increases density and performance,” in Symp. on VLSI, 2012. [101] J. Standard, “High bandwidth memory (HBM) DRAM,” JESD235, 2013. [102] D. Kim, J. Kung, S. Chai, S. Yalamanchili, and S. Mukhopadhyay, “Neurocube: A programmable digital neuromorphic architecture with high-density 3D memory,” in ISCA, 2016. [103] M. Gao, J. Pu, X. Yang, M. Horowitz, and C. Kozyrakis, “TETRIS: Scalable and Efficient Neural Network Acceleration with 3D Memory,” in ASPLOS, 2017. [104] J. Zhang, Z. Wang, and N. Verma, “A machine-learning classifier implemented in a standard 6T SRAM array,” in Symp. on VLSI, 2016. [105] Z. Wang, R. Schapire, and N. Verma, “Error-adaptive classifier boosting (EACB): Exploiting data-driven training for highly fault-tolerant hardware,” in ICASSP, 2014. [106] A. Shafiee, A. Nag, N. Muralimanohar, R. Balasubramonian, J. P. Strachan, M. Hu, R. S. Williams, and V. Srikumar, “ISAAC: A Convolutional Neural Network Accelerator with In-Situ Analog Arithmetic in Crossbars,” in ISCA, 2016. [107] L. Chua, “Memristor-the missing circuit element,” IEEE Trans. Circuit Theory, vol. 18, no. 5, pp. 507–519, 1971. [108] L. Wilson, “International technology roadmap for semiconductors (ITRS),” Semiconductor Industry Association, 2013. [109] Lu, Darsen, “Tutorial on Emerging Memory Devices,” 2016. [110] S. B. Eryilmaz, S. Joshi, E. Neftci, W. Wan, G. Cauwenberghs, and H.-S. P. Wong, “Neuromorphic architectures with electronic synapses,” in ISQED, 2016. [111] P. Chi, S. Li, Z. Qi, P. Gu, C. Xu, T. Zhang, J. Zhao, Y. Liu, Y. Wang, and Y. Xie, “PRIME: A Novel Processing-In-Memory Architecture for Neural Network Computation in ReRAM-based Main Memory,” in ISCA, 2016. [112] M. Prezioso, F. Merrikh-Bayat, B. Hoskins, G. Adam, K. K. Likharev, and D. B. Strukov, “Training and operation of an integrated neuromorphic network based on metal-oxide memristors,” Nature, vol. 521, no. 7550, pp. 61–64, 2015. [113] J. Zhang, Z. Wang, and N. Verma, “A matrix-multiplying ADC implementing a machine-learning classifier directly with data
conversion,” in ISSCC, 2015. [114] E. H. Lee and S. S. Wong, “A 2.5 GHz 7.7 TOPS/W switchedcapacitor matrix multiplier with co-designed local memory in 40nm,” in ISSCC, 2016. [115] R. LiKamWa, Y. Hou, J. Gao, M. Polansky, and L. Zhong, “RedEye: analog ConvNet image sensor architecture for continuous mobile vision,” in ISCA, 2016. [116] A. Wang, S. Sivaramakrishnan, and A. Molnar, “A 180nm CMOS image sensor with on-chip optoelectronic image compression,” in CICC, 2012. [117] H. Chen, S. Jayasuriya, J. Yang, J. Stephen, S. Sivaramakrishnan, A. Veeraraghavan, and A. Molnar, “ASP Vision: Optically Computing the First Layer of Convolutional Neural Networks using Angle Sensitive Pixels,” in CVPR, 2016. [118] A. Suleiman and V. Sze, “Energy-efficient HOG-based object detection at 1080HD 60 fps with multi-scale support,” in SiPS, 2014. [119] E. H. Lee, D. Miyashita, E. Chai, B. Murmann, and S. S. Wong, “Lognet: Energy-Efficient Neural Networks Using Logrithmic Computations,” in ICASSP, 2017. [120] S. Han, H. Mao, and W. J. Dally, “Deep Compression: Compressing Deep Neural Networks with Pruning, Trained Quantization and Huffman Coding,” in ICLR, 2016. [121] I. Hubara, M. Courbariaux, D. Soudry, R. El-Yaniv, and Y. Bengio, “Quantized neural networks: Training neural networks with low precision weights and activations,” arXiv preprint arXiv:1609.07061, 2016. [122] S. Zhou, Y. Wu, Z. Ni, X. Zhou, H. Wen, and Y. Zou, “DoReFaNet: Training low bitwidth convolutional neural networks with low bitwidth gradients,” arXiv preprint arXiv:1606.06160, 2016. [123] Y. Ma, N. Suda, Y. Cao, J.-S. Seo, and S. Vrudhula, “Scalable and modularized RTL compilation of Convolutional Neural Networks onto FPGA,” in FPL, 2016. [124] P. Gysel, M. Motamedi, and S. Ghiasi, “Hardware-oriented Approximation of Convolutional Neural Networks,” in ICLR, 2016. [125] S. Higginbotham, “Google Takes Unconventional Route with Homegrown Machine Learning Chips,” Next Platform, May 2016. [126] T. P. Morgan, “Nvidia Pushes Deep Learning Inference With New Pascal GPUs,” Next Platform, September 2016. [127] P. Judd, J. Albericio, T. Hetherington, T. M. Aamodt, and A. Moshovos, “Stripes: Bit-serial deep neural network computing,” in MICRO, 2016. [128] B. Moons and M. Verhelst, “A 0.3–2.6 TOPS/W precisionscalable processor for real-time large-scale ConvNets,” in Symp. on VLSI, 2016. [129] M. Courbariaux, Y. Bengio, and J.-P. David, “Binaryconnect: Training deep neural networks with binary weights during propagations,” in NIPS, 2015. [130] M. Courbariaux and Y. Bengio, “Binarynet: Training deep neural networks with weights and activations constrained to+ 1 or-1,” arXiv preprint arXiv:1602.02830, 2016. [131] M. Rastegari, V. Ordonez, J. Redmon, and A. Farhadi, “XNORNet: ImageNet Classification Using Binary Convolutional Neural Networks,” in ECCV, 2016. [132] Z. Cai, X. He, J. Sun, and N. Vasconcelos, “Deep learning with low precision by half-wave gaussian quantization,” in CVPR, 2017. [133] F. Li and B. Liu, “Ternary weight networks,” in NIPS Workshop on Efficient Methods for Deep Neural Networks, 2016. [134] C. Zhu, S. Han, H. Mao, and W. J. Dally, “Trained Ternary Quantization,” ICLR, 2017. [135] R. Andri, L. Cavigelli, D. Rossi, and L. Benini, “YodaNN: An Ultra-Low Power Convolutional Neural Network Accelerator Based on Binary Weights,” in ISVLSI, 2016. [136] K. Ando, K. Ueyoshi, K. Orimo, H. Yonekawa, S. Sato, H. Nakahara, M. Ikebe, T. Asai, S. Takamaeda-Yamazaki, and M. Kuroda, T.and Motomura, “BRein Memory: A 13-Layer
32
[137] [138] [139] [140] [141] [142]
[143] [144] [145] [146] [147] [148] [149]
[150] [151] [152] [153]
[154] [155] [156]
[157]
[158] [159]
4.2 K Neuron/0.8 M Synapse Binary/Ternary Reconfigurable In-Memory Deep Neural Network Accelerator in 65nm CMOS,” in Symp. on VLSI, 2017. D. Miyashita, E. H. Lee, and B. Murmann, “Convolutional Neural Networks using Logarithmic Data Representation,” arXiv preprint arXiv:1603.01025, 2016. A. Zhou, A. Yao, Y. Guo, L. Xu, and Y. Chen, “Incremental Network Quantization: Towards Lossless CNNs with Lowprecision Weights,” in ICLR, 2017. W. Chen, J. T. Wilson, S. Tyree, K. Q. Weinberger, and Y. Chen, “Compressing Neural Networks with the Hashing Trick,” in ICML, 2015. J. Wu, C. Leng, Y. Wang, Q. Hu, and J. Cheng, “Quantized convolutional neural networks for mobile devices,” in CVPR, 2016. J. Albericio, P. Judd, T. Hetherington, T. Aamodt, N. E. Jerger, and A. Moshovos, “Cnvlutin: ineffectual-neuron-free deep neural network computing,” in ISCA, 2016. B. Reagen, P. Whatmough, R. Adolf, S. Rama, H. Lee, S. K. Lee, J. M. Hern´andez-Lobato, G.-Y. Wei, and D. Brooks, “Minerva: Enabling low-power, highly-accurate deep neural network accelerators,” in ISCA, 2016. Y. LeCun, J. S. Denker, and S. A. Solla, “Optimal Brain Damage,” in NIPS, 1990. S. Han, J. Pool, J. Tran, and W. J. Dally, “Learning both weights and connections for efficient neural networks,” in NIPS, 2015. T.-J. Yang, Y.-H. Chen, and V. Sze, “Designing Energy-Efficient Convolutional Neural Networks using Energy-Aware Pruning,” in CVPR, 2017. “DNN Energy Estimation,” http://eyeriss.mit.edu/energy.html. R. Dorrance, F. Ren, and D. Markovi´c, “A scalable sparse matrix-vector multiplication kernel for energy-efficient sparseblas on FPGAs,” in ISFPGA, 2014. S. Han, X. Liu, H. Mao, J. Pu, A. Pedram, M. A. Horowitz, and W. J. Dally, “EIE: efficient inference engine on compressed deep neural network,” in ISCA, 2016. A. Parashar, M. Rhu, A. Mukkara, A. Puglielli, R. Venkatesan, B. Khailany, J. Emer, S. W. Keckler, and W. J. Dally, “Scnn: An accelerator for compressed-sparse convolutional neural networks,” in ISCA, 2017. W. Wen, C. Wu, Y. Wang, Y. Chen, and H. Li, “Learning structured sparsity in deep neural networks,” in NIPS, 2016. S. Anwar, K. Hwang, and W. Sung, “Structured pruning of deep convolutional neural networks,” ACM Journal of Emerging Technologies in Computing Systems, vol. 13, no. 3, p. 32, 2017. J. Yu, A. Lukefahr, D. Palframan, G. Dasika, R. Das, and S. Mahlke, “Scalpel: Customizing dnn pruning to the underlying hardware parallelism,” in ISCA, 2017. H. Mao, S. Han, J. Pool, W. Li, X. Liu, Y. Wang, and W. J. Dally, “Exploring the regularity of sparse structure in convolutional neural networks,” in CVPR Workshop on Tensor Methods In Computer Vision, 2017. J. S. Lim, “Two-dimensional signal and image processing,” Englewood Cliffs, NJ, Prentice Hall, 1990, 710 p., 1990. F. Chollet, “Xception: Deep Learning With Depthwise Separable Convolutions,” CVPR, 2017. A. G. Howard, M. Zhu, B. Chen, D. Kalenichenko, W. Wang, T. Weyand, M. Andreetto, and H. Adam, “Mobilenets: Efficient convolutional neural networks for mobile vision applications,” arXiv preprint arXiv:1704.04861, 2017. F. N. Iandola, M. W. Moskewicz, K. Ashraf, S. Han, W. J. Dally, and K. Keutzer, “SqueezeNet: AlexNet-level accuracy with 50x fewer parameters and