JoËao B. Rocha-Juniorâ, Akrivi Vlachou, Christos Doulkeridis, and Kjetil NørvÃ¥g. Department of Computer and Information Science. Norwegian University of ...
Efficient Processing of Top-k Spatial Preference Queries ∗
Joao ˚ ˜ B. Rocha-Junior , Akrivi Vlachou, Christos Doulkeridis, and Kjetil Nørvag Department of Computer and Information Science Norwegian University of Science and Technology (NTNU) Trondheim, Norway {joao,vlachou,cdoulk,noervaag}@idi.ntnu.no
ABSTRACT Top-k spatial preference queries return a ranked set of the k best data objects based on the scores of feature objects in their spatial neighborhood. Despite the wide range of location-based applications that rely on spatial preference queries, existing algorithms incur non-negligible processing cost resulting in high response time. The reason is that computing the score of a data object requires examining its spatial neighborhood to find the feature object with highest score. In this paper, we propose a novel technique to speed up the performance of top-k spatial preference queries. To this end, we propose a mapping of pairs of data and feature objects to a distance-score space, which in turn allows us to identify and materialize the minimal subset of pairs that is sufficient to answer any spatial preference query. Furthermore, we present a novel algorithm that improves query processing performance by avoiding examining the spatial neighborhood of the data objects during query execution. In addition, we propose an efficient algorithm for materialization and we describe useful properties that reduce the cost of maintenance. We show through extensive experiments that our approach significantly reduces the number of I/Os and execution time compared to the state-of-the-art algorithms for different setups.
1.
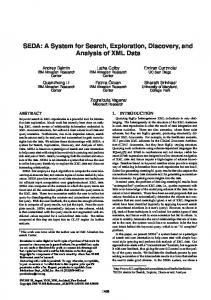
Figure 1: Spatial area containing data and feature objects. For example, Figure 1 presents a spatial area containing data objects p (hotels) together with feature objects t (restaurants) and v (caf´es) with their respective scores (e.g. rating). Consider a tourist interested in hotels with good restaurants and caf´es in their spatial neighborhood. The tourist specifies a spatial constraint (in the figure depicted as a range around each hotel) to restrict the distance of the eligible feature objects for each hotel. Thus, if the tourist wants to rank the hotels based on the score of restaurants, the top-1 hotel is p3 (0.8) whose score 0.8 is determined by t4 . However, if the tourist wants to rank the hotels based on caf´es, the top-1 hotel is p1 (0.9) determined by v2 . Finally, if the tourist is interested in both restaurants and caf´es (e.g. summing the scores), the top-1 hotel is p2 (1.2). Top-k spatial preference queries are intuitive and comprise a useful tool for novel location-based applications. Unfortunately, processing top-k spatial preference queries is complex, because it may require searching the spatial neighborhood of all data objects before reporting the top-k. Due to this complexity, existing solutions are costly in terms of both I/Os and execution time [16, 17]. In this paper, we propose a novel approach for processing spatial preference queries efficiently. The main difference compared to traditional top-k queries is that the score of each data object is defined by the feature objects that satisfy a spatial constraint (for example range constraint). Therefore, pairs of data and feature objects need to be examined to determine the score of an object. Our approach relies on mapping of pairs of data and feature objects to a distance-score space, which in turn allows us to identify the minimal subset of pairs that is sufficient to answer all spatial preference queries. Capitalizing on the materialization of this subset of pairs, we present an efficient algorithm that improves query processing performance by avoiding examining the spatial neighborhood of data objects during query execution. In addition, we propose an efficient algorithm for materialization and describe useful properties that reduce the cost of maintaining the materialized information. In summary, the main contributions of this paper are:
INTRODUCTION
With the popularization of geotagging information, there has been an increasing number of Web information systems specialized in providing interesting results through location-based queries. However, most of the existing systems are limited to plain spatial queries that return the objects present in a given region of the space. In this paper, we study a more sophisticated query that returns the best spatial objects based on the features (facilities) in their spatial neighborhood [16, 17]. Given a set of data objects of interest, a top-k spatial preference query returns a ranked set of the k best data objects. The score of a data object is defined based on the non-spatial score (quality) of feature objects in its spatial neighborhood. On the other hand, the score of a feature object does not depend on its spatial location, but on the quality of the feature object. Such quality values can be obtained by a rating provider (e.g. www.zagat.com). ∗
On leave from the Universidade Estadual de Feira de Santana.
Permission to make digital or hard copies of all or part of this work for personal or classroom use is granted without fee provided that copies are not made or distributed for profit or commercial advantage and that copies bear this notice and the full citation on the first page. To copy otherwise, to republish, to post on servers or to redistribute to lists, requires prior specific permission and/or a fee. Articles from this volume were invited to present their results at The 37th International Conference on Very Large Data Bases, August 29th - September 3rd 2011, Seattle, Washington. Proceedings of the VLDB Endowment, Vol. 4, No. 2 Copyright 2010 VLDB Endowment 2150-8097/10/11... $ 10.00.
93
• We define a mapping of pairs of data and feature objects to the distance-score space that enables pruning of feature objects that do not affect the score of any data object. • We prove that there exists a minimal subset of pairs that is sufficient to answer all top-k spatial preference queries. • We propose an efficient algorithm for processing top-k spatial preference queries that exploits the materialized subset of points.
(a) Range.
(c) Influence.
Figure 2: Examples of partial scores and spatial constraints.
• In addition, we propose an effective algorithm for materialization, and we identify useful properties for cost-efficient maintenance of the materialized information.
to obtain combinations of feature objects of high scores. Then, the aim is to find data objects having the corresponding feature combination with high score in their spatial neighborhood. A more detailed description of the algorithms can be found in Appendix A. In this paper, we study the problem that was originally proposed in [16]. Differently than [16,17], we propose a materialization technique that leads to significant savings in both computational and I/O cost during query processing.
• We show through an extensive experimental evaluation that our algorithm outperforms the state-of-the-art algorithms in terms of both I/Os and execution time. The rest of this paper is organized as follows: In Section 2, we present an overview of the related work. In Section 3, we provide the necessary preliminaries and definitions. In Section 4, we describe the distance-score space and define the minimal set of relevant data and feature objects. Our algorithm for processing spatial preference queries is presented in Section 5. In Section 6, we describe the process of materialization and discuss how maintenance is performed. Finally, in Section 7, we present the experimental evaluation and we conclude in Section 8.
2.
(b) Nearest neighbor.
3.
PRELIMINARIES
Given an object dataset O and a set of c feature datasets {Fi | i ∈ [1, c]}, the top-k spatial preference query [16,17] returns the k data objects {p1 , . . . , pk } from O with the highest score. The score of a data object p ∈ O is defined by the scores of feature objects t ∈ Fi in its spatial neighborhood. Each feature object t is associated with a non-spatial score w(t) that indicates the goodness (quality) of t and its domain of values is the range [0, 1]. The score τ (p) of a data object p is determined by aggregating the partial scores τiθ (p) with respect to neighborhood condition θ and the i-th feature dataset Fi : τ (p) = agg{τiθ (p) | i ∈ [1, c]}. The aggregate function agg can be any monotone function (such as sum, max, min), but we use sum in the following discussion for ease of presentation. The partial score τiθ (p) of p is determined by feature objects that belong to the i-th feature dataset Fi only, and in addition satisfy the user-specified spatial constraint θ. More specifically, the partial score τiθ (p) is defined by the non-spatial score w(t∗ ) of a single feature object t∗ ∈ Fi . This feature object t∗ is the feature object with highest score that satisfies the neighborhood condition θ. The following list provides intuitive definitions of partial score for different neighborhood conditions θ (where d() denotes the distance function):
RELATED WORK
Several approaches have been proposed for ranking spatial data objects. The reverse nearest neighbor (RNN) query was first proposed by Korn and Muthukrishnan [8]. Then, Xia et al. studied the problem of retrieving the top-k most influential spatial objects [15], where the score of each spatial data object p is defined as the sum of the scores of all feature objects that have p as their nearest neighbor. Yang et al. studied the problem of finding an optimal location [4]. The main difference compared to [15] is that the optimal location can be any point in the data space and not necessarily an object of the dataset, while the score is computed in a similar way to [15]. The aforementioned approaches define the score of a spatial data object p based on the scores of feature objects that have p as their nearest neighbor and are limited to a single feature set. Differently, Yiu et al. first considered computing the score of a data object p based on feature objects in its spatial neighborhood from multiple feature sets [16, 17]. To this end, three different spatial scores were defined: range, nearest neighbor, and influence score; and different algorithms were developed to compute top-k spatial preference queries for these scores. The algorithms developed by Yiu et al. assume that the data objects are stored in an R-tree [6] based on spatial attributes, while the feature objects of each feature set are stored in a separate aggregate R-tree (aR-tree) [11]. The proposed algorithms can be divided into three categories. The first category is composed by probing algorithms, namely Simple (SP) and Group (GP) probing. These algorithms need to compute the score of all data objects before reporting the top-k result set. The second category is composed by Branch and Bound (BB) and Branch and Bound Star (BB*) algorithms. These algorithms avoid computing the score of some data objects. The idea is computing an upper bound for each entry of the R-tree of the data objects, and prune the entries whose upper bound is smaller or equal to the score of the k-th data object already found. The third category comprises the feature join (FJ) algorithm. FJ performs a multi-way spatial join on the feature sets
• The range (rng) score of p, given a radius r:
τirng (p) = max{w(t) | t ∈ Fi : d(p, t) ≤ r}
• The nearest neighbor (nn) score of p:
τinn (p) = max{w(t) | t ∈ Fi , ∀v ∈ Fi : d(p, t) ≤ d(p, v)}
• The influence (inf) score of p, given a radius r: τiinf (p) = max{w(t) · 2−
d(p,t) r
| t ∈ Fi }
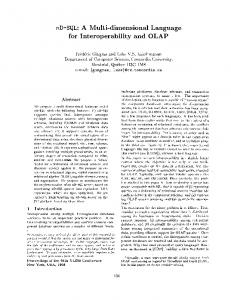
E XAMPLE 1. Figure 2 depicts an example of a set of spatial data objects. The points of feature datasets F1 and F2 are represented with white and black dots respectively, while the data object p ∈ O is represented with a cross mark. We assume that d() is the Euclidean distance without loss of generality, i.e., any other distance function can be applied. In Figure 2(a), for each Fi , the range score of p is the maximum non-spatial score w(t) of the feature objects within distance r from p. P Thus, τ1rng (p) = 0.7, rng τ2 (p) = 0.8, and the score of p is τ (p) = 2i=1 τirng (p) = 1.5.
94
In Figure 2(b), for a given dataset Fi , the nearest neighbor score of p is the non-spatial score of the nearest feature object t ∈ Fi to p. Thus, τ1nn (p) = 0.2, τ2nn (p) = 0.8, and τ (p) = 1.0. In Figure 2(c), the influence score of p is the maximum influence score of all feature objects in Fi . The influence score is computed taking into account the non-spatial score of t that is reduced depending on the distance between t and p. The radius r controls how rapidly the score decreases with distance and in our example we set r = 1.7. 1.4 2.2 4.2 Thus, τ1inf (p)= max{0.2 · 2− 1.7 , 0.7 · 2− 1.7 , 0.4 · 2− 1.7 , 0.9 · 4.5 4.2 4.5 2.2 2− 1.7 } = 0.28, τ2inf (p)= max{0.8·2− 1.7 , 0.6·2− 1.7 , 0.2·2− 1.7 } = 0.33, and τ (p) = 0.61.
4.
(a) Raw space.
(b) Distance-score space.
Figure 3: Mapping to the distance-score space M.
MAPPING TO DISTANCE-SCORE SPACE
d(h′ ) and w(h) ≥ w(h′ ); or w(h) > w(h′ ) and d(h) ≤ d(h′ ). The skyline set Sip is the set of points h ∈ Mip which are not dominated by any other point h′ ∈ Mip .
Top-k spatial preference queries return a ranked set of spatial data objects. The main difference to traditional top-k queries is that the score of each data object p ∈ O is obtained by the feature objects in its spatial neighborhood. Thus, determining the partial score of a data object p based on the feature set Fi requires that the pairs of objects (p, t) with t ∈ Fi need to be examined. Consequently, the search space that needs to be explored to determine the partial score is the Cartesian product between O and FP i . As the total number of pairs with respect to all feature datasets ( ci=1 |O||Fi |) is significantly larger than the cardinality |O| of dataset O, processing top-k spatial preference queries is particularly challenging. In this section, we formally define the search space of the top-k spatial preference queries by defining a mapping of the data objects O and any feature dataset Fi to a distance-score space1 . Then, we prove that only a subset of the pairs (p, t), where p ∈ O and t ∈ Fi , are sufficient to answer all top-k spatial preference queries. This drastically reduces the search space for any given query, thereby saving computational costs significantly. In addition, we prove that this subset of pairs is the minimal subset of pairs necessary. In a preprocessing step, the subset of pairs is computed and stored using a multi-dimensional index. As a result, we avoid computing pairs of the Cartesian product on-the-fly during query processing, leading to an efficient algorithm for processing top-k spatial preference queries. Definitions. We map a pair (p, t), where p ∈ O and t ∈ Fi , to a 2-dimensional space M (called distance-score space) defined by the axes d(p, t) and w(t). Each pair (p, t) is represented by a 2-dimensional point in the distance-score space M.
E XAMPLE 2. Figure 3(a) depicts the spatial neighborhood of data objects p1 and p2 , as well as the feature Fi (black dots), while Figure 3(b) depicts the mapping to the distance-score space M. In particular, the set Mip1 consists of pairs (p1 , t1 ) . . . (p1 , t4 ) and is depicted with circles, whereas the set Mip2 consists of pairs (p2 , t1 ) . . . (p2 , t4 ) and is depicted with black squares. Notice that smaller values are preferable for the distance d(p, t), while higher values are preferable for the non-spatial score w(t). Therefore, the skyline sets of p1 and p2 with respect to Fi are Sip1 ={(p1 , t1 ), (p1 , t2 ), (p1 , t4 )} and Sip2 ={(p2 , t1 ), (p2 , t3 )} respectively. Also notice that pairs that belong to different objects, i.e., p1 , p2 , are incomparable. Theoretical Properties. We proceed with the theorems that prove that Sip is sufficient to obtain the partial score of p and moreover that Sip comprises the minimal set with this property. The proofs of the following theorems can be found in Appendix B. T HEOREM 1. For any spatial preference query, the set Sip is sufficient to determine the partial score τiθ (p) of a data object p ∈ O.
T HEOREM 2. Sip is the minimal set that is sufficient to compute the partial score τiθ (p) of a data object p ∈ O for all spatial preference queries. S We also define the set SiO = ∀p∈O Sip . From Theorem 1, we derive that the set SiO is sufficient to determine the partial score of any point p ∈ O with respect to feature Fi . Thus, maintaining Definition 1. (Mapping of O based on Fi ) The mapping Mi of the sets SiO for all features Fi is sufficient to answer any spatial O based on Fi to the distance-score space M is the set of pairs preference query. Therefore, in a preprocessing phase, we compute Mi = {(p,t) | p ∈ O, t ∈ Fi }. each set SiO and then index SiO using an R-tree RiO , in order to To simplify notation, we denote any pair h=(p, t) ∈ Mi , d(h)=d(p, t) maintain SiO efficiently. Notice that each RiO is a 2-dimensional and w(h)=w(t). Since a point h in the distance-score space M R-tree on the distance-score space. represents a pair (p, t), we use these two terms interchangeably. Furthermore, we present a theoretical estimation of the number of pairs in Mi that satisfy the range constraint of a spatial preferDefinition 2. (Mapping of p based on Fi ) Given a data object ence range query, assuming uniform distribution of objects p ∈ O p ∈ O, the mapping Mip of p based on Fi to M is the subset of and t ∈ Fi and uniform distribution of scores w(t). Even though p p Mi (Mi ⊆ Mi ), such that Mi = {(p,t) | t ∈ Fi }. the data and feature objects are uniformly distributed, the Euclidean distances of objects in the 2-dimensional distance-score space M p In the following, we define the subset of pairs of Mi that constiare approximately χ2 distributed [13]. Let the random variable X p p p tute the skyline set [2] of Mi , denoted as Si = SKY (Mi ). denote the values of d(p, t), then its probability density function is 1 fX (x) = 21/2 Γ(1/2) x−1/2 e−x/2 . We can estimate the number E p Definition 3. (Dominance ≺M ) A point h ∈ Mi is said to domp ′ ′ of pairs in Mi that satisfy the range constraint with radius r (recall inate another point h ∈ Mi , denoted as h ≺M h , if d(h) < that the total number of points in Mi is |O| · |Fi |): 1 Mappings of data points in score-time space have been proposed Z r Z |O| · |Fi | r −1/2 −x/2 for processing continuous top-k [10] and nearest neighbor [1] √ dx E = |O| · |F f x e i| X (x)dx = queries. 2π 0 0
95
Algorithm 1 NextObject(MaxHeap H) 1: INPUT: Max-heap H with entries in descending order of non-spatial
H (line 7) the children entries of e whose distance is smaller or equal to the radius r (line 6). When the next entry is a data point, it is returned as the data point with the highest partial score τiθ () in SiO .
score and radius r.
2: OUTPUT: The next data object in H with highest partial score. 3: Entry e ← remove entry from top of H 4: while e is not a data point do 5: for each entry e′ that is child of e do 6: if d(e′ ) ≤ r then 7: insert e′ into H 8: end if 9: end for 10: e ← remove entry from top of H 11: end while 12: return e
(a) R-tree R1O based on M1 .
E XAMPLE 3. Figure 4(a) shows the R-tree R1O that indexes the set S1O of the feature objects t ∈ F1 depicted in Figure 1. The entries ei of R1O are represented by Minimum Bounding Rectangles (MBRs). For example, the root contains two entries {e1 , e2 }, and e1 contains three data points {(p3 , t4 ), (p2 , t1 ), (p1 , t3 )}. Both the distance d(e) (lower bound) and the score w(e) (upper bound) of an entry e are defined by the upper-left corner of the MBR, for example, d(e1 ) = 1 and w(e1 ) = 0.8. Consider a query with range constraint r = 2. The algorithm prunes the entry e2 , since it does not satisfy the range constraint, and places e1 in H. Then, e1 is expanded and the data points (p3 , t4 ) and (p2 , t1 ) are added in H, while (p1 , t3 ) is pruned. Finally, (p3 , t4 ) is removed from H with score 0.8, and since it is a data point, p3 is returned. The heap H maintains its state for providing access to the next point. NextObject can be adapted with minor modifications for the influence and nearest neighbor scores. For influence score, the radius is only used to compute the score, therefore even feature objects whose distance from a data object is larger than r may contribute to the result set. Thus, line 6 of the algorithm has to be removed for influence score. Notice that H maintains the node entries in descending order of partial score τiθ (), which in this case is defined by the influence score. For nearest neighbor score, NextObject has to be modified to prune pairs (p, t) such that t is not the nearest neighbor of p. For this purpose, during the construction of RiO , such data points are flagged to indicate if t is the nearest neighbor of p in Fi (by a bit 1-if nearest neighbor, 0-otherwise). Similarly, an entry e of RiO is flagged, if at least one of its children entries is flagged. This enables efficient processing, as entries that do not contain a nearest neighbor are immediately pruned. Then, lines 6-8 of Algorithm 1 are modified to first check if the child entry e′ is a nearest neighbor entry, and only then e′ is inserted in H. After these modifications, NextObject is readily employed for range, nearest neighbor and influence score. The SFA Algorithm. SFA (Algorithm 2) computes the top-k spatial preference data objects progressively, by aggregating the partial scores of the data objects retrieved from each R-tree RiO using NextObject algorithm. We use sum as the aggregate function in the following description and in the pseudocode. Each time NextObject is invoked, the data object p with highest partial score τiθ (p) is retrieved from RiO , thus any unseen data object p′ in RiO has a smaller partial score than p (τiθ (p′ ) ≤ τiθ (p)). Therefore, we can compute an upper bound on the score τ (p) of any data object p based on the highest partial scores τiθ (p) of seen data objects in each RiO . SFA employs an upper bound Ui on the score of any unseen object in each heap Hi . Also, for each Hi , a list Li of seen objects is maintained. Moreover, each time an object p is retrieved from Hi for the first time, p’s lower bound on score (p− ) can be updated using the aggregate function (in this case sum). In addition, SFA maintains a list C of candidate data objects that may eventually become top-k results. C is sorted based on descending lower bound on score. In each iteration (line 6), SFA selects one heap Hi (line 7) to retrieve the next data object p (line 8). The upper bound Ui on the score of Hi is set (line 9) based on p’s partial score τiθ (p). Then, if p has not been seen before in Hi , its lower bound p− is updated based on the partial score τiθ (p) and p is added to Li (lines 10-13). Notice that although p may be retrieved again from Hi ,
(b) R-tree R2O based on M2 .
Figure 4: Example showing the contents of RiO . Notice that the range constraint is posed only to the distance independently of the score of the feature objects. The number of pairs E is an upper bound of the objects that are accessed during a spatial preference range query, assuming uniform distribution of the data and the feature objects. In practice, our approach indexes only the set SiO , which is a subset of Mi , and our algorithm takes into account the score of the feature objects to reduce the number of accessed pairs even further. The details on efficient materialization and maintenance of SiO are presented in Section 6, while in the sequel we present the proposed top-k spatial preference query processing algorithm.
5.
QUERY PROCESSING
In this section, we present the Skyline Feature Algorithm (SFA) for processing top-k spatial preference queries. First, we present an algorithm that exploits the distance-score space and returns the data objects in descending order of their partial scores. Then, we present the algorithmic details of SFA, which produces the result of the top-k spatial preference query by coordinating access to the partial scores of data objects. For ease of presentation, in the following, we refer to a pair (p, t), where p ∈ O and t ∈ Fi , as a data point indexed by RiO . Access to Partial Scores. During query processing, the data points in RiO are retrieved sorted in descending order of their partial scores. Furthermore, only node entries of the R-tree RiO that satisfy the spatial constraint are processed. First, we present in details our algorithm for retrieving data points sorted based on the range score (Algorithm 1). Then, we describe the necessary modifications for supporting the influence and nearest neighbor scores. NextObject takes as input the radius r that defines the range constraint and a heap H that contains node entries and data points in descending order of partial score τiθ (). Initially, the heap H contains the root of RiO . Each time, the entry e at the top of the heap H, i.e., with maximum partial score, is retrieved (lines 3,10). As long as e is not a data point (line 4), NextObject inserts in the heap
96
challenge is to compute efficiently and materialize the set SiO in a preprocessing phase and to maintain SiO when updates occur. The proofs of the theorems and the lemmas of this section can be found in Appendix B. Materialization. The straightforward approach for computing the set SiO is to combine each data object p ∈ O with each feature object t ∈ Fi to produce pairs (p, t), and then execute a skyline algorithm to compute the set Sip . This approach is equivalent to first computing the entire set Mip and then computing its skyline, which is prohibitively expensive for large datasets. An alternative approach is for each data object p ∈ O and Fi to execute a dynamic skyline query [12] on the dynamic coordinates d(p, t) and w(t), in order to compute Sip . For each data object, some feature objects can be pruned, but one dynamic skyline query is still required for each data object. Hence, this approach also has a high I/O cost, especially when the cardinality |O| of the object dataset is high. Nevertheless, data objects that are close in space, i.e., their distance is small, have similar distances to any feature object. Therefore, the skyline sets of such objects are also similar with high probability. In order to reduce the number of required dynamic skyline queries (and, in consequence, the I/O cost induced by accessing Fi ), the data objects are partitioned into groups2 , so that the distances of data objects that are in the same group are small. Then, for each group of data points, a dynamic region skyline query is posed (that will be defined in the following) and we will show that the result set is a superset of all skyline sets of data points that belong to the group. Let us assume a group of points and let the region λ be the minimum bounding rectangle that encloses all data points of the group. We denote as maxDist(λ, t) and minDist(λ, t) the maximum and the minimum distance between t and any data object enclosed in λ respectively. For the case that t is enclosed in λ, the minimum distance is zero.
Algorithm 2 SFA(MaxHeap H1 , ..., Hc ) 1: INPUT: Heaps Hi containing the root of RiO . 2: OUTPUT: Top-k spatial preference objects. 3: C ← ∅ // List of seen objects p sorted by lower bound on score p− 4: Li ← ∅ // List of seen objects p from heap Hi 5: Ui ← ∞ // Upper bound on score for each heap Hi 6: while ∃Hi such that Hi 6= ∅ do 7: i ← index of the next input 8: (p, t) ← N extObject(Hi ) // Next unseen object of Hi 9: Ui ← τiθ (p) 10: if p 6∈ Li then 11: p− ← p− + τiθ (p) 12: Li ← Li ∪ p 13: end if 14: if p 6∈ C then 15: C ←C ∪p 16: end if 17: q ← C.peek() //P Object with the best lower bound 18: max ← max∀p∈C,p6=q (p− + ∀j:p∈L // Upper bound / j Ui ) 19: while q − ≥ max do 20: q ← C.pop() 21: report q as next top-k, halt if k objects have been reported 22: q ← C.peek() // Object P with the best lower bound 23: max ← max∀p∈C,p6=q (p− + ∀j:p∈L / j Ui ) 24: end while 25: end while 26: while fewer than k objects have been reported do 27: q ← C.pop() 28: report q as next top-k 29: end while
the maximum τiθ (p) is encountered at the first time, because Hi is accessed in descending order of score. In addition, p is added to the list C of candidate objects (lines 14-16). Then, the upper bound (denoted as max) on the score of any object is computed in line 18. We can safely report as next top-k result, any object q in the top of the list C whose lower bound q − is greater than or equal to max (lines 19-24). SFA continues in the same fashion, until k objects have been reported, or until all heaps are exhausted. In the latter case, if fewer than k objects have been reported, the objects in C are returned based on the sorting of C (because the lower bound now equals to the real score), until we have k objects (lines 26-29).
Definition 4. (Dynamic dominance based on region λ) A feature object t ∈ Fi is said to dynamically dominate another feature object t′ ∈ Fi based on region λ, if maxDist(λ, t) < minDist(λ, t′ ) and w(t) ≥ w(t′ ), or if maxDist(λ, t) ≤ minDist(λ, t′ ) and w(t) > w(t′ ). The dynamic region skyline set DRSiλ of Fi is the set of feature objects t ∈ Fi which are not dynamically dominated by any other feature object t′ ∈ Fi based on region λ.
E XAMPLE 4. Assume a top-1 spatial preference range query with radius r=2 posed on the indexes of Figure 4 and a plain round-robin strategy for accessing the heaps. At the first iterations, p3 and p1 are retrieved from H1 and H2 respectively, with − lower bounds on score p− 3 =0.8 and p1 =0.9, and C = {p1 , p3 }. Since p− < max =1.7, SFA retrieves p2 from H1 , and p− 1 2 =0.6, C = {p1 , p3 , p2 } and max=1.5. Next, SFA retrieves p2 from H2 , p− 2 =1.2 (which is also its real score) and C = {p2 , p1 , p3 }. Now the heaps are empty, because no other object satisfies the range constraint r ≤ 2. Thus, SFA reports p2 as the top-1 object, since p2 is located at the top of C (has the highest lower bound on score).
T HEOREM 3. For any data point p ∈ O enclosed in region λ and for any t ∈ Fi , it holds that if (p, t) ∈ Sip then t ∈ DRSiλ .
The problem of combining partial scores for top-k spatial preference queries is similar to the problem of aggregating ranked inputs [5, 9]. For ease of presentation, we omitted from Algorithm 2 implementation details that result in reducing the number of data objects in the list C and, therefore, also the required number of comparisons (see [9]).
6.
MATERIALIZATION AND MAINTENANCE
Any skyline algorithm that supports dynamic skyline queries can be easily adapted in order to compute the dynamic region skyline DRSiλ by modifying the dominance relationship. Thus, instead of computing the set Sip for each data object p individually, we first compute the set DRSiλ for a region λ. Thereafter, for each data object p enclosed in λ, the set Sip is computed by using only the feature objects in DRSiλ . The gain is that we compute the skyline sets Sip of all data objects enclosed in λ with a single query on Fi , thus reducing I/O cost on Fi . Subsequently, the pairs (p, t) in Sip are inserted in the R-tree RiO ; each of them representing a 2-dimensional point with values d(p, t) and w(t). During the insertion, the pair (p, t) in Sip with the smallest distance d(p, t) is flagged, indicating that t is the nearest neighbor of p. The intermediate entries of RiO that contain a nearest neighbor are also flagged accordingly. Even though any dynamic skyline algorithm and any grouping of the data objects O are applicable for the computation of SiO , in our 2 The grouping of data objects can be performed by applying any space partitioning technique [14] or spatial clustering algorithm [7].
SFA processes top-k spatial preference queries efficiently, when each set of points SiO is stored in an R-tree RiO . The remaining
97
implementation we use an adaptation of BBS [12] for the dynamic region skyline query. Moreover, we partition the data objects O into groups based on the leaf node of the R-tree they belong to. The Rtree is built on the spatial coordinates, thus the objects belonging to the same leaf node tend to be close each other in the space. In the following, we discuss the cost of the materialization. In [12], the number of node accesses of BBS in worst-case is reported to be s · h, where s is the number of skyline points3 and h the height of the R-tree. The theoretical worst-case cost of our materialization is |O|·si ·h (for the basic approach) or |λ|·si ·h (where |λ| denotes the number of regions for the region skyline and si the average size of Sip for p ∈ O). The space required by our materialization is s · |O| for each feature dataset, and it is always bounded by |Fi | · |O|. However, our experiments both with real and synthetic data clearly demonstrate that these costs are significantly smaller in practice. Maintenance. In the following, we discuss the issue of index maintenance in the presence of insertions, deletions and updates of data or feature objects. Insertions and deletions of a data object p ∈ O are relatively straightforward and cost-efficient. When p is inserted in O, each index RiO must be updated by inserting the skyline points Sip of the mapping Mip of p based on Fi . If p is deleted, any occurrence of p in an index RiO must also be deleted. Updates of the spatial location of p are handled as a deletion followed by an insertion. The most frequent maintenance operation is update of the score of a feature object. Usually, the score of feature objects (e.g. user ratings) change dynamically, in comparison to the spatial location of a feature object which is more static. In practice, such updates of score are expected to occur more often than updates of the geographic location. The challenge of handling updates of the score of a feature object t ∈ Fi is that such an update can potentially affect all materialized skyline sets SiO . However, we show that we can exploit useful properties of the mapping to distance-score space to drastically reduce the cost of updates. For ease of presentation, we first assume that all feature objects t ∈ Fi have distinct score values. We will drop this restriction later. We define a total ordering T of the feature objects t ∈ Fi based on their scores w(t), such that t precedes t′ if w(t) > w(t′ ). The following lemmas determine when an update of a feature object’s score causes an update to the materialized skyline sets and, hence, to the index RiO .
In the following, we drop the assumption of distinct values in the scores of feature objects. Let us assume a set of feature objects {t′j } ∈ Fi that have the same score w(t′j ). If the score of one of them (denoted as t) changes, we assume that the relative order of t with all other feature objects t′j has changed, therefore we apply repeatedly the basic update operation on the set {t′j }. Similarly, if the updated score of a feature object t becomes equal to the score of another feature object t′ , we assume that the relative order of t and t′ changed, and again apply the basic update operation. Finally, the remaining challenge is to support efficiently insertions and deletions of feature objects. Both operations can be supported by using the feature score update functionality. For the deletion of feature object t, first the score is updated and the new score is set equal to 0. Afterwards, all remaining tuples in RiO that contain t are deleted from the R-tree. Notice that these tuples cannot dominate any other tuple of Mi and therefore, the resulting SiO set is valid. Similarly, for the insertion of a feature object t, the feature object is first inserted with a minimum value of score equal to 0. Then, t is in the skyline set only for data objects that have t as the nearest feature object, compared to any other existing feature object. In order to determine these data objects, a reverse nearest neighbor query [8] on the indexes built on the spatial coordinates can be performed. Alternatively, the RiO index can be used in order to retrieve all pairs that are flagged as nearest neighbor pairs. Then, the distance between the data object and its nearest neighbor feature object is compared against the distance to t. If the distance to t is smaller than the distance to the nearest feature object, then the new pair is inserted and has to be flagged as nearest neighbor pair, whereas the flag of the previous pair must be removed.
7.
L EMMA 1. Let t ∈ Fi denote a feature object whose score w(t) is updated. If the ordering T of feature objects is not altered, all materialized skylines Sip are valid ∀p ∈ O.
7.1
L EMMA 2. Let t ∈ Fi denote a feature object whose score w(t) is updated, and let t′ ∈ Fi denote the only feature object whose relative order with t changes in the ordering T of feature objects. Then, ∀p ∈ O such that (p, t) ∈ / Sip and (p, t′ ) ∈ / Sip , the p skyline set Si is still valid after the update.
Experimental Settings
We conduct experiments using both synthetic and real datasets. First, we perform experiments using uniform distribution (UN) for the spatial locations of data and feature objects and for the score of the feature objects (within the range [0, 1]). We also generate a synthetic dataset (CN) that resembles the real world: (1) there exist multiple city centers (centroids) with higher occurrences of data objects, (2) there exists a higher probability of finding feature objects nearby the city centers (centroids). Appendix C.1 provides a detailed description of CN including a plot of a generated dataset. We use the synthetic dataset (CN) as our default dataset. By default, the non-spatial score of the feature objects is a uniformly generated value within the range [0, 1]. In addition, we evaluate also score values that follow the exponential distribution (Appendix C.3). In Appendix C, we provide a table that contains the parameters and values used in the experimental evaluation, the description and more experimental results of the real dataset, and we evaluate the cost of materialization.
A direct consequence of Lemma 2 is that an update of a feature object’s t score only affects a limited number of points (pairs) in SiO . We call a basic update operation the update of RiO based on score of feature t whose relative order changes only with one feature object t′ in T . For this basic update operation, any data object p such that (p, t) ∈ Sip or (p, t′ ) ∈ Sip before the update, has to be examined and tested if (p, t) ∈ Sip and (p, t′ ) ∈ Sip after the update. Then, an arbitrary update of the score of a feature object t can be supported by applying repeatedly the basic update operation to consecutive feature objects in the ordering T , until the correct ordering is obtained. 3
EXPERIMENTAL STUDY
In this section, we evaluate our proposed algorithm (SFA) and we compare SFA against the algorithms developed by Yiu et al. [16, 17], denoted as GP, BB, BB*, and FJ. All algorithms were implemented in Java and executed on a PC with 3GHz Dual Core AMD Processor with 2GB RAM. The datasets were indexed by an R-tree (aR-tree for [16, 17]) with block size of 4KB. We used an LRU memory buffer with a fixed size of 0.2% of the size of the total number of objects stored in O and Fi . We report the average values of 20 experiments, and in each experiment we recreate all datasets and indexes to factor out the effects of randomization. In all experiments, we measured the total execution time (referred to as response time) and number of I/Os. All charts are plotted using a logarithmic scale on the y-axis.
We refer to [3, 18] for estimation models of skyline cardinality.
98
BB BB*
GP FJ
10M
SFA
BB BB*
GP FJ
1M
100K
100K
100K
10K
I/O
1M
10K 1K
1K
100
100
100
10 10
20
30
40
10
20
BB BB*
GP FJ
30
40
50
10
10K
SFA
1K
10K
SFA
1K
1 0.1
10 1
1
0.01
0.01
0.01
0.001
0.001
40
50
10
20
Number of results (k)
(d) UN.
SFA
0.1
0.001 30
BB BB*
GP FJ
10
0.1
20
50
100 Time (s)
Time (s)
100
10
40
(c) RL.
BB BB*
GP FJ
30
Number of results (k)
(b) CN.
100
10
20
Number of results (k)
(a) UN. 1K
SFA
10
50
Number of results (k)
10K
BB BB*
GP FJ
10K
1K
10
Time (s)
10M
SFA
1M
I/O
I/O
10M
30
40
50
10
20
Number of results (k)
30
40
50
Number of results (k)
(e) CN.
(f) RL.
Figure 5: Effect of different data distributions {UN,CN,RL} on I/O and response time (range score).
Query Processing Performance
10M 1M
Range Score. In Figure 5, we use our default setup and study the number of I/Os and the response time for all datasets, while varying k. Figure 5(a) presents the I/O cost using the UN dataset. The performance of GP is stable because it always computes the score of all data objects. FJ requires a much higher number of I/Os, as it needs to access many leaf entries of the feature R-trees in order to report the correct top-k result set. The branch-and-bound algorithms (BB and BB*) perform slightly better than GP for this setup. However, SFA results in one order of magnitude fewer I/Os than the best of its competitors. In Figure 5(b), we plot the number of I/Os for the CN dataset. BB* performs better than GP, BB, and FJ due to the employed pruning. However, SFA reduces even further the number of required I/Os compared to BB* and scales better than BB* for increasing value of k. In Figure 5(c), the I/O cost for the real dataset (RL) is presented. Again, SFA outperforms all other algorithms (in terms of I/Os) by at least one order of magnitude. This experiment indicates that SFA performs efficiently for a wide range of different datasets. Figures 5(d), 5(e) and 5(f) depict the response time for the same experimental setups respectively. In general, we observe that the gain of SFA compared to the other algorithms in terms of response time is even higher than the gain in I/Os (between one and two orders of magnitude). The fast response time of SFA indicates that SFA is suitable for applications involving Web information systems, where the main challenge is to minimize the response time for the user. In the next experiment, we vary the number of features c and evaluate the performance of our algorithm. SFA outperforms all other algorithms both in terms of I/Os (Figure 6(a)) and response time (Figure 6(b)). For a single feature dataset, SFA requires only few I/Os in order to retrieve the top-10 objects. Also, notice that SFA results in very small response time (under one second) even in the case of c=5 feature datasets. On the other hand, FJ does not scale with increasing values of c and has the worst performance of all algorithms for higher values of c. In the following, due to space limitations, we report only the response time, however we observed that the relative trends in I/Os are similar. In Figure 7, we vary different parameters and evaluate the response time of queries with range score. Figure 7(a) depicts the response time with varying radius r. SFA is always faster than all
GP FJ
BB BB*
10K
SFA
1K
I/O
GP FJ
BB BB*
SFA
100
100K
Time (s)
7.2
10K 1K
10 1 0.1
100
0.01
10
0.001 1
2
3
4
Number of feature datasets (c)
(a) I/O.
5
1
2
3
4
5
Number of feature datasets (c)
(b) Response time.
Figure 6: Effect of c on I/O and response time (range score). other algorithms, irrespective of the value of radius. Notice that FJ and BB* perform worse for small radius and improve their performance with increasing radius until a certain point, because for very small radius many objects (or combinations of feature objects) have to be examined in order to identify an object with non-zero score, which can then be used for pruning. This is because most objects have zero score as there exist no feature objects in their neighborhood. Next, we study the scalability of SFA by varying the cardinality of the feature datasets |Fi | (Figure 7(b)) and the cardinality of the object dataset |O| (Figure 7(c)). In Figure 7(b), we notice that increasing |Fi | affects the performance of all algorithms, but not SFA. The main reason is that increasing the size of |Fi | has a small impact on the cardinality of skyline sets Sip . Since SFA materializes pairs that are not dominated, the number of such pairs is not affected significantly by increasing |Fi |. In Figure 7(c), SFA outperforms all algorithms, even though FJ is more stable with increasing |O| than SFA. This is mainly because FJ is sensitive to the cardinality of Fi and not to the size of O. Influence Score. In the following, we evaluate the performance of SFA for processing queries with influence score (Figure 8). We compare our approach against BB and BB*, which support queries with influence score. In Figure 8(a), we vary the number of features c. Notice that computing queries with influence score is very costly for BB and BB*. The main reason is that the influence score limits the pruning capabilities of BB and BB*, therefore they have to search a large area of the space for computing the score of the data objects. SFA, on the contrary, accesses the data objects in decreasing order of influence score, without any significant additional cost compared to the range score. Thus, SFA is more than two orders of
99
1K
BB BB*
GP FJ
10K
SFA
BB BB*
10K
SFA
1K
100 Time (s)
100 Time (s)
GP FJ
1K
10 1
10 1
0.1
0.1
1 0.1
0.01
0.01
0.01
0.001
0.001
40
160
640
2560
50K 100K 200K 400K 800K 1600K Cardinality of the feature dataset Fi
Radius (r)
(a) Varying radius r.
SFA
10
0.001 10
BB BB*
GP FJ
100 Time (s)
10K
(b) Varying |Fi |.
50K
100K
200K
400K
800K 1600K
Cardinality of the object dataset |O|
(c) Varying |O|.
Figure 7: Response time varying different parameters using the CN dataset (range score). magnitude faster than its competitors. In Figure 8(b), we evaluate the effect of varying k. All algorithms show stable performance for varying k and SFA always performs best. Nearest Neighbor Score. In Figure 9, we compare our approach against GP and BB algorithms for processing nearest neighbor queries. There is no implementation of BB* for nearest neighbor queries, and it is not trivial to adapt BB* for these queries. In Figure 9(a), we evaluate the effect of increasing the number of features c. Similar to other experiments where we evaluated the impact of varying c, SFA performs more efficiently. In Figure 9(b), we evaluate the effect of increasing values of k. Again, SFA is two orders of magnitude better than BB and GP regardless of the exact value of k. BB
BB*
10K
SFA
1K
1K
100
100 Time (s)
Time (s)
10K
10 1 0.1
BB
BB*
nitude compared to the state-of-the-art algorithms in most of the setups.
9.
SFA
10 1 0.1
0.01
0.01
0.001
0.001 1
2
3
4
5
10
Number of feature datasets (c)
20
30
40
50
Number of results (k)
(a) Varying c.
(b) Varying k.
Figure 8: Effect of c and k on response time (influence score). GP
BB
10K
SFA
1K
1K
100
100 Time (s)
Time (s)
10K
10 1 0.1
GP
BB
SFA
10 1 0.1
0.01
0.01
0.001
0.001 1
2
3
4
5
Number of feature datasets (c)
(a) Varying c.
10
20
30
40
50
Number of results (k)
(b) Varying k.
Figure 9: Effect of c and k on response time (NN score).
8.
REFERENCES
[1] C. B¨ohm, B. C. Ooi, C. Plant, and Y. Yan. Efficiently processing continuous k-nn queries on data streams. In Proc. of Int. Conf. on Data Engineering (ICDE), pages 156–165, 2007. [2] S. B¨orzs¨onyi, D. Kossmann, and K. Stocker. The skyline operator. In Proc. of Int. Conf. on Data Engineering (ICDE), page 421430, 2001. [3] S. Chaudhuri, N. N. Dalvi, and R. Kaushik. Robust cardinality and cost estimation for skyline operator. In Proc. of Int. Conf. on Data Engineering (ICDE), page 64, 2006. [4] Y. Du, D. Zhang, and T. Xia. The Optimal-Location query. In Proc. of the Int. Symposium on Spatial and Temporal Databases (SSTD), pages 163–180, 2005. [5] R. Fagin, A. Lotem, and M. Naor. Optimal aggregation algorithms for middleware. Journal of Computer and System Sciences, 66(4):614–656, 2003. [6] A. Guttman. R-trees: a dynamic index structure for spatial searching. In Proc. of the Int. Conf. on Management of Data (SIGMOD), pages 47–57, Boston, Massachusetts, 1984. [7] J. Han, M. Kamber, and A. K. H. Tung. Spatial clustering methods in data mining: A survey. Geographic Data Mining and Knowledge Discovery, pages 1–29, 2001. [8] F. Korn and S. Muthukrishnan. Influence sets based on reverse nearest neighbor queries. In Proc. of the Int. Conf. on Management of Data (SIGMOD), pages 201–212, 2000. [9] N. Mamoulis, M. L. Yiu, K. H. Cheng, and D. W. Cheung. Efficient top-k aggregation of ranked inputs. ACM Transactions on Database Systems (TODS), 32(3):19, 2007. [10] K. Mouratidis, S. Bakiras, and D. Papadias. Continuous monitoring of top-k queries over sliding windows. In Proc. of the Int. Conf. on Management of Data (SIGMOD), pages 635–646, 2006. [11] D. Papadias, P. Kalnis, J. Zhang, and Y. Tao. Efficient OLAP operations in spatial data warehouses. In Proc. of the Int. Symposium on Advances in Spatial and Temporal Databases (SSTD), pages 443–459. Springer-Verlag, 2001. [12] D. Papadias, Y. Tao, G. Fu, and B. Seeger. Progressive skyline computation in database systems. ACM Transactions on Database Systems (TODS), 30(1):41–82, 2005. [13] E. Pekalska and R. P. W. Duin. Classifiers for dissimilarity-based pattern recognition. In Proc. of Int. Conf. on Pattern Recognition (ICPR), pages 2012–2016, 2000. [14] H. Samet. The quadtree and related hierarchical data structures. ACM Comput. Surv., 16(2):187–260, 1984. [15] T. Xia, D. Zhang, E. Kanoulas, and Y. Du. On computing top-t most influential spatial sites. In Proc. of the Int. Conf. on Very Large Data Bases (VLDB), pages 946–957, 2005. [16] M. L. Yiu, X. Dai, N. Mamoulis, and M. Vaitis. Top-k spatial preference queries. In Proc. of Int. Conf. on Data Engineering (ICDE), pages 1076–1085, 2007. [17] M. L. Yiu, H. Lu, N. Mamoulis, and M. Vaitis. Ranking spatial data by quality preferences. Transactions on Knowledge and Data Engineering (TKDE), to appear. [18] Z. Zhang, Y. Yang, R. Cai, D. Papadias, and A. K. H. Tung. Kernel-based skyline cardinality estimation. In Proc. of the Int. Conf. on Management of Data (SIGMOD), pages 509–522, 2009.
CONCLUSIONS
In this paper, we present a novel approach for boosting the performance of top-k spatial preference query processing. At the heart of our framework lies a mapping of pairs of data and feature objects to a distance-score space, which enables us to identify the minimal subset of pairs necessary to answer any ranked spatial preference query. By materializing this subset of pairs, we present efficient algorithms for query processing that result in improved performance. Furthermore, we describe an efficient algorithm for materialization and elaborate on useful properties that reduce the cost of maintenance. Our experimental evaluation demonstrates that our approach reduces I/Os and response time by more than one order of mag-
100
Mip such that w(t′ )=max{w(t) | t ∈ Fi : d(p, t) ≤ r} and (p, t′ ) ∈ / Sip . Thus, ∃(p, t) ∈ Sip such that (p, t) ≺M (p, t′ ). This is equivalent to d(p, t) ≤ d(p, t′ ) ≤ r and w(t) ≥ w(t′ ). Hence, t fulfills the range constraint, and since w(t′ ) is the maximum score, it means that w(t)=w(t′ ). This contradicts our assumption that ∄(p, t) ∈ Sip such that w(t)=max{w(t) | t ∈ Fi : d(p, t) ≤ r}. Nearest neighbor score: Let us assume that ∄(p, t) ∈ Sip such that w(t)=max{w(t) | t ∈ Fi , ∀v ∈ Fi : d(p, t) ≤ d(p, v)}. Then, ∃(p, t′ ) ∈ Mip such that w(t′ )=max{w(t) | t ∈ Fi , ∀v ∈ Fi : d(p, t) ≤ d(p, v)} and (p, t′ ) ∈ / Sip . Thus, ∃(p, t) ∈ Sip ′ such that (p, t) ≺M (p, t ). This means that d(p, t) ≤ d(p, t′ ) and since ∀v ∈ Fi : d(p, t′ ) ≤ d(p, v) it means that d(p, t)=d(p, t′ ). Then, based on the dominance definition, w(t) ≥ w(t′ ) and since w(t′ ) is the maximum score, it is a contradiction to the assumption that ∄(p, t) ∈ Sip such that w(t)=max{w(t) | t ∈ Fi , ∀v ∈ Fi : d(p, t) ≤ d(p, v)}. Influence score: Let us assume that ∄(p, t) ∈ Sip such that w(t)=
APPENDIX A. STATE-OF-THE-ART ALGORITHMS The state-of-the-art algorithms [16, 17] assume that the data objects p ∈ O are indexed in an R-tree RO based on spatial attributes. The feature objects of each feature set are stored in a separate aggregate R-tree (aR-tree) aRiF also based on spatial attributes, and in addition each entry of aRiF stores the maximum non-spatial score among all features t in its sub-tree. The aggregate R-tree enables efficient computation of the partial score of a data object p based on Fi . In the sequel, we present a summary of the existing competitor algorithms. Simple (SP) and Group (GP) Probing Algorithms. The Simple Probing (SP) algorithm computes the score of each data object p and maintains the k data objects with highest score in a heap. The Group Probing (GP) algorithm shares the same principles with SP, but instead of computing the score of every data object p separately, it computes the score of a set of objects V concurrently. The set V is composed by all data objects that are in the same leaf-entry of RO . GP reduces I/O by traversing RiF only once for computing the score of the set of objects V . However, GP still requires computing the score of all objects p ∈ O before reporting the top-k objects. Branch and Bound Algorithms (BB and BB*). The Branch and Bound algorithm (BB) avoids computing the score of all objects p ∈ O by computing an upper-bound of the score for each non-leaf entry e of RO . Given an entry e of RO , the upper bound of the score based on Fi is computed by finding the level-1 entries e′ of aRiF that satisfy the spatial constraint, and assigning as an upper bound the highest score of the e′ entries. The entries whose upperbound is smaller than the score of the k-th object already found are pruned. The optimized Branch and Bound algorithm (BB*) improves BB by computing tighter upper-bounds of the scores. BB* relies on the observation that the unknown partial score of an object can be estimated more accurately by using the score of non-leaf entries of aRiF . Therefore, the feature trees aRiF are accessed in a round-robin fashion, resulting in concurrent traversal of all aRiF . The entries of each feature tree aRiF are accessed in descending order of non-spatial score. Thus, BB* computes tighter upper-bounds of the score and identifies earlier than BB whether a data object can be pruned. Feature Join Algorithm (FJ). The Feature Join (FJ) algorithm performs a multi-way spatial join on the feature trees aRiF to obtain combinations of feature points in the neighborhood of some object p ∈ O. The feature combinations are examined in descending order of their score and then data objects p ∈ O are retrieved that have the corresponding feature combination in their neighborhood. In order to compute efficiently feature combinations with high score, FJ combines non-leaf entries of the feature trees aRiF and prunes combinations that either have a score that is smaller than the score of the k-th data object already found or fail to satisfy the spatial constraint (e.g. for range queries, the minimum distance d among the entries is d ≤ 2r). If all entries of the highest score combination are leaf-entries, then the data objects p ∈ O in their spatial neighborhood are retrieved, otherwise the non-leaf entry with the highest score is expanded.
B.
max{w(t) · 2−
d(p,t) r
| t ∈ Fi }. Then, ∃(p, t′ ) ∈ Mip such d(p,t)
that w(t′ )=max{w(t) · 2− r | t ∈ Fi } and (p, t′ ) ∈ / Sip . p ′ Thus, ∃(p, t) ∈ Si such that (p, t) ≺M (p, t ). This is equivalent to d(p, t) ≤ d(p, t′ ) and w(t) ≥ w(t′ ). We derive that d(p,t′ )
d(p,t)
w(t) · 2− r ≥ w(t′ ) · 2− r . Since t′ has the maximum influence score, it means that the influence scores of t and t′ are equal. This contradicts our assumption that ∄(p, t) ∈ Sip such that w(t)=max{w(t) · 2−
d(p,t) r
Sip
| t ∈ Fi }.
Proof of Theorem 2: is the minimal set that is sufficient to compute the partial score τiθ (p) of a data object p ∈ O for all spatial preference queries. P ROOF. It suffices to show that if any pair (p, t) is omitted from Sip , there exists at least one query for which the partial score τiθ (p) of the data object p is not computed correctly. Let us assume that (p, t) ∈ Sip denotes a pair that can be safely omitted from Sip . Since (p, t) belongs to Sip , then ∄(p, t′ ) such that (p, t′ ) ≺M (p, t). Equivalently, ∄(p, t′ ) such that d(p, t′ ) ≤ d(p, t) and w(t′ ) > w(t). Then, assuming a range query with radius r=d(p, t), the partial score τirng (p) of p is equal to w(t), because there exists no feature object t′ that satisfies the range constraint d(p, t′ ) ≤ r = d(p, t) and has a higher non-spatial score w(t′ ) > w(t) than t. Thus, we conclude that no pair (p, t) can be safely omitted from Sip . Proof of Theorem 3: For any data point p ∈ O enclosed in region λ and for any t ∈ Fi , it holds that if (p, t) ∈ Sip then t ∈ DRSiλ . P ROOF. Assume that ∃t ∈ Fi such that (p, t) ∈ Sip and that ′ t ∈ / DRSiλ . Then, ∃t′ ∈ Fi that dynamically dominates t based on region λ. By definition, this means that it holds: (1) maxDist(λ, t′ ) < minDist(λ, t) and w(t′ ) ≥ w(t), or (2) maxDist(λ, t′ ) ≤ minDist(λ, t) and w(t′ ) > w(t). We know that maxDist(λ, t′ ) is an upper bound for any distance d(p, t′ ), hence d(p, t′ ) ≤ maxDist(λ, t′ ). Similarly, minDist(λ, t) is a lower bound of any distance d(p, t), hence minDist(λ, t) ≤ d(p, t). Thus, in case (1) d(p, t′ ) < d(p, t) and in case (2) d(p, t′ ) ≤ d(p, t). In both cases, we derive that (p, t′ ) ≺M (p, t), which contradicts to the assumption (p, t) ∈ Sip .
PROOFS
Proof of Lemma 1: Let t ∈ Fi denote a feature object whose score w(t) is updated. If the ordering T of feature objects is not altered, all materialized skylines Sip are valid ∀p ∈ O.
Proof of Theorem 1: For any spatial preference query, the set Sip is sufficient to determine the partial score τiθ (p) of a data object p ∈ O.
P ROOF. Given any object p ∈ O and a feature object t′ 6= t, the distances d(p, t) and d(p, t′ ) do not change due to the score update. In addition, the order between scores w(t) and w(t′ ) does
P ROOF. Range score: Let us assume that ∄(p, t) ∈ Sip such that w(t)=max{w(t) | t ∈ Fi : d(p, t) ≤ r}. Then, ∃(p, t′ ) ∈
101
10K 1K
BB BB*
GP FJ
10K
SFA
10 1
10 1
0.1
0.1
0.01
0.01
0.001
0.001 10
40
160
640
2560
10
20
Radius (r)
10K
Figure 10: CN data distribution.
30
40
50
Number of results (k)
(a) Range, varying radius r.
x
SFA
100 Time (s)
Time (s)
100
y
BB*
BB
1K
(b) Influence, varying k.
GP
BB
SFA
1K
Time (s)
100
not change, because the ordering T of the feature objects does not change. Hence, the domination relationship between any pair (p, t′ ) and (p, t) cannot change, thus all materialized skyline sets Sip are valid ∀p ∈ O.
0.01 0.001 10
20
30
40
50
Number of results (k)
(c) Nearest neighbor, varying k. Figure 11: Response time for different query types on the real dataset (RL).
P ROOF. Let p denote a data object, Sip its skyline with respect to feature Fi before the update, and (p, t) ∈ / Sip and (p, t′ ) ∈ / Sip . The proof will show that after the update, no pair (p, t) is added to Sip and that no pair is removed from Sip . Since Sip does not contain (p, t′ ), there exists a pair in Sip that dominated (p, t′ ) before and still dominates (p, t′ ) after the update (because the update of t did not influence their scores nor distances from p). Also, as Sip does not contain (p, t), it follows that there existed a pair (p, t1 ) ∈ Sip before the update of t that dominated (p, t). If the score w(t) of t decreased, then obviously (p, t1 ) still dominates (p, t). On the other hand, if w(t) increased, we know that it is now higher than w(t′ ) only, since only the ordering of t and t′ changed in T . Hence, the relative order of t1 and t in T does not change (neither do their distances from p), thus the dominance relationship of (p, t) and (p, t1 ) does not change. As a result, (p, t1 ) still dominates (p, t). This proves that no pair (p, t) is added to Sip . Consequently, we derive that no existing pair in Sip can be removed. This concludes the proof.
the coordinates of a spatial object s (sx , sy ) using random uniform values, and reduce the distance between s and its nearest centroid n (nx , ny ) by a factor of g ∈ [0, 1]. Thus, the spatial location of s is updated to (sx +(nx -sx )*(1-g), sy +(ny -sy )*(1-g)). A new value of g is produced for each spatial object s. The value g is obtained through the following formula g=min(|γ|, 1), where γ is a randomly generated number that follows a Gaussian distribution (µ=0.0 and σ 2 =0.2). Figure 10 depicts an example of a dataset that follows the CN data distribution. The data objects O are represented by a cross mark, while the feature datasets F1 and F2 are represented by white and black dots respectively.
C.2
Results on Real Data
The real dataset (RL) contains information obtained by a travel portal website [17]. The object dataset O contains 11399 camping locations; the feature dataset F1 contains 30921 hotels, where the non-spatial score is the room price; and the feature dataset F2 contains 3848 Wal-Mart stores, where the non-spatial score is the gasoline supply. The points were normalized to [0, 10K]×[0, 10K], and the non-spatial scores are normalized in [0, 1]. In Figure 11, we evaluate the comparative performance of SFA on the real dataset (RL). Figure 11(a) presents the response time for varying the radius r and queries using range score. SFA performs efficiently and is one order of magnitude faster than the other approaches. Figure 11(b) depicts the response time for varying the number of results k using the influence score. BB* performs better than BB and terminates faster, due to its improved pruning. However, SFA outperforms BB and BB* by more than one order of magnitude. Figure 11(c) shows the response time for varying number of results k using the nearest neighbor score. SFA processes efficiently nearest neighbor queries and is two orders of magnitude better than BB and GP.
DATASET DESCRIPTION AND MORE EXPERIMENTAL RESULTS
Table 1 contains the parameters and values used in the experimental evaluation. The default values are presented in bold. Parameter Data distribution Cardinality of O (|O|) Cardinality of Fi (|Fi |) Number of results (k) Number of features (c) Query range (r)
1 0.1
Proof of Lemma 2: Let t ∈ Fi denote a feature object whose score w(t) is updated, and let t′ ∈ Fi denote the only feature object whose relative order with t changes in the ordering T of feature objects. Then, ∀p ∈ O such that (p, t) ∈ / Sip and (p, t′ ) ∈ / Sip , the skyline set Sip is still valid after the update.
C.
10
Values UN, CN, RL 50K, 100K, 200K, 400K, 800K, 1600K 50K, 100K, 200K, 400K, 800K, 1600K 10, 20, 30, 40, 50 1, 2, 3, 4, 5 10, 40, 160, 640, 2560
Table 1: Parameters and values used in the experiments.
C.3
C.1 Synthetic Dataset (CN)
Using Skewed Non-spatial Score Values
In the next experiment, instead of generating the score values of the feature objects using a uniform distribution, we employ an exponential distribution to evaluate the impact of the score distribution on the performance of SFA. The exponential distribution of scores captures the fact that in several applications the score distri-
The synthetic dataset (CN) is generated to resemble the real world. First, we define a number of centroids (using 5 as default), where the first centroid is positioned in the middle of the space and the others are randomly positioned in [0, 10K] × [0, 10K]. We generate
102
1M
BB BB*
GP FJ
10K
SFA
1K
Dataset Wal-Mart (WM) Hotels (HT) CN UN
SFA
100 Time (s)
100K I/O
BB BB*
GP FJ
10K 1K
10 1
|Fi | 3848 30921 100000 100000
a|Sip | 1.98 4.82 11.26 12.04
d|Sip | 0.58 1.17 2.97 0.22
0.1
100
0.01
10
0.001 0.5
1
1.5
2
2.5
0.5
1
Rate parameter
1.5
2
Table 2: Size of the set SiO for different datasets.
2.5
Rate parameter
(a) I/O.
(b) Response time. 10G
Figure 12: Effect of skewed score values. 100
Basic Region skyline Time (min.)
10M
I/O
1M 100K
10M
1
0.01 0.001 UN.
0.1
HT.
CN.
RL.
Distributions
(a) Size of the index. UN.
Distributions
CN.
WM.
HT.
SFA
0.1
1M
0.01
(a) I/Os for accessing Fi .
100M
100K
0.001 WM.
Basic Region skyline
aR-tree
10
1
1K CN.
100
SFA
10
10K
UN.
aR-tree
1G Size (bytes)
100M
UN.
CN.
RL.
Distributions
(b) Construction time.
Figure 14: Materialization cost for different datasets.
Distributions
(b) Time for computing SiO .
Figure 13: Cost of computing the SiO set.
Then, we study the size of set SiO that needs to be indexed in order to apply the SFA algorithm. Table 2 presents the average size (a|Sip |) and the standard deviation (d|Sip |) of the dynamic skyline set for different datasets. The size of the skyline set depends on the data distribution and, as shown in Table 2, its average size is always small compared to the size of Fi . The average skyline size is smaller for CN than UN, because more feature objects with high score values tend to be positioned near the centroids, which leads to more dominated feature objects and reduces the average size of the dynamic skyline set. In the case of the real datasets Wal-Mart (WM) and Hotels (HT), the size of the skyline is influenced basically by the domain of the non-spatial score. Since the real dataset has fewer discrete values, the dynamic skyline size is smaller. In the next experiment (Figure 14), we examine the space overhead and the overall construction time of SFA compared to the materialization cost of the competitor algorithms that require aggregate R-trees (aR-tree). Figure 14(a) compares the size of the indexes for different data distributions. For the synthetic dataset, we use c=3 features, while the real dataset has c=2 features, WM and HT. The number of indexed objects for the SFA algorithm is P c p i=1 |O| · a|Si |, thus it depends on the cardinality of data objects |O| and the average skyline size a|Sip |. On the other hand, the number P of indexed objects for the competitor algorithms is |O| + ci=1 |Fi |. Figure 14(a) shows that in the case of the real datasets, the space overhead of SFA is very small in practice. In the case of the synthetic datasets, the additional required space is higher, however the significant performance gains of SFA at query processing time clearly outweigh its space overhead. Figure 14(b) depicts the overall time to construct the indexes required by each algorithm. In the case of SFA, the construction time includes the construction of the indexes (R-trees) that are required to process the dynamic skyline queries, the computation time for the set SiO and the insertion time of SiO in the R-tree RiO . The competitor approaches (aR-tree) require only the insertion of the data points in the object R-tree and the feature objects to the aggregate R-trees aRiF . Figure 14(b) shows that the construction time for SFA is increased compared to aR-tree, but the construction of SFA is still fast in practice. More importantly, the index construction cost is a one-time cost, and is expected to be amortized quickly, when the attained gain in the performance of query processing is considered.
bution is usually skewed. In this case, only few feature objects have high scores, while many feature objects have low score values. In this experiment, we vary the rate parameter of the exponential distribution from 0.5 to 2.5. Low values of the rate parameter (i.e., 0.5) indicate that many feature objects have high score values. In contrast, for higher values of the rate parameter, fewer feature objects have high score values. In Figure 12, we plot the I/Os and response time of all algorithms for the skewed score distribution. First, in Figure 12(a), we present the values of I/Os. Comparing to the results of Figure 5(b), which correspond to uniform distribution, we observe that the use of skewed non-spatial scores reduces the I/O cost of SFA and BB*. However, SFA constantly outperforms all algorithms. In terms of response time, in Figure 12(b), SFA is more than one order of magnitude better than all other algorithms independently of the skewness of the score distribution. In general, we observe that only FJ improves slightly its response time for high values of the rate parameter (≥ 2.0), while all other algorithms show similar performance for all values of skewness.
C.4
|O| 11399 11399 100000 100000
Time (min.)
10M
Cost of Materialization
In this section, we evaluate the cost of materialization. First, we evaluate the efficiency of the proposed dynamic region skyline query for computing the SiO set. In Figure 13, we compare the cost of materialization using one dynamic skyline query for each data object against the cost of using the dynamic region skyline query (denoted Region skyline). The datasets O and Fi are indexed by Rtrees and the implementation of the dynamic (region) skyline query relies on BBS [12]. Region skyline executes one dynamic region skyline query Siλ for each leaf-entry (λ) of the R-tree on O and then, uses Siλ for computing the skyline set Sip of any data object p enclosed in λ. Figure 13(a) depicts the I/Os for accessing Fi (the I/Os for accessing O are identical for both approaches). Region skyline reduces the I/Os by more than one order of magnitude compared to Basic. In Figure 13(b), we compare the time for computing SiO . Region skyline is faster than Basic, which demonstrates the efficiency of the employed dynamic region skyline query.
103
0.2 aR-tree
SFA
Relative query/update ratio
100
Time (s)
10 1 0.1 0.01
(mB ), as well as the query time of SFA (qS ) and BB* (qB ). We use spatial preference range queries for computing the query cost. RQUR shows the number of queries per update operation after which SFA is faster than BB*. For instance, if RQUR is equal to x, this means that when the query workload has more than x queries per update, then it is more cost-efficient to use SFA. In Figure 15, we evaluate the cost for inserting new data objects. The insertion time is higher for SFA, as shown in Figure 15(a), but it requires always less than one second. However, in Figure 15(b), RQUR is always less than one, showing that even if the query workload has only one query per update, SFA is faster than BB* for all datasets. Thus, even one query per update suffices to amortize the cost of insertion of data objects. Thereafter, in Figure 16, we evaluate the maintenance cost caused by updates or insertions of feature objects. For the updates of feature objects, we update only the non-spatial score. In more details, the new score is the old score increased by a random value that follows an exponential distribution. We vary the rate parameter of the exponential distribution from 0.5 to 2.5. Small values of the rate parameter lead to more feature objects with high changes of the score. In Figure 16(a), we depict the average update time for feature objects. In general, updates of feature objects are more expensive than insertions of data objects. However, as shown in Figure 16(b) where RQUR is depicted, fewer than two queries per update suffice to amortize the update cost of one feature object, even if the score increases rapidly (rate parameter = 0.5). Thus, we conclude that the additional cost for updating the score of feature objects is negligible, compared to the performance gain achieved during query processing with SFA. Finally, we evaluate the cost of insertion of new feature objects. The spatial location and the score of the new feature objects follow the initial data distribution of each dataset. Figure 16(c) depicts the insertion time of a new feature object for different datasets. Again, it is clear from Figure 16(d) that when the ratio of queries to updates in the query workload is higher than two, SFA is more profitable to employ than BB*. We conclude that the additional cost of insertions for SFA is amortized fast over few queries, due to the high efficiency of query processing of SFA. Notice that the insertion time in our experiments is comparable to the update time, even though it is expected that the insertion time is higher, since during the insertion first the nearest neighbor tuples are retrieved and then an update is performed. Nevertheless, in our experiments the scores of the new feature objects are smaller than the updated score, thus resulting in smaller update time.
0.15
0.1
0.05
0.001
0 UN.
CN.
RL.
UN.
CN.
Distributions
RL.
Distributions
(a) Time.
(b) RQUR.
Figure 15: Cost of inserting data objects in different datasets. 2 aR-tree
SFA
Relative query/update ratio
100
Time (s)
10 1 0.1 0.01
1.5
1
0.5
0.001
0 0.5
1
1.5
2
2.5
0.5
Rate parameter
2
2.5
(b) RQUR for score update. 2
SFA
Relative query/update ratio
aR-tree
10 Time (s)
1.5
Rate parameter
(a) Score update time. 100
1
1 0.1 0.01
1.5
1
0.5
0.001
0 UN.
CN.
WM.
HT.
UN.
Distributions
(c) Insertion time.
CN.
WM.
HT.
Distributions
(d) RQUR for insertion.
Figure 16: Cost of updating the non-spatial score and inserting feature objects.
C.5
Cost of Maintenance
In the following, we evaluate the maintenance of the RiO indexes caused by insertions and updates of both data and feature objects. We provide a comparison of the maintenance cost of SFA to the competitor algorithms (aR-tree). To this end, we measure the time required for performing the update, as well as the relative query/update ratio (RQUR) that shows when the cost of our algoB rithm is amortized compared to BB*. RQUR, defined as mqSB−m , −qS takes into account the maintenance cost of SFA (mS ) and of BB*
104