Graeme Ackland. Department of Physics and Astronomy, University of Edinburgh, UK. Calculating phase boundaries from energy differences is a major ...
RIKEN Review No. 29 (June, 2000): Focused on Large-scale Calculation of Electronic States
Elastic properties as a pointer to phase transitions Graeme Ackland Department of Physics and Astronomy, University of Edinburgh, UK
Calculating phase boundaries from energy differences is a major application of DFT. The main obstacle to a predictive capacity is lack of knowledge of candidate structures. The three approaches to finding them are: educated guesswork, molecular dynamics to simulate the transition mechanism or examination of harmonic properties. Here, we utilise harmonic properties as symmetry signposts toward candidate structures. Mechanical instabilities of the ‘ideal’ crystal structure, are shown to indicate incipient instabilities in lawsonite, perovskites and stishovite. In MgO and CaO, strongly first order systems, softening of particular elastic moduli indicates the symmetry which is broken in forming the high pressure phase.
Introduction A great advantage of computer simulation is its capacity to study extreme conditions beyond what is tractable experimentally. Nowhere is this more relevant than in density functional studies of materials, under extremely high pressure and temperature, such as those present deep in the earth. The central difficulty faced in trying to study the Earth’s mantle and core is that of conducting experiments which will reveal anything relevant to the behaviour of materials under the conditions of extreme temperature and pressure prevalent there. High pressure and temperature anvils which can attain these conditions are now becoming widely available, but these still leave open the problem of actually performing experiments on the sample in situ- for which a transparent anvil material such as diamond 1) is essential. As a consequence much of what is known from experiments about mantle minerals is deduced from samples recovered back to ambient conditions, in some cases naturally e.g. as inclusions in diamonds. Computer simulation offers an attractive way of avoiding these practical problems. If a method could be shown to be reliable at predicting thermodynamic properties of minerals at any temperature and pressure, many gaps in our current knowledge could be plugged. Of particular interest are where and whether phase transitions occur, since these give rise to density discontinuities which can account for known seismic effects, or even alter the convection patterns in the mantle. The methodologies of ab initio simulation using large scale density functional calculations are reviewed extensively in this volume and elsewhere. This article concentrates on applications of the method to phase transitions in minerals. Although some progress has been made in calculating free energy from molecular dynamics,2) static relaxation remains the mainstay of ab initio simulation of the enthalpy of structures. These calculations evaluate the energy and stability of an ‘ideal’, zero temperature crystal in which all atoms are located on their lattice positions. Pressure induced phase transitions can be reliably predicted by evaluating the enthalpy (total energy plus PV) for each phase as a function of pressure: the volume is that which gives the minimum enthalpy.
34
In order to determine minimum enthalpy for a complex crystal structure high pressure, it is necessary to minimise the enthalpy with respect to both internal degrees of freedom and unit cell parameters. This can be done within the density functional framework if forces and stresses can be evaluated. Since strong coupling often exists between internal and unit cell degrees of freedom actually performing this relaxation can be slow. At any pressure, the stable structure is the one which has the lowest minimum enthalpy. The phase transition pressure can also be deduced from the common tangent between curves on a total energy vs volume graph corresponding to the two phases. The transition pressure is given by PT = (F2∗ − F1∗ )/(V1∗ − V2∗ ) where F1 is the Helmholtz free energy for phase 1 (this is identical to the total energy for T = 0). The temperature dependence of the free energy difference determines the slope of the phase boundary in PT space. The ∗ indicates that the quantity is evaluated for the values of internal coordinates and unit cell parameters which minimise the enthalpy at PT in each phase. Since these quantities depend implicitly on PT , one cannot evaluate PT directly from the above equation. Usually equations of state for the two phases are calculated separately, and then compared.
What is a phonon frequency? In comparing calculated and measured phonons, one must be careful about what one is looking at. A phonon is a quantised amount of energy associated with a normal mode of a crystal. The phonon frequency is the frequency of the lattice oscillation associated with that mode. Theoretical calculations of phonons are often made using lattice dynamics, a well known method laid out by Born and Huang 3) which relates the frequency to the second derivative of the potential energy surface. This contains the implicit assumption that the phonons are simple harmonic modes. By contrast, experimental probes of phonons (e.g. inelastic neutron scattering) couple directly to the frequency. If the crystal structure is harmonic, these are equivalent, but soft modes are by definition anharmonic. Where dramatic differ-
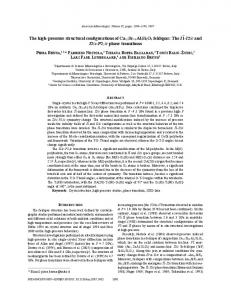
ences exist between the calculated and measured frequencies, the cause is often anharmonicity and an incipient phase transition may be indicated. In the extreme case (see e.g. Fig. 1 for the T1N phonon mode in zirconium) electronic structure calculation may give an imaginary phonon frequency indicating that the ‘ideal’ structure is unstable. In such cases the observed structure is stabilised by high temperature and will undergo a phase transition on cooling, to a low temperature phase whose symmetry differs by the symmetry of the imaginary mode. In the case of zirconium, this transition is from the bcc structure to hcp. Ab initio phonon frequencies can be calculated in two ways. In linear response theory a small perturbation of the ionic positions probes directly the second derivative of the potential energy surface. Here we use an alternative approach in which the restoring forces are calculated by a finite displacement of magnitude comparable to the temperature of interest: this enables us to incorporate some of the effects of anharmonicity.4)
Fig. 1. Phonon dispersion curves in bcc zirconium. The upper figure shows data from neutron scattering (circles), molecular dynamics at 1400 K (dashed line) and lattice dynamics (solid line). The lower figure shows, for the N-point phonon, the DFT calculated energy as a function of phonon amplitude at various lattice parameters (a, quoted in Angstroms). The phonon amplitude is defined as the maximum displacement of the zirconium atom from its ‘ideal’ position expressed as a fraction of lattice parameter. The arrow shows the soft phonon. Note that as the volume is reduced, the energy barrier reduces, showing that the transition temperature is reduced with increasing pressure.5)
Mechanisms for phase transitions: phonons and elastic constants The soft phonon phase transition is one of the best established mechanisms by which a crystal structure can change. In the pressure-induced case, the frequency of a given vibration in the lattice goes to zero as the transition is approached: zero frequency implies that the lattice structure is unstable, and will transform, typically to a lower symmetry phase. An example of this is provided by the stishovite-to-CaCl2 structural transition in SiO2 . Here DFT calculation at high pressure shows the softening of the B1g phonon mode, reaching zero at 86 GPa. This appears to be at variance with the experimental data 6) which shows a transition at 50 ± 3 GPa. In fact, it is the physics which is lacking here: the B1g mode is coupled by symmetry to the (C11 − C12 )/2 shear modulus. DFT calculations of this quantity show that it does indeed go to zero at 49 GPa (see Fig. 2).
Fig. 2. Top: Calculated pressure variation of the calculated elastic moduli in stishovite, in the CaCl2 structure and in columbite. The dashed lines show the tetragonal shear modulus which corresponds to the shear instability observed on the rutile-CaCl2 transition. Bottom: Calculated phonon frequencies in stishovite, in the CaCl2 structure, calculated using the method of finite displacements, and labelled by their symmetry as deduced from the calculation. These calculations were performed by B. B. Karki.7)
35
Although a zero frequency phonon implies a structural instability, only certain specific combinations of elastic moduli – those corresponding to bulk moduli, tetragonal and trigonal shears – give rise to structural instabilities. While unusual, materials with negative elastic moduli do exist.
they do not correspond to the appearance of a mechanical instability in the ‘ideal’ structure (as defined in the introduction above). Rather, at some temperature, the structure has sufficient energy to overcome a total energy barrier between two (or more) symmetry-related variants of the low temperature structure such that the average (observed) structure has higher symmetry.†
Signposts for phase transitions Although in stishovite DFT elucidates both the existence and the mechanism of the transition, in other materials softening elastic constants only suggest possible other phases: For example CaO is known to undergo a B1-B2 transition, and by analogy one might expect MgO to behave similarly. If one draws the unit cells of these structures, a possible path between them can be attributed to a strain corresponding to the C44 elastic constant. Calculating C44 in CaO as a function of pressure (Fig. 3) shows that C44 does indeed soften (in both B1 and B2) as the transition is approached. But it does not go to zero (i.e. it remains mechanically stable) until far beyond the transition pressure. Repeating the same calculation for MgO leads to an almost identical graph for the softening of C44 in B1, with the difference that the pressures involved are almost experimentally intractable-over a thousand GPa. This gives a further strong hint that B2 is worth considering as a potential high pressure phase, and indeed calculation shows softening of the B2 elastic constant toward the transition (Fig. 3).
Lawsonite provides an example of a temperature-induced transition. Lawsonite CaAl2 (Si2 O7 )(OH)2 .H2 O, a mineral which plays an important role in subduction of water into the earth’s mantle.8) It is a framework mineral based on AlO6 octahedra and Si2 O7 groups, with water and calcium coabsorbed into cavities within the framework. Total energies have been calculated for three ‘ideal’ crystal structures corresponding to those observed at increasing temperature. A plot of energy against volume (Fig. 4) shows that only the lowest symmetry P 21 cn structure is stable at any pressure. P 21 cn has no soft modes. However, the high symmetry structures do have soft modes with lowering temperature: their ‘ideal’ structures are mechanically unstable, showing that the observed structure is stabilised by thermal effects. Moreover, the low symmetry structure also has the lowest volume, showing that its range of temperature stability increases as the pressure increases. In practice, calculations suggest that the low temperature/low symmetry phase will not be observed under mantle conditions. Perovskite (MgSiO3 ), 9) which is believed to be the most abundant mineral in the mantle, exhibits similar behaviour. Here again the high-temperature, high-symmetry structure is mechanically unstable, but has been shown to exist in
Fig. 3. Calculated C44 elastic constants for MgO and CaO in the B1 (NaCl) and B2 (CsCl). structures.
Calculating the energy along the path itself, by applying extremely large trigonal shears and calculating the energy, 7) shows a large barrier to transition, indicating that the transition mechanism is not a simple martensitic deformation along it. The elastic modulus calculation here shows the symmetry of the incipient instability. It does not predict the transition pressure: to do this separate calculations of the enthalpy of the two phases have been done. 7) The transition pressures deduced from these calculations of thermodynamic stability are denoted PT in Fig. 3.
Temperature Temperature also provides a mechanism for soft mode phase transitions. Temperature induced transitions are harder to deal with in calculations than pressure induced ones because
36
Fig. 4. Graphs of energy against pressure for ‘ideal’ structures of lawsonite. As is conventional in crystallography, the phases are labelled by their space group symmetries. The fact that the graphs do not cross shows that the Cmcm and Pmcn phases exist only at high temperature. The steeper slopes of Cmcm and Pmcn at lower volumes show that these phases are less favoured (lawsonite will have a higher transition temperature) at high pressure. These calculations were performed by P. K. Ahluwalia. †
The Landau picture of this phenomenon concentrates on the free energy rather than the total energy. The free energy barrier does vanish at the transition.
Fig. 5. Left: Graph showing energies, forces and stresses plotted against the amplitude of the with the soft mode (technically, the M2 rotation mode) in ‘ideal’ perovskite. The phonon amplitude is measured by the fractional displacement of the oxygen atoms. Right: Schematic of the rigid unit mode picture: the cell volume is reduced if the rigid SiO6 octahedra maintain their volume as they rotate. Calculations were performed by M. C. Warren.
ab initio molecular dynamics simulations. Static calculations show that two distinct phonons are unstable. As the temperature is reduced, first one and then another of the temperature-stabilised phonons ‘freezes-in’, giving rise to changes in crystal symmetry. Figure 5 shows the energetics of the coupling between phonon and elastic constant in perovskite. The phonon amplitude is measured by the fractional displacement of the oxygen from its symmetric position. Two cases are considered: the ‘phonon’ in which total energy calculations are carried out without relaxation of the unit cell, and the ‘rigid unit mode’ in which the unit cell is allowed to relax while the volume of the SiO6 octahedra is preserved.10) The first is the appropriate boundary condition for comparison with, e.g., inelastic neutron scattering experiments in the high temperature phase, but a combination of the two is required for predicting the phase transition. Figure 5 also shows that the minimum energy configuration corresponds to a non-zero value of the phonon amplitude: this means that the ideal structure is mechanically unstable. The stress graph (5c) shows that exciting the volumeconserving phonon results in a (bulk) stress on the sample. The induced stress is second order in the phonon amplitude, however it must be relaxed in the phase transition, and this relaxation gives rise to the volume change. The ‘rigid unit’ picture gives a physical interpretation of the phenomenon: SiO6 octahedra are treated as rigid objects with hinged joints at each corner. Although this is an qualitatively appealing picture, as Fig. 5 shows the residual stresses are larger than for the phonon model indicating that
the quantitative change in volume at the transition is smaller than the ‘rigid unit’ model would imply. The calculations suggest that the low temperature structure is likely to be most stable under mantle conditions, however the models for converting from phonon freqencies to phase transition temperatures currently only provide a reliable upper bound, so the possibility that the transformation could occur has not been ruled out. Thus in both lawsonite and perovskite, harmonic calculation of the phonon frequencies in the ideal structure of the high temperature phase reveals that they are imaginary: the instability can be taken as a sign that the crystal structure will undergo a phase transition at low temperature.
Summary We have shown that, across a wide range of systems, calculation of static harmonic properties can give an indication of the phase behaviour of minerals. For pressure driven transitions where the transition mechanism is related to a structural instability, the transition pressure can be accurately calculated by these means. Even when the mechanism is not a soft mode one, the behaviour of the elastic properties can give an indication of the symmetry of the high pressure phase: once the candidate structure has been deduced by this mechanism, the transition pressure can be calculated by enthalpy comparison between the two phases. Finally, temperature driven solid-solid phase transitions can be deduced from the existence of unstable phonon modes in the ‘ideal’ high temperature structure or extremely anharmonic
37
behaviour of phonon modes in the ‘ideal’ low temperature structure. Determining both temperature and pressure stability is crucial in determining whether a mineral will actually be observed in the mantle. As a rule of thumb, most ‘frozen in’ soft modes in silicate minerals arise from a buckling of the framework, with a consequent reduction in volume: thus the low temperature phase is also a high pressure phase.‡ Consequently, as one descends the mantle, the effects of increasing temperature and pressure favour opposite structures, and so either the high symmetry or low symmetry phase can be found. Mantle convection currents arise if the less dense (high symmetry) phase becomes stable below the low symmetry one. Enthalpy comparison, Monte Carlo and molecular dynamics calculations provide accurate free energy comparisons between different crystal structures, consideration of harmonic properties still has a role to play in determining which structures to compare. The calculations in this paper were carried out by Michele Warren, Bijaya Karki, Stewart Clark and Pardeep Ahluwalia, using the CASTEP and CETEP programs developed by the
‡
38
Of course, in some materials a completely separate high pressure phase exists unrelated to any soft mode effects.
UKCP consortium. Their contribution is gratefully acknowledged.
References 1) H. K. Mao and P. M. Bell: Science 203, 1004 (1979). 2) D. Alfe, M. Gillan, and D. Price: Nature 401, 462 (1999); G. de Wijs, G. Kresse, and M. Gillan: Phys. Rev. B 7, 8223 (1998). 3) M. Born and K. Huang: Dynamical Theory of Crystal Lattices, (Oxford University Press, Oxford, 1956). 4) G. J. Ackland, M. C. Warren, and S. J. Clark: J. Phys. CM. 9, 7861 (1997); G. J. Ackland and M. C. Warren: Phase Transitions 61, 215 (1997). 5) U. Pinsook and G. J. Ackland: Phys. Rev. B 59, 13642 (1999) and references therein. 6) M. J. Kingma, R. E. Cohen, R. J. Hemsly, and H. K. Mao: Nature 374, 243 (1995). 7) B. B. Karki, M. C. Warren, L. Stixrude, G. J. Ackland, and J. Crain: Phys. Rev. B 55, 3465 (1997). 8) P. K. Ahluwahlia, G. J. Ackland, S. J. Clark, and G. S. Pawley: submitted to American Mineralogist. 9) M. C. Warren and G. J. Ackland: Phys. Chem. Minerals 23, 107 (1996). 10) M. T. Dove, A. P. Giddy, and V. Heine: Ferroelectrics 136, 33 (1992).