Modeling. Min Li, Joe Nuebel, Member, IEEE, James L. Drewniak, Member, IEEE, Richard E. DuBroff, Senior Member, IEEE,. Todd H. Hubing, Senior Member, ...
IEEE TRANSACTIONS ON ELECTROMAGNETIC COMPATIBILITY, VOL. 42, NO. 3, AUGUST 2000
265
EMI from Airflow Aperture Arrays in Shielding Enclosures—Experiments, FDTD, and MoM Modeling Min Li, Joe Nuebel, Member, IEEE, James L. Drewniak, Member, IEEE, Richard E. DuBroff, Senior Member, IEEE, Todd H. Hubing, Senior Member, IEEE, and Thomas P. Van Doren, Senior Member, IEEE
Abstract—Aperture arrays designed to provide airflow through shielding enclosures can provide part of the coupling path from interior sources to external electromagnetic interference (EMI). In this work, radiation through aperture arrays is investigated numerically and experimentally. FDTD modeling is compared with measurements on aperture arrays in a test enclosure. The method of moments (MoM) is also utilized to study radiation from apertures and to investigate the mutual coupling between apertures in an infinite conducting plane. A simple design equation for the relation between aperture size and number and shielding effectiveness is proposed. Index Terms—Apertures, FDTD methods, moment methods, mutual coupling, shielding.
I. INTRODUCTION
T
HE integrity of shielding enclosures is compromised by slots and apertures for heat dissipation, CD-ROM’s, input/output (I/O) cable penetration, and plate-covered unused connector ports, among other possibilities. Radiation from slots can usually be minimized with electromagnetic gasketing. However, it is more difficult to mitigate the radiation from intended apertures. Enclosures for high-speed digital designs use perforated metal sheets instead of large open apertures for airflow and heat dissipation. Heat dissipation requirements place a lower bound on the size of the apertures in the perforation pattern. That can lead to electromagnetic interference (EMI) problems at high frequencies. Considerable work has been done in the study of energy coupling from an enclosure through one aperture [1]–[6], as well as the diffraction of electromagnetic waves from perforated aperture arrays [7]–[11], though investigations of coupling between cavity modes and aperture arrays are limited. Further, a closed-form expression or empirical approach for airflow aperture array design is desirable for quick engineering calculations. Proper design of airflow aperture arrays is critical in minimizing EMI from enclosure designs for high-speed digital systems. Manuscript received December 11, 1998; revised February 28, 2000. This work was supported by the EMI Consortium at the University of Missouri-Rolla. M. Li was with the University of Missouri-Rolla, Rolla, MO 65409 USA. She is now with the Engineering Research Center, Lucent Technologies, Princeton, NJ 08542 USA. J. Nuebel is with the Electromagnetic Compatibility Group, Sun Microsystems, Palo Alto, CA 94303 USA. J. L. Drewniak, R. E. DuBroff, T. H. Hubing, and T. P. Van Doren are with the Department of Electrical and Computer Engineering, University of MissouriRolla, Rolla, MO 65409 USA. Publisher Item Identifier S 0018-9375(00)06643-6.
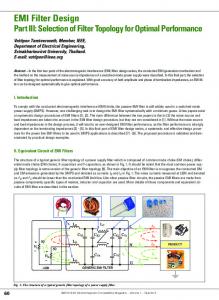
Fig. 1.
The geometry of the test enclosure.
A rectangular test enclosure with a number of interchangeable front faces to accommodate different aperture arrays was investigated experimentally and with FDTD modeling. MoM modeling was also utilized to study the nature of aperture radiation as a function of mutual coupling between individual apertures. The modeling results from three aperture arrays were corroborated with measurements. A simple design equation is proposed for relating the EMI from aperture arrays to the size and numbers of the apertures. The design equation agrees well with the measurements and the numerical modeling results. II. MEASUREMENT AND NUMERICAL MODELING PROCEDURES A shielding enclosure mimicking an actual product enclosure for a file server is shown in Fig. 1. The interior dimensions of the enclosure were 40 cm 20 cm 50 cm. One-inch copper tape with a conductive adhesive was used as an electromagnetic seal along the interior seams. The enclosure was constructed of five pieces of 0.635-cm-thick aluminum, and one plate of 0.1-cm-thick aluminum. The 0.1-cm-thick plate was used for the face containing the aperture array (except in the case of the smallest aperture array where a 0.165-cm-thick aluminum plate was used to facilitate machining). Three aperture arrays, with aperture sizes of 1 cm 1 cm, 1.5 cm 1.5 cm, 2.05 cm 2.05 cm, and edge-to-edge spacings of 0.5 cm, 1.0 cm, 1.0 cm, respectively, were investigated experimentally. The 2.05 cm
0018–9375/00$10.00 © 2000 IEEE
266
Fig. 2.
IEEE TRANSACTIONS ON ELECTROMAGNETIC COMPATIBILITY, VOL. 42, NO. 3, AUGUST 2000
The five aperture array geometries studied.
aperture size, as opposed to a 2 cm aperture size, was chosen due to restrictions on the geometry in the FDTD modeling. The total number of apertures in these three aperture arrays was 252, 112, and 60, respectively. A terminated feed probe at cm, cm was employed as an excitation source. The center conductor of the probe was extended to span the width of the cavity with a 0.16-cm-diameter wire and terminated on the opposite cavity wall with a 1206 package size surface-mount (SMT) nominal 47 resistor soldered to a 1.5 in 1.5 in square lossy of conductive adhesive copper tape. A layer of 110 material (Milliken) with a thickness of approximately 1 cm was cm wall to reduce the of the enplaced against the closure, which unloaded is artificially high as compared to an enclosure loaded with electronics. -parameters and radiated EMI measurements were performed in a 3-m anechoic chamber. Two-port -parameters were measured with a Wiltron 37 247A network analyzer. Port 1 was connected to the interior source in the enclosure under test, and Port 2 was connected to a log-periodic dipole array (200 MHz–5 GHz) receiving antenna. The network analyzer was placed outside the anechoic chamber to measure the reand the transmission . The power delivered flection through [12] to the enclosure is related to (1) is the source voltage and is the source impedance where as well as the characteristic impedance of the coaxial cable. In this particular case, the source voltage was scaled to 1 mV and
the source impedance equaled the characteristic impedance (50 ) of the coaxial cable connected to Ports 1 and 2. The available power was then 2.5 nW. Far-zone electric field measurements were made with a separation of 3 m between the enclosure and the receiving antenna. The far-zone electric field provides a quantitative measurement of the levels of EMI and is related to the -parameters by [13]
AF
(2)
where AF is the antenna factor of the receiving antenna, and is the incident voltage at Port 1, which was 0.5 mV for the scaled 1 mV source with a 50 source impedance. From the relation between delivered power and far-zone fields, the coupling of EMI from the shielding enclosure can be studied. The finite-difference time-domain (FDTD) method was employed to model the test enclosure excited by a terminated feed probe. Two additional aperture arrays, with aperture sizes of 2.5 cm 2.5 cm, and 3 cm 3 cm, edge-to-edge aperture spacings of 1.5 and 2.0 cm and aperture numbers of 44 and 28, respectively, were also studied in the FDTD modeling in addition to the geometries considered experimentally. Partial patterns of the five aperture arrays are shown in Fig. 2. Except in the case of the 2.05 cm 2.05 cm apertures, a cell size of 0.5 0.5 cm 1.0 cm was used for all FDTD modeling. For the 2.05 cm 2.05 cm aperture case, a computational cell size of 0.5125 cm 0.5125 cm 1.0 cm was used. Based upon the enclosure dimensions shown in Fig. 1, the total number of computational cells required for the FDTD modeling is approximately 650 000. Further reducing cell size to 0.25 cm 0.25 cm 1.0 cm will result in a total cell
LI et al.: EMI FROM AIRFLOW APERTURE ARRAYS IN SHIELDING ENCLOSURES—EXPERIMENTS, FDTD AND MoM MODELING
number of approximately 1 800 000 [where the space between the enclosure and perfectly matched layers (PML) remained the same]. Aluminum plates were modeled as perfect electric conducting (PEC) surfaces by setting the tangential electric fields to zero on the cavity walls. The wire feed-probe was modeled using a thin-wire algorithm [14]. The source was modeled by a simple voltagesource ,witha50 resistanceincorporatedintoasingle cell at the feed point. The magnetic fields circling the source were modeled in the same fashion as a thin wire to give the cross section of the source a specified physical dimension [15]. The resistor was modeled as a lumped element using a subcellular algorithm [16]. The width of the SMT resistor is approximately that of the feed wire diameter, and the physical cross-section dimensions were modeled with the same diameter as that of the feed wire by modifying the magnetic field components circling the SMT in the same fashion as for the source. The lossy material was simply modeled by a one-cell layer of conducting material with a conS/cm. For the electric field components ductivity of S/cm inside the conducting layer, a conductivity of S/cm was was employed, while a conductivity of employed for the components on the interface of the conducting layer and free space [14]. PML absorbing boundary conditions were employed for the three-dimensional (3-D) FDTD modeling [17]. The PML absorbing layers were four cells away from the conducting planes without the apertures and eight cells away from the conducting plane containing the apertures. In order to reduce the computation time, 10 000 time steps are recorded in all the FDTD modeling and an additional 80 000 steps are extrapolated using Prony’s method [18]. The accuracy of the extrapolation is checked by running one FDTD modeling out to 40 000 time steps. The relative deviation between the extrapolation and the FDTD result is less than 2%. The computation time required on a workstation is then reduced from approximately 160 to 20 h. The far-zone field was obtained by applying equivalence theory to the FDTD modeling results. Specifically, the FDTD method was used to calculate the electric and magnetic fields on completely surrounding the FDTD model a virtual surface of the enclosure. From the calculated values of the electric and magnetic fields on this surface, equivalent magnetic and and electric surface current distributions were determined. The far-zone electric and magnetic potentials and were then calculated from these equivalent current distributions [19], [20]. Finally, the frequency-domain far-zone electric field components were found from the fast Fourier transformation of the vector potentials. A considerable number of cells is required in order to accurately model an aperture using FDTD, especially for small apertures, i.e., the apertures considered herein. The FDTD modeling results from the above discretization of 0.5 cm 0.5 cm 1 cm can result in significant inaccuracy for the apertures investigated, especially for the 1 cm 1 cm aperture where there were only four FDTD cells in the aperture. A finer mesh was not practical due to limitations of available computational resources. Therefore, integral equation modeling and the MoM were also utilized to study the radiation from apertures and the mutual coupling between apertures. To simplify the computation in the integral equation formulation, apertures in an infinite conducting plane were investigated. FDTD modeling and MoM
267
were combined herein to study the radiation from shielding enclosures through aperture arrays. The integral equation formulation for apertures in an infinite perfect electric conductor plane is [21] (3) is the incident magnetic field and is where (assuming there is the short-circuited magnetic field for ), i.e., the magnetic field over the aperture no source at is the footprint with an entire conducting plane, and magnetic field scattered from the aperture, is the coordinate in the aperture, and is the angular frequency. Equation (3) can be expressed as
(4) and are the permeability and permittivity of freewhere space, respectively. The vector electric potential is denoted by and is determined from the equivalent magnetic surface in the aperture. The equivalent magcurrent density netic surface current density in the aperture is, in turn, related in the plane of the aperture through to the electric field . Further, using image theory [19] (5) is the aperture area and is the wave number. Equawhere tion (4) can then be discretized and solved using the MoM. Specifically, triangle basis functions and a Galerkin’s procedure were employed herein to solve for the equivalent magnetic in the apertures [22]. The field surface current density strength at a distance of 3 m, using far-field approximations (which is appropriate for the electric field at 3 m for MHz), from the aperture arrays is calculated from as [19] (6) Assuming the footprint of the aperture array is much smaller m, and the apertures are closely spaced than the distance relative to a wavelength (which is generally satisfied), the excan be reduced to pression for (7) is denoted as for each aperture where or aperture array. The radiated electric field strength is then (8) Since the equivalent magnetic surface current density vector in the aperture is directly proportional to radiated EMI, the magcan be used to study the effects of aperture nitude of coupling on EMI.
268
IEEE TRANSACTIONS ON ELECTROMAGNETIC COMPATIBILITY, VOL. 42, NO. 3, AUGUST 2000
Fig. 3. The delivered power for the aperture arrays.
III. COMPARISON
OF
MEASUREMENTS AND NUMERICAL MODELING
Experimental measurements and FDTD modeling were used to investigate the 1.0, 1.5, and 2.05 cm aperture arrays. In addition, FDTD modeling was conducted for the 2.5 and 3 cm aperture arrays. The resulting delivered power scaled to a source voltage of 1 mV is shown in Fig. 3. The thin curves present the modeling results while the thick curves present the results of measurements. Although there are several different thin and thick curves in this figure, the fact that the individual curves are difficult to discern indicates that the measured and modeled results are in close agreement and also indicates that the power delivered at any frequency is relatively independent of the aperture array. In short, the power radiated through the aperture array is a small fraction of the power delivered to the enclosure since the total power delivered to the enclosure includes power dissipated in the lossy material, the source resistance, and wall losses. This observation is confirmed further by the fact that the modeled result for a sealed enclosure for which there is no radiated power agrees well with both the modeled and experimental results for enclosures having apertures. The few discrepancies in this figure resulted in part from an imperfect alignment of the feed probe in the experimental measurements. Misalignment of the feed probe caused the excitation of additional modes not present in the modeled results. Radiated measurements were made to corroborate the modeling on 1.0, 1.5, and 2.05 cm aperture arrays. A comparison between the modeled and radiated electric field measurements is shown in Fig. 4. The effect of a nonzero aluminum plate thickness for the panel containing the aperture array was consid(dB), where ered by using an empirical estimate of is the diameter of a circular hole having an area equal to the area of a single square aperture [24]. If the square aperture has a length of along each side, the correction factor can be written (dB). These factors were calculated as 4.7 dB as for the 1-cm aperture array, 1.9 dB for the 1.5-cm aperture array, and 1.4 dB for the 2.05-cm aperture array, and have been added only to the measured results shown in Figs. 4, 5, 8, and 12. With
Fig. 4. The comparison between measurements and FDTD modeling of aperture arrays in the test enclosure.
the exception of a few frequencies near the cavity mode resonance at 1.0 GHz and at frequencies approaching the high end of the measurements (1.2 GHz), agreement between the scaled measurements and the modeling results was generally within 3 dB for each of the three aperture sizes considered. The larger discrepancies at higher frequencies ( 3 dB) seem to be comparable for all three aperture arrays and may be due to neglecting the frequency dependent characteristic of the lossy material in the FDTD modeling. The shape of the frequency response for the electric field strength is the same for all the aperture arrays, again indicating that the power radiated through the aperture arrays is only a small fraction of the power delivered to the enclosure, and that there are no aperture resonances in the frequency range studied. IV. COMPENSATION IN THE FDTD MODELING FOR COARSE APERTURE DISCRETIZATION Accurate FDTD modeling requires a sufficient number of cells in the aperture to adequately model the field distribution. The number of cells per aperture in the FDTD modeling herein varied from four cells in the 1.0-cm aperture array to 36 for the 3.0-cm aperture array. A compensation procedure, based on a comparison between FDTD and MoM modeling results was, therefore, developed to compensate for the effect of an inadequate number of cells and different cell numbers in the apertures. The MoM modeling approach, as used herein, had over 200 mesh elements per aperture with a finer sampling near the periphery of the aperture. First, a comparison was made between radiated field mea4 cm surements (at 3 m) and FDTD modeling for a 3 cm aperture in a small enclosure with an interior dimension of 22 cm 14 cm 30 cm, as shown in Fig. 5(a). The FDTD modeling was 3 dB below the measurements for a cell size of 0.5 cm 0.5 cm (48 cells per aperture), and 10 dB below the measurement for a cell size of 1 cm 1 cm (12 cells per aperture). In both cases, the cell dimension in the directions perpendicular to the aperture was 1 cm. These results suggest a compensation factor of 3 dB for the 0.5 cm 0.5 cm cell size. The results
LI et al.: EMI FROM AIRFLOW APERTURE ARRAYS IN SHIELDING ENCLOSURES—EXPERIMENTS, FDTD AND MoM MODELING
269
A similar equivalence of the ratios of for the infinite plane and enclosure cases was observed for all of the other aperture sizes as well (although the ratio was in each case different). This suggests that the relation between the relative EMI level and aperture size does not depend on whether the aperture is in an infinite conducting plane or an enclosure face. Therefore, the behavior of the apertures was then studied using MoM for apertures in an infinite conducting plane, where the mesh elements in the aperture were adequate with relatively small computational requirements. Finally, a comparison between the MoM and FDTD modeling for single apertures in an infinite plane was used to correct the FDTD modeling inaccuracy due to inadequate cell numbers in the apertures, relative to the 3-cm aperture. For example, the MoM modeling for a single 1-cm aperture compared with a 3-cm aperture yields cm cm
dB
(10)
dB
(11)
The FDTD modeling for the same case yields cm cm
Fig. 5. Compensating FDTD results for an inadequate cell number in a 3 cm 4 cm aperture in a small cavity. (a) Geometry of the cavity. (b) Comparison between measurements and FDTD modeling.
2
also suggest that the compensation factor is approximately frequency independent. A factor of 3 dB was then employed for the 3 cm aperture in all the FDTD modeling results in this paper (a 0.5 cm 0.5 cm cell size was employed). Second, FDTD modeling was used to calculate the equivafor a single aperlent magnetic surface current density with a ture in an infinite perfectly conducting plane at cm. Results 10-cm-long dipole excitation source at were obtained for all five aperture sizes (1, 1.5, 2.05, 2.5, and 3.0 cm). These FDTD results were subsequently compared with FDTD results for the same set of single apertures located in the of an enclosure. The enclosure middle of the front face dimensions were identical to the dimensions shown in Fig. 1. A comparison between these two sets of FDTD results for the smallest and largest apertures, for example, showed that cm cm
cm cm (9)
Thus, a compensation factor for the FDTD modeling (applicable as well as the far-zone fields) was 29 dB–( 38 dB) to 9 dB for the 1-cm aperture relative to the 3-cm aperture. The same rule was applied to the other aperture sizes. Overall, the compensation factors were 1.0, 2.5, 5.0, and 9.0 dB for the 2.5-, 2.05-, 1.5-, and 1.0-cm apertures as compared to the 3.0-cm aperture. Referring again to the additional 3 dB factor for the 3-cm aperture [shown in Fig. 5(b)], the overall compensation factors were 3.0, 4.0, 5.5, 8.0, and 12.0 dB for the 3.0-, 2.5-, 2.05-, 1.5-, and 1.0-cm apertures, respectively. The FDTD radiated field modeling results as shown in Fig. 4 have already been corrected by these factors. The FDTD results for delivered power were not corrected since the power radiated through the electrically small apertures was small compared to the power lost in the feed probe resistance and in the lossy material in the enclosure. The compensation factors obtained above were based on a double-step comparison. An initial comparison between FDTD modeling and experimental measurements established a 3-dB compensation factor specifically for the case of the 3-cm 0.5-cm FDTD cell in aperture discretized with a 0.5-cm the directions parallel to the aperture edges. A secondary comparison between modeling results from the FDTD and MoM approaches was used to establish additive decibel compensation factors for FDTD results from each of the four smaller sized apertures (2.5, 2.05, 1.5, and 1.0 cm, respectively) relative to the 3-cm aperture. Some further corroboration of these compensation factors can be obtained through a single-step comparison between FDTD modeling and MoM modeling of small apertures in an infinite conducting plane excited by an incident plane wave [23]. The results shown in Fig. 6 compare the frequency independent compensation factors previously obtained with the single-step compensation factors obtained at 0.3 and 1.2 GHz. The single-step
270
IEEE TRANSACTIONS ON ELECTROMAGNETIC COMPATIBILITY, VOL. 42, NO. 3, AUGUST 2000
Fig. 6. Compensation factors based on single-step and double-step comparison.
Fig. 7.
MoM modeling of radiation from a single apeture in an infinite conductor plane with varying aperture size.
compensation factor is frequency independent and the disparity between the single-step and double-step compensation factors is approximately 1 dB or less over the entire range of aperture sizes. These compensation factors, obtained from the study of single apertures, were also applied to FDTD modeling of aperture arrays in a shielding enclosure. Again compensation factors for FDTD modeling were necessary due to inadequate sampling in the apertures. The rationale for using the same set of compensation factors was that the incident wave used herein approximates a normal incidence plane wave on each of the electrically small apertures. If mutual coupling between apertures can be neglected, then the compensation factor
for each aperture should be the same, resulting in the same compensation factors for the aperture array. The significance of mutual coupling for aperture arrays of various sizes will be discussed in the next section. V. DESIGN APPROXIMATION FOR EMI APERTURE ARRAYS
FROM
AIRFLOW
A simple equation for the relation between EMI, aperture size, and the number of apertures is useful in shielding enclosure design. First, the radiation as a function of aperture size for a single aperture was studied. Square apertures with a very fine triangular mesh on the periphery were investigated using
LI et al.: EMI FROM AIRFLOW APERTURE ARRAYS IN SHIELDING ENCLOSURES—EXPERIMENTS, FDTD AND MoM MODELING
271
Fig. 8. The radiation from multiple apertures for 1-cm apertures in the test enclosure.
Fig. 9. The FDTD modeling radiation from aperture arrays compared to a single aperture for different aperture sizes a.
the MoM. The results for a single aperture, varying in size from 1 to 3 cm, are shown in Fig. 7. The three solid curves with symbols are the MoM results at frequencies of 0.5, 1, and 1.5 GHz. in decibels with the reference The vertical scale represents for a single 1-cm aperture at the frebeing the value of quency of 0.5 GHz. The three dotted curves mark the proportionality to the cube of the aperture size . Each dotted curve is chosen to match the value of the corresponding solid curve at an aperture size of 1 cm. These results indicate that a relation is plausible. Since the far-field radiation is proof , the far-field radiation is also proportional to portional to . This result is consistent with Bethe’s small-hole theory for electrically small apertures [1].
Next, the variation in the radiation as a function of the number of apertures was studied. Radiation measurements for an increasing number of 1 cm apertures in an aperture array (9 to 252 apertures) on one face in the test enclosure are shown in Fig. 8, for the frequency range from 0.3 to 1.2 GHz. The results indicate that the radiation is directly proportional to the number of apertures . The aperture size was 1 cm and the aperture spacing was 0.5 cm. The number of apertures was varied by masking a portion of the total aperture array footprint with copper tape. The aperture configurations tested always had the array located symmetrically about the center in the front panel. The apertures were oriented along a constant grid pattern from row-to-row as opposed to being offset by
272
IEEE TRANSACTIONS ON ELECTROMAGNETIC COMPATIBILITY, VOL. 42, NO. 3, AUGUST 2000
(a)
(b)
(c)
(d)
x
Fig. 10. The MoM modeling for (a) two apertures along the direction and (b) the corresponding coupling coefficient and (c) two apertures along the and (d) the corresponding coupling coefficient, with along the direction.
H
x
one-half the spatial periodicity. Offset aperture arrays were also investigated with FDTD modeling and the results for the delivered power and EMI were the same as those for the aperture arrays with no offset, to within 0.5 dB. The frequency range of the measurements was 0.3 to 1.2 GHz. The variation in the radiation as , the number of apertures was found to be uniform over the entire frequency range. (Recall that the apertures are electrically small.) The variation of EMI with was further studied for different aperture sizes using FDTD modeling. The five aperture arrays (from 1 to 3 cm) described above were studied. The radiated field from the aperture arrays in the test enclosure of Fig. 1 relative to the field from a single aperture in the middle of the panel for the frequency range from 0.3 to 1.2 GHz, are shown in Fig. 9. is also shown A comparison curve for EMI proportional to and consists of the single aperture EMI level multiplied by . The general 3-dB deviation is due to an “averaging” factor of due to the span of the total area on the front panel for the aperture array. That is, radiation from the single aperture case came from an aperture located in the center of the panel. The field over the aperture for the modes excited by the long wire
y direction
excitation in the modeled frequency range is a maximum at the center of the panel. However, for the aperture array, radiation came from apertures distributed over the panel with a resulting “averaging” effect. The aperture mutual coupling was also studied with MoM to understand the variation in the radiated field with the number of apertures and the aperture spacing. Here, plane wave incidence was used and several cases were investigated. A coupling for each aperture is defined as coefficient
(12)
refers to the magnetic current integrated over where the aperture for one aperture in an aperture array and refers to a single isolated aperture. The incident magnetic field is in the direction. The apertures are in an infinite conducting . The aperture size is 2 cm 2 cm and the freplane at quency is 1 GHz. In the first case, shown in Fig. 10(a), two
LI et al.: EMI FROM AIRFLOW APERTURE ARRAYS IN SHIELDING ENCLOSURES—EXPERIMENTS, FDTD AND MoM MODELING
apertures are oriented along the direction. The corresponding mutual coupling coefficient is positive and varies with aperture spacing as shown in Fig. 10(b). In this case, the direction of inis perpendicular to the oriduced electrical surface current entation of the apertures. In this orientation, the two apertures present the largest disturbance to the induced electrical surface current. In the second case, shown in Fig. 10(c), the apertures are oriented along the direction and the mutual coupling coefficient, as shown in Fig. 10(d), is negative. In this case, the induced electric current in the conductor plane was parallel to the orientation of the aperture array. Hence, the disturbance to the electrical surface current was less than the disturbance in the previous case. A 3 3 aperture array, as shown in Fig. 11(a), was also investigated to ascertain the coupling effect on the center aperture. The result is comparable to one aperture in a larger aperture array (larger ) since the mutual coupling effects will be dominated (for EMI purposes) by the eight apertures immediately adjacent to the center aperture. The coupling coefficient as a function of aperture spacing is shown in Fig. 11(b). As in the cases illustrated in Fig. 10, the mutual coupling from an aperture with a spacing greater than the size of the aperture (but significantly less than a wavelength) was negligible. The mutual coupling between apertures is generally negligible if the spacing between apertures is not small compared to the aperture size. For the cases studied above, the spacing of half of the aperture size for an aperture array yielded a mutual coupling coefficient of 0.11. For example, the array of 252 aper( is the field tures will generate an EMI of 252 1.11 from an individual aperture when the fringe aperture effect is neglected) compared to the summation of EMI from 252 indi. The difference is only 1 dB. This vidual apertures, or 252 for the EMI from aperture arrays explains the scaling with in the shielding enclosure investigated above and also indicates the limitations of this relationship. As a conclusion, a design approximation for the radiation from aperture arrays in a shielding enclosure is for arrays where the aperture spacing is at least a significant fraction of the aperture size. Additional results, have suggested that aperture arrays with a spacing of one tenth (or more) of the aperture size fit the design approximation to within 3 dB [24]. Fig. 12 shows a final comparison between this design approximation, the results of FDTD modeling (including the previously described compensation factors) for five different aperture arrays, and experimental measurements for three different aperture arrays. VI. SUMMARY AND CONCLUSION In summary, measurements and numerical modeling were utilized to study the radiated fields from aperture arrays in a shielding enclosure. The results show that electrically small apertures do not change the cavity mode resonances of the enclosure, especially when the enclosure is loaded with circuit boards, as is usually the case in design applications, and/or when the enclosure is loaded with other lossy materials. In addition, for loaded enclosures, the presence of these electrically small apertures does not have a significant impact on
273
Fig. 11. The coupling for the aperture in the middle of a nine aperture array. (a) Geometry. (b) Coupling coefficient.
the amount of power delivered to the enclosure, as most of the delivered power is still consumed by losses rather than radiation. Small apertures can present some difficulties in numerical modeling, particularly for those numerical modeling methods which use a computational cell of uniform size. Results based on comparisons between experimental measurements, FDTD modeling, and MoM modeling for electrically small apertures have suggested that there is an error in the far-zone radiated field computed with FDTD modeling with inadequate numbers of computational cells in the aperture. However, at frequencies well below the aperture resonances, this error appears to be nearly frequency independent. Within this frequency range, then, simple additive compensation factors for the radiated field in decibels seem sufficient to bring the FDTD results into general agreement with the measurements. where refers Finally, the design approximation to the number of apertures and refers to the length of each edge of a square aperture, seems to preclude any mutual coupling ef-
274
IEEE TRANSACTIONS ON ELECTROMAGNETIC COMPATIBILITY, VOL. 42, NO. 3, AUGUST 2000
Fig. 12. A comparison of measured results, modeled results, and the design equation prediction.
fects. MoM modeling results were used to explore the validity of this omission. For the range of aperture sizes and aperture spacings considered herein, neglecting the mutual coupling effect was found to introduce an error on the order of 1 dB in the design approximation.
[12] D. M. Pozar, Microwave Engineering. Reading, MA: Addison-Wesley, 1990. [13] D. Morgan, A Handbook for Testing and Measurement. Stevenage, U.K.: Peter Peregrinus, 1994. [14] A. Taflove, Advances in Computational Electrodynamics: The FiniteDifference Time-Domain Method. Boston, MA: Artech House, 1998. [15] D. M. Hockanson, J. L. Drewniak, T. H. Hubing, and T. P. Van Doren, “FDTD modeling of common-mode radiation from cables,” IEEE Trans. Electromagn. Compat., vol. 38, pp. 376–387, Aug. 1996. [16] Y.-S. Tsuei, A. C. Cangellaris, and J. L. Prince, “Rigorous electromagnetic modeling of chip-to-package (first-level) interconnections,” IEEE Trans. Compon. Hybrids Manuf. Technol., vol. 16, pp. 876–882, Dec. 1993. [17] J. P. Berenger, “Perfectly matched layer for the absorption of electromagnetic waves,” J. Comput. Phys., vol. 114, pp. 185–200, Oct. 1994. [18] W. L. Ko and R. Mittra, “A comparison of FD-TD and Prony’s methods for analyzing microwave integrated circuits,” IEEE Trans. Microwave Theory Tech., vol. 39, pp. 2176–2181, Dec. 1991. [19] C. A. Balanis, Advanced Engineering Electromagnetics. New York: Wiley, 1989. [20] R. J. Luebbers, K. S. Kunz, M. Schneider, and F. Hunsberger, “A finite-difference time-domain near zone to far zone transformation,” IEEE Trans. Antennas Propagat., vol. 39, pp. 429–433, Apr. 1991. [21] C. M. Butler, Y. Rahmat-Samii, and R. Mittra, “Electromagnetic penetration through apertures in conducting surfaces,” IEEE Trans. Antennas Propagat., vol. AP-26, pp. 82–93, Jan. 1978. [22] S. M. Rao, D. R. Wilton, and A. W. Glisson, “Electromagnetic scattering by surfaces of arbitrary shape,” IEEE Trans. Antennas Propagat., vol. AP-30, pp. 409–418, May 1982. [23] M. Li, J. L. Drewniak, R. E. DuBroff, T. H. Hubing, and T. P. Van, “FDTD modeling of small apertures using coarse computational cell sizes for airflow array design in shielding enclosures,” IEEE Trans. Electromagn. Compat., to be published. [24] M. Li, “Modeling and design of shielding enclosures for EMI mitigation—Experiments, and finite-difference time-domain and method of moments modeling,” Ph.D. dissertation, Univ. Missouri-Rolla, 1999.
ACKNOWLEDGMENT The authors would like to thank Sun Microsystems for making their 3-m chamber available for radiated EMI measurements. REFERENCES [1] H. A. Bethe, “Theory of diffraction by small holes,” Phys. Rev., vol. 66, pp. 163–182, 1944. [2] R. E. Collin, Foundations for Microwave Engineering. New York: McGraw-Hill, 1996. [3] B. Z. Wang, “Small-hole formalism for the FDTD simulation of small-hole coupling,” IEEE Microwave Guided Wave Lett., vol. 5, pp. 15–17, Jan. 1995. [4] R. Mittra and S. W. Lee, Analytical Techniques in the Theory of Guided Waves. New York: Macmillan, 1971. [5] M. P. Robinson, T. M. Benson, C. Christopoulos, J. F. Dawson, M. D. Ganley, A. C. Marvin, S. J. Porter, and D. W. P. Thomas, “Analytical formulation for the shielding effectiveness of enclosures with apertures,” IEEE Trans. Electromagn. Compat., vol. 40, pp. 240–248, Aug. 1998. [6] F. Olyslager, E. Laermans, D. D. Zutter, S. Criel, R. D. Smedt, N. Lietaert, and A. D. Clercq, “Numerical and experimental study of the shielding effectiveness of a metallic enclosure,” IEEE Trans. Electromagn. Compat., to be published. [7] T. Y. Otoshi, “A study of microwave leakage through perforated plates,” IEEE Trans. Microwave Theory Tech., vol. MTT-20, pp. 235–236, Mar. 1972. [8] C. C. Chen, “Transmission through a conducting screen perforated periodically with apertures,” IEEE Trans. Microwave Theory Tech., vol. MTT-18, pp. 627–632, Sept. 1970. [9] S. Criel, L. Martens, and D. D. Zutter, “Theoretical and experimental near-field characterization of perforated shields,” IEEE Trans. Electromagn. Compat., vol. 36, pp. 161–168, Aug. 1994. [10] K. F. Casey, “Electromagnetic shielding behavior of wire-mesh screens,” IEEE Trans. Electromagn. Compat., vol. 30, pp. 298–306, Aug. 1988. [11] W. Wallyn, F. Olyslager, E. Laermans, D. D. Zutter, R. D. Smedt, and N. Lietaert, “Fast evaluation of the shielding effectiveness of rectangular shielding enclosures,” in IEEE Electromagn. Compat. Symp. Proc., Denver, CO, Aug. 1998.
Min Li was born in China in 1968. She received the B.S. and M.S. degrees in physics from the Fudan University, Shanghai, China, in 1990 and 1993, respectively, both with honors, and the M.S. and Ph.D. degrees in electrical engineering from the University of Missouri-Rolla, in 1996 and 1999, respectively. Since 1995, she has studied and worked in the EMC Laboratory, University of Missouri-Rolla, where her research and education have been supported by Dean’s fellowship and assistantship. She is currently with Lucent Technologies, Princeton, NJ. Her research interests include numerical and experimental study of electromagnetic compatibility problems. Dr. Li is the winner of the 1998 IEEE EMC Society President Memory Award.
Joe Nuebel (M’95) is currently a Staff EMC Engineer at Sun Microsystems, Palo Alto, CA. For over 15 years he has been working in the field of electromagnetic compatibility. His background also includes immunity, safety, and network environment building systems (NEBS) testing for Telco. He also initiated university research at Sun in the area of electromagnetic compatibility to assist in determining possible future electromagnetic compatibility design concepts.
James L. Drewniak (S’85–M’90) received the B.S. (highest honors), M.S., and Ph.D. degrees in electrical engineering, all from the University of Illinois, Urbana-Champaign, in 1985, 1987, and 1991, respectively. In 1991, he joined the Electrical Engineering Department , University of Missouri-Rolla, Rolla, MO, where he is part of the Electromagnetic Compatibility Laboratory. His research interests include the development and application of numerical methods for investigating electromagnetic compatibility problems, packaging effects, and antenna analysis, as well as experimental studies in electromagnetic compatibility and antennas.
LI et al.: EMI FROM AIRFLOW APERTURE ARRAYS IN SHIELDING ENCLOSURES—EXPERIMENTS, FDTD AND MoM MODELING
Richard E. DuBroff (S’74–M’77–SM’84) received the B.S.E.E. degree from Rensselaer Polytechnic Institute, Troy, NY, in 1970, and the M.S. and Ph.D. degrees in electrical engineering from the University of Illinois, Urbana-Champaign, in 1972 and 1976, respectively. In 1976, he held a postdoctoral position in the Ionosphere Radio Laboratory and worked on backscatter inversion of ionospheric electron density profiles. From 1978 to 1984 he was a Research Engineer in the Geophysics Branch of Phillips Petroleum, Bartlesville, OK. Since 1984 he has been affiliated with the University of Missouri-Rolla and is currently a Professor in the Department of Electrical and Computer Engineering.
Todd H. Hubing (S’82–M’82–SM’93) received the B.S.E.E. degree from the Massachusetts Institute of Technology, Cambridge, MA, the M.S.E.E. degree from Purdue University, West Lafayette, IN, and the Ph.D. degree in electrical engineering from North Carolina State University, Raleigh. He is currently a Professor of Electrical Engineering, University of MissouriRolla, and one of the principal faculty in the UMR Electromagnetic Compatibility Laboratory there. Prior to joining the faculty at the University of Missouri-Rolla in 1989, he was an EMC Engineer at IBM, Research Triangle Park, NC. He has authored or presented more than 70 technical papers, presentations, and reports on electromagnetic modeling and EMC-related subjects. He also writes the satirical “Chapter Chatter” column for the IEEE EMC Society Newsletter. Since joining the University of Missouri-Rolla, the focus of his research has been on measuring and modeling sources of electromagnetic interference. Dr. Hubing is on the Board of Directors for the IEEE EMC Society.
275
Thomas P. Van Doren (S’60–M’69–SM’96) received the B.S., M.S., and Ph.D. degrees from the University of Missouri-Rolla in 1962, 1963, and 1969, respectively. From 1963 to 1965, he served as an Officer in the U.S. Army Security Agency. From 1965 to 1967 he was a Microwave Engineer with Collins Radio Company, Dallas, TX. Since 1967 he has been a member of the electrical engineering faculty at the University of Missouri-Rolla, where he is currently a Professor. He has taught short courses on electromagnetic compatibility to over 10 000 engineers and technicians representing 200 corporations. His research interests concern developing circuit layout, grounding, and shielding techniques to improve electromagnetic compatibility. Dr. Van Doren received the 1995 IEEE EMC Society Richard R. Stoddard Award for his contributions to EMC research and education. He is a Registered Professional Engineer in the state of Missouri and a member of Eta Kappa Nu, Tau Beta Pi, and Phi Kappa Phi.