Empirical Observations of Dynamic Traffic Flow Phenomena on a German Autobahn Robert L. Bertini Department of Civil & Environmental Engineering Portland State University P.O. Box 751 Portland, OR 97207-0751 Phone: 503-725-4249 Fax: 503-725-5950 Email:
[email protected]
Roger V. Lindgren Department of Civil Engineering & Geomatics Oregon Institute of Technology 3201 Campus Drive Klamath Falls, OR 97601 Phone: 541-885-1947 Fax: 541-885-1654 Email:
[email protected]
Dirk Helbing Institute for Economics and Traffic Dresden University of Technology D-01062 Dresden, Germany Phone: +49-351-463-36802 Fax: +49-351-463-36809 Email:
[email protected]
Martin Schönhof Institute for Economics and Traffic Dresden University of Technology D-01062 Dresden, Germany Phone: +49-351-463-36721 Fax: +49-351-463-36809 Email:
[email protected]
Submitted to the 16th International Symposium on Transportation and Traffic Theory University of Maryland, College Park April 30, 2004
Bertini, Lindgren, Helbing and Schönhof
2
INTRODUCTION The spatio-temporal evolution of traffic from freely flowing to congested conditions and from congested to freely flowing conditions was studied along a 30-km section of a German Autobahn. Several bottlenecks were identified by systematically examining the excess vehicle accumulation (spatial) and excess travel time (temporal) that arose between measurement locations. Bottlenecks became active in the vicinity of on-ramps and off-ramps on this section of freeway. For example, it is shown here that a bottleneck occurred at the crest of a vertical grade approximately 1300 m upstream of a major off-ramp. Further, the evolution of a steady shock of low flow and relatively short duration was traced over a 16 km distance. Its cause is not known definitively, but some indications of its formation were revealed. It is also shown that once a bottleneck is identified, its queue discharge flow was reproducible across multiple activations. This is different than some past research that has identified bottlenecks (for example using speed thresholds), and that has reported that a particular bottleneck’s discharge flows varies widely from activation to activation. The analysis tools used were transformed curves of cumulative vehicle count and cumulative time-mean velocity constructed from inductive loop detector data. These cumulative curves provided the resolution necessary to reveal the spatial and temporal aspects of dynamic freeway traffic flow phenomena. With increasing availability of reliable freeway sensor data, it is important to continue the systematic empirical analysis of freeways in different countries with varying geometric configurations. The results of this kind of research program will assist with all aspects of traffic flow modeling, operations and control. BACKGROUND Among many earlier empirical studies, congested traffic conditions have been analyzed upstream and downstream of freeway bottlenecks located near busy on-ramps (1,2,3,4,5) and off-ramps (6,7). Other geometric elements worth considering include long, homogeneous freeway sections, merge areas, diverge areas and segments containing other geometric features (8). In this study, a bottleneck was defined as a restriction that separates upstream queued traffic from downstream unrestricted traffic (9). Bottlenecks can be static (e.g., a tunnel 265
Elevation [m]
180 95 2000
D30
D29
D28
D27
A455 Friedberg
1150
1850
1700
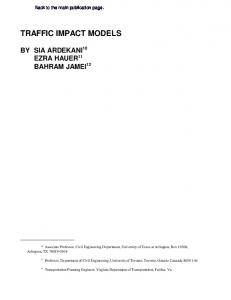
Figure 1: Site map, Autobahn 5
D26 D25 D24 D23 D22
D21
D20
D19
D18
D17
D16 D15
D14 D13 D12
D11
D10
D9 D8
D7 D6
D5 D4
A661 Bad HomburgerKreuz
950 400 650 650
1100
1300
1250
1420
1130
1225
575
1000
500 700
1200
900
1000
900
1100
800
500
1100
D3
D2 D1
1200
400
[Sta]
1200
[m]
A66 Nordwest Kreuz Frankfurt am Main A648 West Kreuz Frankfurt am Main
Bertini, Lindgren, Helbing and Schönhof
3
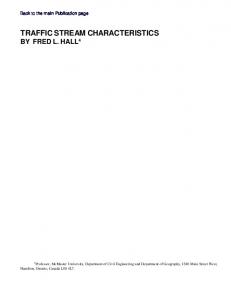
entrance, lane drop, diverge area) or dynamic (e.g., an incident or a slow moving vehicle). A bottleneck is considered “active” when it meets the definition presented above and is deactivated when there is either an upstream decrease in flow (decrease in demand or upstream flow restriction) or when a queue spills back from a bottleneck located further downstream (10). In this context, Kerner (11,12,13) and others have reported on empirical studies of congested traffic on German Autobahns. Using other data analysis techniques, some researchers have identified variations in bottleneck discharge flow and have postulated the evolution of congested traffic seemingly without bottlenecks. The objective of this paper is to carefully diagnose the activation and deactivation of a bottleneck on a German Autobahn that has been analyzed by others in the past, and to present some of its notable features that are revealed. DATA The study site (Figure 1) is a 30 km section of northbound Autobahn 5 (A5) near Frankfurt am Main, Germany. The freeway is equipped with double inductive loop detectors (labeled here as D1 through D30) in each lane and on most ramps as shown in the figure. The loop detector system records counts and average velocities for autos and trucks at one minute intervals. Archived data are available for more than 180 days in both northbound and southbound directions; the analysis described here uses data from Wednesday, September 19, 2001 from the northbound direction. Figure 1 also shows the spacing between detector stations (in meters) and the vertical geometry (elevations in meters). As shown there is a steady uphill gradient between stations D10 and D22, with a 2.9% grade between D20 and D22. METHODOLOGY AND OBSERVATIONS As an example of the diagnosis of one bottleneck’s location and the time it remained active on September 19, 2001, Figure 2 shows two sets of transformed oblique curves of cumulative vehicle count. The bottom portion of the figure includes curves for detectors D15 – D24 (including the on-ramp counts at D15), while the top portion shows curves for detectors D6 – D14 (the D6 on-ramp is also included in the counts to ensure vehicle conservation between stations). The slope of unaltered N(x,t) would be the flow past location x at any time t. Each curve was constructed so the same collection of vehicles was described. Each upstream curve was shifted to the right by the free-flow travel time from its location to the downstream-most detector. As a result, any vertical displacements between the curves would have been the excess vehicle accumulation between detector pairs, and the horizontal distance between curves would have been the delay between the measurement locations (14,15). Each N(x,t) was plotted using an oblique axis to amplify the curves’ features. As shown, q0 was an oblique scaling rate applied to each curve, thus revealing the times at which notable flow changes occurred. This method is described in more detail in several references (16,17). The same method was also used when constructing oblique curves of cumulative time-mean velocity, in order to reveal the times at which notable velocity changes occurred. It is noteworthy that this
4
16:16 D7 16:22 D6
Bertini, Lindgren, Helbing and Schönhof
6 7
12 13 14
100 0
Time, t at D6
16 18
23 24
100 0
14:00
15:03 D22
22
14:51 D17 14:58 D20 14:57 D20
21
15:28 D21 15:30 D20
20
15:05 D19 15:09 D18
19
15:14 D17
17
Active Bottleneck Betw. D21-D22 q22=5250 vph
15:00
15:40 D17 15:42 D16 15:45 D15
15
16:00
15:36 D22
15:00
15:34 D19 15:37 D18
14:00
N(x,t)-q0(t-t0), q0=4785 vph
16:08 D9 16:11 D8
11
16:03 D10
10
15:56 D11
15:45 D14 15:49 D13 15:51 D12
9
15:21 D16
N(x,t)-q0(t-t0), q0=4890 vph
8
Time, t at D15
16:00
Figure 2: Oblique N(x,t), Autobahn 5, September 19, 2001
method takes advantage of the loop detector data in its most raw form (does not aggregate the data any further) and also takes into account the spatial aspects of queue formation, which is a limitation of any pure speed threshold bottleneck identification method. Until 14:51 all N(x,t) in the lower portion of Figure 2 remained superimposed, indicating that traffic flowed freely between all locations. The annotations on the lower portion of Figure 2 trace the propagation of queues beginning at 14:51 when a bottleneck was briefly activated between D17-D18. Note that all N(x,t) downstream of D17 remained superimposed until 14:58, when a bottleneck was activated between D20-D21. By this time, the queue began to propagate upstream, and its progress can be traced as it passed D19, D18, D17 and D16. The bottleneck between D21-D22 was activated at 15:03, and was corroborated by speed reductions in each lane at D21. The upstream queue remained until 15:36 when this bottleneck was deactivated.
Bertini, Lindgren, Helbing and Schönhof
5
Speed increases at D21 were also visible in each lane (not shown here). The discharge flow measured at D21 was 5250 vph, and this flow was nearly constant and was lower than the flow that prevailed prior to the queue’s formation. Also shown in Figure 2 is the propagation of a shock of lower flow that emanated from between D21 and D22 at approximately 15:28. The shock’s passage can be traced upstream (see circular markers) as far as D6 nearly one hour later. The backward recovery wave was also traced in Figure 2 (square markers), reaching D6 by approximately 16:21. The velocities of the shock and recovery wave appeared to be stable and were also reproducible from day to day. The cause of this phenomenon is not known definitively, but its occurrence corresponded with a surge in demand for the off-ramp near D24, and also corresponded with high flows measured at D22 in the median lane (2260 vph), in the middle lane (2400 vph) accompanied by lower flow (1160 vph) in the shoulder lane. At this time, the speeds in the median and middle lanes were approximately 85 km/h and the shoulder lane speed was measured at approximately 60 km/h. FINAL COMMENTS After diagnosing a bottleneck’s location and the times it remained active, this study focused on the traffic patterns that preceded and followed in each travel lane. To what extent the high flows in the left two lanes, the speed differential with the shoulder lane and the presence of a higher proportion of trucks in the middle lane led to the formation of the shock is the subject of ongoing research and will be reported in the final paper. This site provides a valuable opportunity to document the systematic empirical observation of traffic flow phenomena in a way that can be replicated by other researchers in the future and reflects an important international collaboration that we hope will lead to improved cooperation among traffic scientists in the future. REFERENCES 1. Cassidy, M.J., and R.L. Bertini. Observations at a Freeway Bottleneck. Transportation and Traffic Theory, 14th International Symposium on Transportation and Traffic Theory, Jerusalem, Israel, 1999, pp. 107-124. 2. Cassidy, M.J., and R.L. Bertini. Some Traffic Features at Freeway Bottlenecks. Transportation Research, Vol. 33B, 1999, pp. 25-42. 3. Treiber, M., and D. Helbing. Macroscopic simulation of widely scattered synchronized traffic states. Journal of Physics A: Mathematical and General. Vol. 32, 1999. pp. L17-L23. 4. Treiber, M., A. Hennecke, and D. Helbing. Congested Traffic States in Empirical Observations and Microscopic Simulations. Physical Review E, Vol. 62, 2000 pp. 1805-1824. 5. Treiber, M., and D. Helbing. Reconstructing the Spatio-temporal Traffic Dynamics from Stationary Detector Data. Cooperative Transportation Dynamics, Vol. 1, 2002, pp. 3.1-3.24. 6. Muñoz, J.C. and Daganzo, C.F. (2002). “The bottleneck mechanism of a freeway diverge.” Transportation Research, 36A, 483-505. 7. Cassidy, M.J., Ananai, S.B. and Haigwood, J.M. (2002) Study of freeway traffic near an offramp. Transportation Research A, 36 (6), 563-572.
Bertini, Lindgren, Helbing and Schönhof
6
8. Helbing, D. A section-based queueing-theoretical traffic model for congestion and travel time analysis. http://www.arXiv.org/abs/cond-mat/0307028 Accessed July 30, 2003. 9. Daganzo, C.F. Fundamentals of Transportation Engineering and Traffic Operations. Elsevier Science, Oxford, U.K., 1997. 10. Newell, G.F. Theory of Highway Traffic Flow 1945-1965. Institute of Transportation Studies, Berkeley, U.S.A. 1995. 11. Kerner, B.S. Theory of Congested Highway Traffic: Empirical Features and Methods of Tracing and Prediction. Transportation and Traffic Theory in the 21st Century. 15th International Symposium on Transportation and Traffic Theory, Adelaide, Australia, 2002, pp. 417-439. 12. Kerner, B.S. Theory of Congested Traffic Flow: Self-Organization Without Bottlenecks. Transportation and Traffic Theory, 14th International Symposium on Transportation and Traffic Theory, Jerusalem, Israel, 1999, pp. 147-169. 13. Kerner, B.S. Theory of Breakdown Phenomenon at Highway Bottlenecks. In Transportation Research Record 1710, TRB, National Research Council, Washington, D.C., 2000, pp. 136144. 14. Newell, G.F. Applications of Queuing Theory. Chapman and Hall, Cambridge, U.K., 1982. 15. Newell, G. F. (1993) A simplified theory of kinematic waves in highway traffic I: General theory. II: Queueing at freeway bottlenecks. III: Multi-destination flows. Transportation Research 27B, 281-313. 16. Cassidy, M.J., and J.R. Windover. Methodology for Assessing Dynamics of Freeway Traffic Flow. In Transportation Research Record 1484, TRB, National Research Council, Washington, D.C., 1997, pp. 73-79. 17. Muñoz, J.C., and C.F. Daganzo. Fingerprinting Traffic from Static Freeway Sensors. Cooperative Transportation Dynamics, Vol. 1, 2002, pp. 1.1-1.11.