Sławomir CHYŁEK Warsaw University of Technology, Institute of Computer Science
Emulation based software reliability evaluation and optimization Abstract. This paper presents an original software reliability assessment method implemented in the QEMU Fault Injection Framework – an emulation based SWIFI tool. The method was utilized in evaluation of susceptibility to memory faults of GNU/Linux operating system components: executable code, stack space and dynamically allocated data. Presented experiments’ results are basis to the development of a new heuristic mechanism for improving the executable code robustness. Streszczenie. Niniejszy artykuł przedstawia metodę oceny niezawodności oprogramowania zaimplementowaną w QEMU Fault Injection Framework – opartym o emulator narzędziu typu SWIFI. Zaprezentowaną metodę zastosowano do ewaluacji wrażliwości na błędy pamięci w kodzie,przestrzeni stosu oraz danych systemiu GNU/Linux. Uzyskane wyniki stanowią podstawę do opracowania nowego heurystycznego mechanizmu zwiększania niezawodności wykonywalnego kodu. (Ocena i optymalizacja niezawodności oprogramowania z zastosowaniem emulacji).
Keywords: emulation, fault injection, operating systems, software reliability. Słowa kluczowe: emulacja, wstrzykiwanie błędów, systemy operacyjne, niezawodność oprogramowania. doi:10.12915/pe.2014.02.32
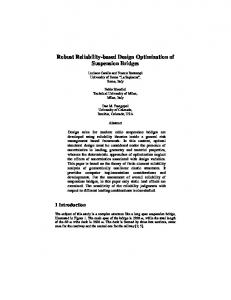
Introduction Computer systems’ security can be compromised in multiple ways – by deliberate attacks or by hardware malfunctions. The latter threat is growing due to increased density of integrated circuits [1]. The expanse of Customer Of The Shelf (COTS) components into new disciplines like smartphones used to monitor owners’ health parameters [2] raises a need to increase reliability of such solutions. Well established methods of developing robust software (checkpointing, N-version programming) are costly and hard to adapt into COTS components. In this paper we present a novel method to enhance service availability by assessment of a computer system behavior in presence of memory faults followed by a new method of handling exceptions caused by disturbances in executable code. The differentiator of the assessment method is adaptation of computer system emulation to realize Software Implemented Fault Injection (SWIFI). Thanks to this approach memory faults are injected without interaction with the System Under Test (SUT) unlike in SWIFI tools based on debugging API [3]. This unique feature allowed evaluating operating system susceptibility to memory faults. A set of experiments was designed to identify critical components of the operating system and propose a new method to improve operating system reliability. In the described research the GNU/Linux operating system was evaluated and the effectiveness of the proposed reliability improvement method was measured. The rest of this paper is organized as follows. The next section presents the experiments' environment. Following section is dedicated to results obtained from conducted experiments. The next section describes the new reliability improvement method with discussion on results. The remainder of the paper concludes the findings and outlines further research areas. QEMU Fault Injection Framework (QEFI) QEMU [4] is a versatile computer system emulator. It supports various computer system architectures and is released under open source license. Due to these features it is widely used in research [5, 6, 7]. QEMU was adapted at Warsaw University of Technology to support fault injection in order to conduct reliability experiments. Preliminary works on QEFI were presented in [8, 9]. QEFI architecture consists of following components: modified QEMU, Supervisor program and Analyzer program. The architecture is presented on figure 1.
Fig. 1. QEFI architecture
QEMU is responsible for emulating a SUT computer system and was enhanced with extra features, namely ability to inject memory faults and additional tracing mechanisms. Injecting a fault is controlled with two parameters: location and injection moment. Location is a range of memory addresses from which a random memory cell is selected as an injection target. The injection moment is immediate or delayed. In case of immediate injection the memory cell is disturbed at the time of issuing the injection command while delayed injection is related to some triggering event – e.g. execution of a specified instruction by the emulated CPU or access to some range of memory. Designed tracing mechanisms embedded into QEMU are: profiling the code executed in kernel space (according to method described in [10]), counting the number of times a disturbed code was executed and tracing dynamic memory allocations in kernel space. Supervisor is responsible for following operations: conducting interaction with SUT (e.g. simulate user activity), controlling the fault injection process (i.e. issuing injection commands to QEMU) and collecting execution logs. In the basic configuration Supervisor interacts with SUT via an emulated by QEMU serial console exposed as a TCP/IP service and interaction with QEMU software is realized with QEMU’s control console accessible also on TCP/IP port. Logs collected by Supervisor consist of communication with SUT, commands issued to QEMU and tracing data emerging on QEMU’s control console.
PRZEGLĄD ELEKTROTECHNICZNY, ISSN 0033-2097, R. 90 NR 2/2014
121
Experiments Experiments conduced with QEFI are targeted at assessment of the GNU/Linux kernel since this system is more and more often adapted into COTS embedded solutions (e.g. Android smartphone operating system). The tested system is an emulated x86 computer operating under Debian Squeeze Linux distribution with GNU/Linux kernel version 2.6.32. Three experiment scenarios were prepared in order to inject faults into operating system’s executable code, stack and dynamically allocated memory, since memory faults are common [11]. The injected fault model is a single upset event modeled as bit-flip memory operation. All experiments share the same scenario with a different specification of a injected fault. The scenario defines a series of commands where a simulated by Supervisor user logs into the system via serial console, downloads a specified file from a network location and performs several filesystem operations. In case of experiment aimed at executable code the fault injection location was narrowed to memory areas that store operating system’s functions invoked during the scenario execution. Disturbing the stack memory was configured as a delayed injection triggered when the emulated CPU executes a call procedure instruction in kernel space. A fault was injected at randomly chosen triggering event in a range of 64 bytes starting from the address stored in the stack pointer register. In case of disturbing dynamically allocated data it was required to trace allocated memory during SUT run. This was achieved by tracing invocations of 1 kmalloc_trace and kfree functions in GNU/Linux kernel . The fault injection was triggered by reading allocated data and the read cell was modified. For all experiments 10000 tests were performed. The percentage of tests in which injected faults were manifested is presented on figure 2 (tests with a fault injected into code, but the disturbed instruction was not executed were filtered out).
1
Tracing function calls is implemented as tracing execution of a procedure call instruction with an argument that was an address of one of traced functions.
122
Tests
90% 80% 70% 60% 50% 40% 30% 20% 10% 0% Code
Stack
Data
Fig. 2. The percentage of tests with manifested faults
On figure 3 a detailed graph of manifestation types is shown. The “Scenario completed” and “Scenario failed” flags denote if the SUT was able to execute all commands from the scenario. The “System message” flag marks that a test’s log contained kernel messages. The “Application message” flag indicates that the executed application messages were somehow altered in comparison with a reference run without a fault injection.
Tests
Analyzer program realizes post processing of logs collected by Supervisor. Its goal is to analyze following aspects: if the scenario was fully executed, if an injected fault had an effect on SUT (i.e. the fault was manifested), if and what kind of messages were reported by the operating system. However, the set of analyzed aspects can be easily extended. The analysis is executed in a batch mode and results are stores in a Comma Separated Values (CSV) file for latter processing. Experiments conducted with QEFI are organized as follows. The interaction sequence with SUT and QEMU that is performed by the Supervisor is called a scenario. A single scenario execution is called a test. An experiment is a series of tests with fault injected at different memory locations and/or at different injection moments. The most important features of the described framework are: ability to disturb operating system software (code, stack and data) and scalability since multiple pairs of Supervisor and QEMU programs can be run parallel in order to accelerate the process of collecting results. Additional advantages of utilizing QEMU emulator in SWIFI are possibility to perform a comparison evaluation of different operating systems or different CPU architectures and ability to inject fault into emulated hardware, although these topics exceed the scope of this paper.
100% 90% 80% 70% 60% 50% 40% 30% 20% 10% 0%
Scenario completed & Application message Scenario completed & System message Scenario failed & Application message Scenario failed & System message Code
Stack
Data
Fig. 3. Types of error manifestation
The percentage of kernel messages types is summarized in Table 1. This data was collected from tests marked on figure 3 as “Scenario failed & System message” and “Scenario completed & System message”. The percentage in the table denotes the number of tests’ logs that contained a specified kernel message. Table 1. Reported kernel messages Message Code [%] Paging request failed 50.03 Null dereference 29.42 Segfault 0 Undefined instruction 9.03 Bad PC value 14.42
Stack [%] 52.7 23.84 0 7.74 23.5
Data [%] 43.26 12.57 10.11 8.55 7.27
For executable code disturbance an additional analysis was performed – if a test’s log contained a stack trace report and a disturbed function was present in a stack trace it was checked how many bytes separate the crash instruction and the altered memory cell. A stack trace was present in 58% of tests with system messages. The graph presenting the measured distance including the number of execution of the disturbed instruction is presented on fig. 4. Collected results show that the executable code is the most susceptible component for memory errors. The second is the stack space and both of these targets show similar characteristics of error manifestation where ~90% of faults were detected by operating system. The least susceptible component is dynamically allocated data, however it is characterized by a high number of faults that caused applications malfunction (Fig. 3 “Scenario failed &
PRZEGLĄD ELEKTROTECHNICZNY, ISSN 0033-2097, R. 90 NR 2/2014
Number of executions > 1
15% 10% 5% 0% -10 -9 -8 -7 -6 -5 -4 -3 -2 -1 0 1 2 3 4 5 6 7 8 9 10
Tests with a stack trace
Number of executions = 1
Distance between a disturbed address and a crash instruction [bytes]
Fig. 4. The distance between a disturbed address and a crash instruction
Optimization method Executable code is the most susceptible part of the operating system, thus it is the first research effort is focused on improving its reliability. The most important conclusion from conducted experiments is that most of reported kernel messages are “Paging request failed” (According to table 1). This exception is raised when Memory Management Unit (MMU) in computer system cannot access memory referenced from the executed code. The second observation comes from analysis of figure 4. A large number of crashes occur after just one execution of the disturbed instruction and a distance between a crashing instruction and a disturbed memory cell is mostly in bounds of 1-2 instructions (on x86 architecture an instruction code is variable length, thus it is impossible to tell the exact distance in executed instructions without dissembling the code).
thread would continue regular operation. If the repair was not successful the thread would raise the MMU request one more time, but the repair procedure won’t be triggered and the thread would be terminated. The algorithm presenting the entire handling procedure is shown on figure 5. A proof of concept implementation of a proposed method was prepared. It consists of a kernel loadable module (Module v.1) that creates a backup image of the kernel’s executable code at load and modifies the MMU interrupt handling procedure in order to realize the specified algorithm (a kernel patch was applied to enable implementation of this functionality). Furthermore the analysis of the rest of kernel messages showed that some of them are also caused by CPU interrupts (e.g. “Undefined instruction” and “Bad PC value”) and a similar algorithm may be applied. The second version of the module (Module v.2) was prepared – it supported repair procedure for MMU interrupts and additional CPU interrupts. Both module versions were shipped to a SUT and an experiment of 10000 tests with fault injection in executable code was run for each of them. Experiments’ results compared to the original code injection experiment were presented on figure 6. The “Recovery triggered” flag denotes tests where a repair procedure didn’t detect a fault in a crashing function’s code. The “Recovery done” flag indicates that a repair procedure detected a fault and restored an original code.
Tests
Application message”) – this type of error is especially dangerous since a fault had occurred in the operating system and was passed to an application that cannot detect whether data it receives is correct.
100% 90% 80% 70% 60% 50% 40% 30% 20% 10% 0%
Scenario completed & System message Scenario completed & Recovery done Scenario failed & Application message Scenario failed & Recovery done Scenario failed & Recovery triggered Code
Module Module v.1 v.2
Scenario failed & System message
Fig. 6. Types of error manifestation with and without recovery modules
Fig. 5. Memory fault handing algorithm
Based on these considerations a following optimization method is proposed. A protected memory area with executable code should have a backup image. When a MMU exception is raised and the memory request cannot be served a function’s code integrity check should be triggered. If a disturbance in memory is detected a code repair procedure should be performed. The procedure should check if the memory is permanently damaged and if possible it should restore the original code. After conducting a repair procedure a thread that caused the MMU exception should be restored. If the repair was successful (i.e. the disturbed instruction is the same as instruction that generated an impossible to serve memory request) the
The proposed method increased the number of tests with completed scenario from 9% to 18% (Module v.1) and 22% (Module v.2). However, the method is a heuristics – it does not guarantee that conducting the repair procedure won’t cause invalid results. The procedure is certainly effective only if there was only one attempt to execute the disturbed instruction and this attempt caused a crash. In case where disturbed instruction was executed n times it is possible that during executions before the crash some incorrect results were produced and the repair procedure prevented the system from crash, which in turn results in invalid data. Let’s consider a function that is computing a length of a NULLterminated linked list where a disturbed instruction alters the address of the next element in currently examined element. The execution of the faulty code can follow the garbage addresses until an invalid memory access occurs – this event would trigger the repair procedure that fixes the address of the next element. If the fixed address is by coincidence a NULL terminal, then an invalid size of the list would be returned from the function. The method to determine whether faulty code was executed multiple times is an open issue. Nevertheless, the main goal of the proposed optimization method is to prevent either system or application crash, so that inconsistencies could be detected
PRZEGLĄD ELEKTROTECHNICZNY, ISSN 0033-2097, R. 90 NR 2/2014
123
and corrected by mechanisms at higher abstraction level – the presence of such mechanisms is mandatory in order to protect against faults that don’t cause any crashes, but just invalid results. It should be emphasized that the recovery procedure was fully executed in 12-15% of tests, but the scenario was not completed. The analysis of these cases showed that a disturbed instruction usually preceded the crashing instruction. Table 2 contains a listing of a sample original & disturbed code. The “>” character denotes the crash instruction. Table 2. Sample original and disturbed code listing Original code Disturbed cide mov 0x20(%ebx),%edx mov (%ebx),%edx xor %eax,%eax > and %dh,(%ecx)
In the presented sample a disturbance of single bit resulted in altering the MOV’s instruction argument and changed the length of the instruction code at the same time. This in consequence resulted in executing AND instruction which was not present in the original code. The proposed method cannot handle such case. Nevertheless, the listed code could be repaired by restoring the original code and rolling back the instruction pointer to the MOV instruction. In general if the code execution (E) can be defined as a sequence of transitions between states (S) after executing the i-th instruction and x is the crash instruction then the disturbed execution can be written as E=(S0, …, Si, …, Sx). Let’s define an equivalent state (Ti) to the state Si in E, where Ti has all resources read during execution of E the same as in Si (it means that Ti may differ from Si only by resources that would be overwritten by instructions executed after the i-th instruction). The recovery problem can be defined then as a search of a reverse transition from Sx state to Ti state, where i is a one of instructions not affected by the memory fault. This issue is a relaxed version of a reversible execution [12] where transitions between all states are required. The stated problem is the next research area for proposed method improvement. Summary The presented method for assessment computer system’s susceptibility to faults is unique due to ability of injecting faults into operating system’s components, nonintrusive tracing of execution and scalability. These advantages were achieved due to utilization of emulation software. The method was implemented in QEFI software, which was used to evaluate GNU/Linux kernel. Conducted experiments were targeted at operating system’s executable code, stack space and dynamically allocated data. The results showed that the code is most susceptible component, thus an original heuristic method for improving reliability was proposed. The effectiveness of the method
124
was measured with QEFI and the number of successfully conducted scenarios increased by 13% compared to the reference injection experiment. The analysis of the collected results enabled to state the recovery problem. The next research effort is going to be focused on this issue. Nevertheless, methods of protecting kernel stack space and allocated data remain in the scope of interest. REFERENCES [1] Aitken R., Fey G., Kalbarczyk Z., Reichenbach F., Sonza R., Reliability analysis reloaded: How will we survive?, Design, Automation Test in Europe Conference Exhibition (2013), 358367 [2] Gupta N., Jilla S., Digital Fitness Connector: Smart Wearable System, Informatics and Computational Intelligence (ICI), First International Conference on (2011), 118-121 [3] Gawkowski P., Sosnowski J., Developing Fault Injection Environment for Complex Experiments, On-Line Testing Symposium, IOLTS '08, 14th IEEE International (2008), 179181 [4] Bellard F., QEMU, a fast and portable dynamic translator, Proceedings of the annual conference on USENIX Annual Technical Conference, ATEC ‘05 (2005), 41-41 [5] Sand M., Potyra S., Sieh V., Deterministic high-speed simulation of complex systems including fault-injection, Dependable Systems & Networks, DSN '09, IEEE/IFIP International Conference on (2009), 211-216 [6] Onoue K., Oyama Y., Yonezawa A., A Virtual Machine Migration System Based on a CPU Emulator, Virtualization Technology in Distributed Computing, VTDC 2006, First International Workshop on (2006), 3-3 [7] Chandra Shekar N., Wilson Naik B., Forensic Analysis on QEMU, Computational Intelligence and Information Technology (2011), 777-781 [8] Chyłek S., Goliszewski M., Wstrzykiwanie błędów oparte na modelach - Zastosowania QEMU w analizie niezawodności urządzeń mobilnych, Zeszyty Naukowe Wydziału Elektroniki, Telekomunikacji i Informatyki Politechniki Gdańskiej (2011) vol.1, nr.9, 489-494 [9] Chyłek S., Goliszewski M., QEMU-Based Fault Injection Framework, Studia Informatica (2011), vol.33, nr.4(109), 25-42 [10] Chyłek S., QEMU CPU Tracer – an Exact Profiling Tool, Metody Informatyki Stosowanej (2011), vol.5/2011, nr.30, 167172 [11] Schroeder B., Pinheiro E., Weber W., DRAM errors in the wild: a large-scale field study, Proceedings of the eleventh international joint conference on Measurement and modeling of computer systems, SIGMETRICS '09 (2009), 193-204 [12] Akgul T., Mooney V., Instruction-level Reverse Execution for Debugging, Proceedings of the 2002 ACM SIGPLAN-SIGSOFT workshop on Program analysis for software tools and engineering (2002), 18-25
Author: mgr inż. Sławomir Chyłek, Politechnika Warszawska, Instytut Informatyki, ul. Nowowiejska 15/19, 00-665 Warszawa, Email:
[email protected];
PRZEGLĄD ELEKTROTECHNICZNY, ISSN 0033-2097, R. 90 NR 2/2014