The Enable server is implemented using the Python ... The use of Python with XML-RPC greatly ... runs pipechar with the -bot option, which gives the speed of.
Enabling Network-Aware Applications Brian L. Tierney, Dan Gunter, Jason Lee, Martin Stoufer Computing Sciences Directorate Lawrence Berkeley National Laboratory University of California, Berkeley, CA, 94720 Joseph B. Evans Information & Telecommunication Technology Center University of Kansas, Lawrence, KS 66045 There exists a large body of work showing that good performance can be achieved using the proper tuning techniques. The most important technique is the use of the optimal TCP buffer size, and techniques for determining the optimal value for the TCP buffer size are described in [35]. Another important technique is to use parallel sockets, as described in [31]. Using a combination of these techniques, applications should be able to utilize all the available network bandwidth, which is demonstrated in [4], [1], and [16]. However, determining the correct tuning parameters can be quite difficult, especially for users or developers who are not network experts. The optimal TCP buffer size and number of parallel streams are different for every network path, vary over time, and vary depending on the configuration of the end hosts. There are several tools that help determine these values, such as iperf [14], pchar [26], pipechar [27], netspec [23], and nettest [22], but none of these include a client API, and all require some level of network expertise to use. Another tool is NWS [38], which applications can use to determine upper bounds on throughput from the network, but it does not tell the applications how to achieve that throughput. Other groups are addressing this problem at the kernel level, such as the web100 project [37], Linux 2.4 [17], and others [9], as described below. Still others are addressing this within the application. The autoftp file transfer service from NCSA [19] attempts to determine and set the optimal TCP buffer size for each connection. In this paper we describe a service which provides clients with the correct tuning parameters for a given network path. We call this service Enable, because it enables applications to optimize their use of the network and achieve the highest possible throughput. The goal of the Enable service is to eliminate what has been called the “wizard gap” [21]. The wizard gap is the difference
Abstract Many high performance distributed applications use only a small fraction of their available bandwidth. A common cause of this problem is not a flaw in the application design, but rather improperly tuned network settings. Proper tuning techniques, such as setting the correct TCP buffers and using parallel streams, are well known in the networking community, but outside the networking community they are infrequently applied. In this paper, we describe a service that makes the task of network tuning trivial for application developers and users. Widespread use of this service should virtually eliminate a common stumbling block for high performance distributed applications.
1.0 Introduction Internet backbone speeds have increased considerably in the last few years due to projects like Internet II and NGI. At the same time, projects like NTON [25] and SuperNet [34] are providing a preview of the near future of wide area networks. Unfortunately, distributed applications often do not take full advantage of these new high-speed networks. This is largely due to the fact that the applications use the default parameters for TCP, which have been consciously designed to sacrifice optimal throughput in exchange for fair sharing of bandwidth on congested networks. In order to overcome this limitation, distributed applications running over high-speed wide-area networks need to become “network-aware” [32][36], which means that they need to adjust their networking parameters and resource demands to the current network conditions. This paper published in the proceedings of the Tenth IEEE International Symposium on High Performance Distributed Computing, August, 2001, San Francisco, CA.
1
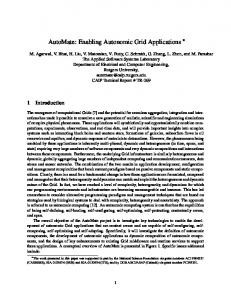
The buffer size must be adjusted for both the send and receive ends of the socket. To get maximal throughput it is critical to use optimal TCP send and receive socket buffer sizes for the link you are using. If the buffers are too small, the TCP congestion window will never fully open up. If the buffers are too large, the sender can overrun the receiver, and the TCP window will shut down. The optimal TCP window size is the bandwidth delay product for the link. For more information, see section 5, and [30] and [36]. As network throughput speeds have increased in recent years, operating systems have gradually changed the default buffer size from common values of 8 kilobytes to as much as 64 kilobytes. However, this is still far too small today’s high speed networks. For example, several there are several hosts which are part of the Particle Physics Data Grid [28] with 1000 BT network interfaces and are connected via an OC12 (622 Mbit/sec) WAN, with typical round-trip network latencies of about 50 ms. For this type of network, the bandwidth delay product, and hence the TCP buffer, should be roughly 3.75 MBytes. Using a default TCP buffer of 64 KB, the maximum utilization of the pipe will only be about 2% under ideal conditions. Furthermore, 10 Gbit/sec ethernet and OC192 WAN’s (9.6 Gbit/sec) are just becoming available, which will require TCP buffer sizes in of roughly 62 MBytes per connection to fully utilize the link! (However, typical workstations today can, at best, drive the network at about 1 Gbit/sec, so TCP buffers requirements of this size are still a couple years away) As the awareness of the importance of TCP buffer tuning has increased, several data transfer tools now include the ability for the user to set this value. For example the gsiftp [1][11], bbftp [3], SRB [2], HPSS [13], and DPSS [36] all provide this ability. Additionally, some systems, such as DPSS and gsiftp, also support the ability for users to request parallel data streams. The psockets library from the University of Illinois makes it easy for applications developers to add parallel sockets to their applications [31]. Figure 1 shows the advantage of using tuned TCP buffers and parallel streams in the gsiftp program for a 100 MByte data transfers between Lawrence Berkeley National Lab in Berkeley, CA, and CERN in Geneva, Switzerland. The round trip time (RTT) on the connection was measured with ping to be 180 ms and the bottleneck link was measured with pipechar to be 45 Mbit/sec. With different tuning parameters, actual measured transfer speeds spanned more than an order of magnitude. Tuned TCP buffers alone provided a 9x performance increase, and parallel sockets alone yielded a 12x performance improvement. Using parallel streams with tuned TCP buffers we were able to saturate the network. This combination of techniques provided a 15x performance increase, which was an
between the network performance that a network “wizard” can achieve by doing the proper tuning, compared to the performance of an untuned application. The Enable service can act as that wizard. Enable hides the details of gathering the data from multiple network monitoring tools behind an intuitive, easy to use interface. From the application developer’s perspective, Enable provides advice on the correct tuning parameters without requiring knowledge about how these are obtained. Thus, the selected algorithms and tools for computing these parameters can be changed transparently to the application. This frees the distributed application developer from needing to understand the wide variety of available monitoring tools. The Enable service works as follows: An Enable server is co-located on every system that is serving large data files to the wide-area network (e.g.: an FTP or HTTP server). The Enable service is then configured to monitor the network links to a set of client hosts from the perspective of that data server. Network monitoring results are stored in a database, and can be queried by network-aware distributed components at any time. The Enable service runs the network tests on some pre-configured time interval (e.g.: every 6 hours, or whenever a new client connects). The Enable service API makes it very easy for application or middleware developers to determine the optimal network parameters. To take advantage of the Enable tuning service, distributed applications must be modified to be support network tuning such as the ability to set the TCP buffer size [35] or the ability to create and use multiple data streams to transfer data in parallel. The network tuning parameters that the Enable service is initially concentrating on are those required by large bulk data transfer applications, such as the various “Data Grid” [5] projects. These include the Particle Physics Data Grid [28], GriPhyn [10], the Earth Systems Grid [7], and the EU DataGrid [12]. These projects all require the efficient transfer of very large scientific data files across the network. We are not yet addressing the tuning requirements of other types of applications, such as latency-sensitive applications.
2.0 Background TCP uses what it calls the “congestion window” to determine how many packets can be sent at one time. The larger the congestion window size, the higher the throughput. The TCP “slow start” and “congestion avoidance” algorithms determine the size of the congestion window [20]. The maximum congestion window is related to the amount of buffer space that the kernel allocates for each socket. For each socket, there is a default value for the buffer size, which can be changed by the program using a system library call just before opening the socket.
2
Table 2 shows the result of tests between a Sun Ultra 1 (333 Mhz) sender and a 450 MHz Pentium II Linux 2.2 receiver also over a OC-12 WAN with a 1500 byte MTU. In this case we see a large performance penalty using parallel data streams. This is because a 450 MHz PII processor is not powerful enough to handle load from the gigabit network interface card. It requires most of the CPU just to read one stream, and multiple streams just step on each other. The Enable service makes it easy for applications to use the correct settings and avoid these types of problems.
additional 40% improvement over just tuned buffers and a 26% improvement over just parallel streams. Throughput (Mbits/sec)
30 25 20 15 10 5 0
Table 1 : Sender overruns receiver no tuning tuned TCP 10 parallel tuned TCP buffers streams, buffers, 3 no tuning parallel streams
Figure 1: gsiftp results using tuned TCP buffers and parallel streams The use of parallel streams provides an increase over optimally tuned single stream TCP because TCP is rather sensitive to any loss or congestion, and slows down whenever any loss is detected. Our testing has shown that it is extremely rare that a TCP stream keep its congestion window at the optimal bandwidth delay product size for very long. The use of multiple streams allows one to utilize a greater fraction of the network. Note that this may be considered a “rude” thing to do, depending on how congested the network is and whether or not you are slowing down others by doing this. However, as with all systems that provide the ability to tune the TCP buffer size or the number of parallel streams, the gsiftp user must set these values by hand, and determining what values to use is not simple. In general, using large TCP buffers and parallel streams improves throughput, so it may be tempting for users or developers to simply use big buffers and a some parallel streams by default. However this is not a good idea. Besides wasting operating system resources, under certain circumstances overly large TCP buffers or too many parallel streams can significantly decrease performance, as shown in the Tables 1 and 2. Table 1 shows the result of tests between two 333 MHz Sun Ultra 1 hosts running Solaris 2.7, connected by a gigabit Ethernet LAN with a 1500 byte MTU (maximum transmission unit). Note that setting the TCP buffer too large results in a large performance loss. This is because when the buffers are too large, the sender can overrun the receiver, and the TCP window will shut down. Not all operating systems have this behavior (e.g.: Linux does not), but this reemphasizes that taking the simple approach of just setting large buffers everywhere is not a good idea.
TCP Buffer Size (MB)
Throughput (Mbits/sec)
0.125
246
1
195
4
105
8
32
Table 2 : Parallel streams Number of Streams
Total Throughput (Mbits/sec)
1
250
2
100
4
50
3.0 Related Work There are a number of tools to help determine the optimal TCP parameters for a given network path. For example, one can run a series of iperf tests with a range buffer sizes and numbers of parallel data streams to determine the optimal values. Other tools such as pchar [26], pipechar [27], and pathrate [6] can be used to estimate the bandwidth and latency characteristics of the network, providing information needed to estimate the optimal TCP buffer size. However, these tools do not include a client API, and require some level of network expertise to use. The Enable service can be used to run any of these tools, collect and store the results, and make the results available to network-aware applications. Additionally, there are some other projects that are also working on eliminating the “wizard gap”. The web100 project is developing a version of the Linux kernel which will perform dynamic, transparent, automatic TCP tuning for user level processes. If successful, this has the potential to eliminate the TCP buffer tuning issue. Fisk and Feng [9], have also demonstrated promising results with Linux kernel
3
centralized coordination and location of the Enable servers, as they are always co-located with the data server. The following section describes the functionality and implementation of the Enable Service.
modifications that autotune the TCP buffer size by estimating link bottleneck bandwidth for each socket connection. The Linux 2.4 kernel also includes an option for TCP buffer autotuning, and initial testing shows that this helps quite a bit, but is still not as good as hand tuning (see the results section below). Unfortunately the developers of this code are not part of the IETF or any TCP research community, and any solution they come up with is not likely to be standardized or adopted very quickly. Therefore, while there is some hope that automatic TCP buffer tuning will be built into some operating systems in the future, it will probably not be built into most operating systems in the near future.
4.1 Functionality The Enable Server will periodically run tests between itself and a number of “client hosts”. These client hosts may have been read at start-up from a configuration file, manually added using an API or command-line utility, or automatically added by monitoring log files from the data server, such as HTTP or FTP logs. The results of the network tests will be stored in a database. The selection and scheduling of tests for each client is dynamically configurable. Clients can query the Enable server, which is listening on a well-known port, for network parameters, also called “network advice”. The protocol for doing this is XML-RPC [39], a standard XML-based protocol that performs remote procedure calls over HTTP. Use of a standard protocol means that third parties can easily interface with Enable without using the Enable API or libraries. There is a simple API that clients can use to query the Enable Server. For example:
4.0 The Enable Service The Enable service has three distinct components. First, there is the Enable Server, which keeps an up-to-date record of network parameters between itself and other hosts. The second component is a protocol for clients to communicate with the servers. Finally, there is a simple API that makes querying the Enable Servers trivial for application developers. A primary design goal for the Enable service was ease of installation, configuration, and use.
tcp_buffer_size = EnableGetBufferSize(ftp_hostname)
Network tests are run between servers and clients (but not between clients), e.g.: ping, pipechar, pchar, iperf
returns the optimal buffer size between itself and the FTP server host, and:
Client Host
Client Host
net_info = EnableGetNetInfo(ftp_hostname)
network Enable Service
Client Host
Enable Service Data Server (e.g. FTP)
results DB
Data Server Host
Data Server (e.g. FTP)
returns the result of all network tests for that network path. One could also wrap an application in a script that called the Enable Server, and then set the buffer size via a command line argument. For example, we have written a script that automatically finds and sets the “-B” flag (which sets the TCP receive buffer) for the ncftpget FTP client program [24]. Currently the Enable server supported network tests are ping, pipechar, pchar, and iperf, but only ping and pipechar are run by default. Since the network tests are run periodically, there is the possibility that one of the tests will be run during some unusual network problem, and the results of this test will not lead to useful results for tuning applications. Therefore, a trimmed mean, in which the top and bottom 10% of values are discarded before calculating the mean of the most recent N values (N is configurable, default is 10), is reported to the client. In order to more quickly detect a long-term shift in network behavior, the mean and standard deviation of the last N values if also calculated. If three successive values are farther than 2.5 standard deviations from the mean, it is
results DB
Data Server Host Enable data base: contains results of all tests from the server host to all its clients.
Figure 2: Enable Service Architecture The architecture of Enable is shown in Figure 2. The simplicity of the design is its strength. An Enable Server is installed on every data server host, such as an FTP server, and that Enable server is responsible only for determining the optimal network parameters between clients and itself. Other monitoring systems, such as NWS, can be configured to monitor an arbitrary mesh, or “clique” of hosts. This design, while very powerful, makes these systems more complicated to deploy and configure, as it requires software to be installed on every host in the clique. We have decided to sacrifice this functionality for ease of deployment and configuration. In return, we avoid the problems of
4
chosen over SOAP [33] because the current SOAP implementations are still evolving, and because XML-RPC is simpler and provides everything we need. The server uses a thread pool of worker threads for running the network tests, and a scheduler thread to feed jobs to the workers. By limiting the number of worker threads it is easy to limit the amount of load generated by the testing. There is also a thread for scanning log files (e.g. FTP logs) for new hosts to monitor. We have developed client APIs for the python, Java, and C languages. Enable was designed for the easy addition of new tests, and each test is realized by a class instance in Enable. Enable requires only 3 specific methods in the new class be implemented: “init”, “can_I_run” (is it safe to start this test), and “run”. We have tested an Enable server that was configured to monitor 500 hosts, running each test every 4 hours using 8 worker threads, on a 500 MHz PIII Linux host. While running tests, the Enable server consumed at most 9% of the CPU, and used an average of only 130 Kbits/sec of network bandwidth. (By default, 10 ping tests are run in parallel, and use 12 Kbits/sec each, and only 1 pipechar can run at a time, which generates only about 100 Kbits/sec of network traffic). There are still some scalability issues to address, as discussed in the section on future work below.
assumed that the network behavior has changed, and the older N-3 values are discarded. This approach is based on the assumption that the distribution of test results closely approximates a normal distribution. More testing is needed to validate this method for handling data fluctuations.
4.2 Use-case In this section we illustrate the use of the Enable service with a simple use-case in a Data Grid application. In the EU DataGrid project [8], huge volumes of high-energy physics data must be replicated at several sites around the world. For example, five sites may wish to create a replica of a particular set a data that is stored on an data server at CERN in Geneva, Switzerland. In this project, gsiftp, a data transfer utility based on FTP that provides TCP buffer tuning and parallel stream support is used to transfer data between CERN and each of the other sites. In this environment, there is a large variability in delay and bandwidth to each of the replication sites, as shown in Figure 3. Note that no statically configured TCP buffer size will work well for all the clients: a buffer of 256 KBytes will penalize clients A, B and E while a buffer of 1-2 MBytes will penalize A, C, and D (due to effects shown in Table 1). Data Grid file transfer tools such as gsiftp allow the users to specify a buffer size. However this solution is far from optimal, as it requires too much knowledge and work on the part of the users. Instead, the gsiftp client can be wrapped in a script that uses the Enable service find the optimal TCP buffer size for each path.
5.0 Results To test the results of the Enable service, we used iperf as a client/server pair over four different network paths: LBL (Berkeley, CA) to CERN (Geneva, Switzerland); LBL to ISI (Arlington, VA) over SuperNet; LBL to the University of Kansas (Lawrence, KS), and ANL (Chicago, IL) to SRI in Menlo Park, CA. Characteristics of these network paths are summarized in Table 3. iperf was chosen for testing because it is a simple tool that only performs network transfers, thus ensuring that we are only measuring network performance, and not some combination of network, disk, and application performance. Table 3 Test network path characteristics.
Data Server
200 Mbits/sec 20 ms RTT buffer = 500KB
Enable Server
100 Mbits/sec 100 ms RTT buffer = 1250KB
site A 45 Mbits/sec 180 ms RTT buffer = 1000KB
100 Mbits/sec 20 ms RTT buffer = 250KB
100 Mbits/sec 13 ms RTT buffer = 170KB site E
site B
site C
site D
Figure 3: Data Grid Use Case
4.3 Implementation The Enable server is implemented using the Python language [29], and uses XML-RPC [39] for client-server communication. The use of Python with XML-RPC greatly simplified the development of the server, as Python includes very powerful built in modules for threads, queues, databases, regular expressions, configuration file parsing; almost everything required by this service. XML-RPC was
Path
Round Trip Time (RTT)
Bottleneck Link Bandwidth
LBL-CERN
180 ms
45 Mbits/sec
LBL-ISI East
80 ms
1000 Mbits/sec
LBL-ANL
60 ms
45 Mbits/sec
LBL-KU
50 ms
45 Mbits/sec
The results are shown in Table 4. All testing used Linux 2.4 as a sending host. The first row is the results with no tuning (with the default TCP buffers set to 64 KBytes, and Linux 2.4 autotuning disabled). The second row shows results for the Linux 2.4 autotuning option, with autotuning
5
Table 4 . Experimental throughput using four tuning methods. Tuning Method
LBL-CERN
LBL-ISI east
LBL-ANL
LBL-KU
No Tuning
2 Mbits/sec
5 Mbits/sec
5 Mbits/sec
6 Mbits/sec
Linux 2.4 Autotuning
6 Mbits/sec
110 Mbits/sec
12 Mbits/sec
9 Mbits/sec
Hand Tuning
18 Mbits/sec
266 Mbits/sec
17 Mbits/sec
27 Mbits/sec
Enable Tuning
18 Mbits/sec
264 Mbits/sec
16 Mbits/sec
26 Mbits/sec
repetition. The approaches that follow attempt to improve efficiency while maintaining a reasonable level of precision. A fairly conservative policy is to measure all clients at least once to insure precision. This approach allows a reasonably reliable database of paths and bottlenecks to be developed. By measuring the pairwise behavior at least once, some network pathologies can be avoided. For example, two clients might appear to be on the same subnet, but one might be directly connected via Ethernet, while the other is connected via a (relatively slow) dialup server. The bottleneck in the former case would likely be somewhere in the wide area network, while the dialup link would be the constraint in the latter case. Direct measurement would clearly identify the differing bottleneck locations. Once the performance of a client/server pair is measured and a bottleneck link is identified, a table of clients and bottlenecks can be created. The Enable service then suppresses additional redundant testing to clients with the same bottleneck link, and sets a time after which further pairwise testing might be performed. Tests to one of the clients behind the bottleneck can still be performed more frequently to update the state of the constraining link. An example appears in Table 5. In this example, it can be seen that the bottleneck for clients 129.237.116.6 and 129.237.127.152 is the same, that is, 164.113.232.202. Occasional testing to one of 129.237.116.6 or 129.237.127.152, but not both, would be performed to update the state of the performance constraint.
parameters set to allow up to 4 MByte TCP buffers. The third row is hand-tuned iperf, meaning that iperf was run with a range of TCP buffer settings, and the setting which gave the maximum throughput is shown here. The fourth row is the result from iperf using the TCP buffer size value returned by the Enable service, which used ping and pipechar to estimate the optimal TCP buffer size using the following standard formula, as described in [35]: optimal TCP buffer = RTT x (speed of bottleneck link) The Enable server runs a ping test, sending a 1500 byte packet 5 times. The round trip time is estimated to be the average time for ping packets 2-5. The Enable server also runs pipechar with the -bot option, which gives the speed of the bottleneck hop in the network path between the Enable server host and the client. From this table one can see that Linux 2.4 autotuning helps considerably, but not as much as hand tuning and Enable tuning. Hand-tuned and Enable-tuned clients both had nearly identical results. Note that when doing this type of testing on production networks, the variability of the results is very high, and these numbers are all just rough estimates. However the overall improvements from tuning are quite clear.
6.0 Scalability Issues We are currently addressing a number of scalability issues that arise when running active network test tools.
6.1 Aggregation for Measurement Efficiency
Table 5 Bottlenecks to Clients
In order to scale the Enable service to networks with many clients, measurements need to be aggregated to avoid redundant tests for hosts on the same subnet. Aggregation involves the abstraction of a set of individual pairwise performance behaviors by a single performance characteristic. This is a widely used method to improve the scalability of routing and quality of service schemes. Unfortunately, there is a fundamental trade-off between precision and scalability in any such aggregation technique. The Enable service is implementing several schemes, discussed below, which may be selected based on the preferred policy. The default, and likely most precise, approach is to measure each pairwise path with a reasonably high rate of
Client
Bottleneck Router
129.237.116.6
164.113.232.202
129.237.127.152
164.113.232.202
131.243.2.12
131.243.128.100
131.243.2.91
131.243.128.100
192.195.6.68
144.232.0.171
The Enable service also implements more aggressive, less precise schemes for aggregation of measurements. A simple approach is to base the decision on the bottleneck characteristics. Tools such as pipechar provide
6
have shown that the optimal number of streams depends on a number of factors, including host load / processing power, and congestion of the network. The Enable server will base it’s estimate on both the client library’s estimate of the host CPU speed and the server’s network testing results. We also plan to do more detailed analysis of the results of the various network tests, so that we can detect anomalies and make better TCP window estimates. When we can accurately identify results that lie outside the realm of normal measurement error, we might throw out the value, flag the result as a “temporary anomaly”, generate a email message to a network administrator, and so on. Another issue we need to address is that of asymmetric paths. Internet routing data as shown that as many as 20% paths are asymmetric, especially very long paths [15]. Any measurements or tuning based on round-trip time on an asynchronous path may be meaningless. We want to explore this issue further. The other future work that we have planned is to add support for providing network Quality of Service (QoS) advice. There are many predictions that soon networks will support various levels of QoS, and applications will be able to request a given QoS level depending on application requirements. We envision that the decision of which QoS level to request will be even more difficult than determining the optimal TCP buffer setting, and we believe the Enable service has the potential to help applications with this decision.
both bottleneck identification and traceroute information from server to client. If pipechar indicates that a host is behind a known bottleneck with particular characteristics (perhaps below a certain bandwidth threshold), any subsequent clients appearing behind that bottleneck might receive like treatment. For example, if the bottleneck is below T1 rates, it might be assumed that all other clients behind that bottleneck, as determined by traceroute, are limited by that particular link and that no additional tests are necessary within a certain time frame. Another scheme is based upon identification of subnets. In particular, a client sharing an IP address prefix with another client already in the table gets similar treatment. The extent of the client network might be based on routing advertisements, and determined by querying a Looking Glass [18] server. This obviously abstracts away the internal details of the client networks in favor of simplicity. The choice of aggregation policies can be determined when the service is configured.
6.2 Measurement Frequency Sophisticated mechanisms for controlling the test frequency are also needed to provide scalability. The Enable service can base these decisions on the measurements themselves and on the client requests. In particular, the measurements on a particular path will likely be correlated in time. The degree of time correlation can be used to determine the valid period for a particular measurement, and hence the time at which testing should be resumed. This can also be combined with the client requests (specifically the size of transfer requested) to determine if additional measurements need to be derived from the transfer itself and the parameters need to be updated accordingly. In addition, it is necessary that the service implement an aging and purging mechanism to remove old clients so that the database size does not increase monotonically.
8.0 Conclusions Network tuning is critical for applications to fully utilize high-speed networks, yet determining the proper tuning parameters can be quite difficult, especially for users who are not network “wizards”. The Enable service described here can help applications achieve the same performance as hand-tuned applications. We believe the most valuable use of the Enable Service will be in Data Grid applications, where by installing an Enable Server on each Data Grid file server, applications can easily maximize their throughput to or from those servers. The Enable server and client libraries are available for download at http://www-didc.lbl.gov/ENABLE/.
6.3 Other Scaling Issues There are other ways in which scalability can be improved. For example, the Enable service should have the ability to monitor the load that all its tests are placing on the network, to ensure that its total load does not exceed some predefined threshold. The Enable architecture allows a single server to implement this in a straightforward fashion. Future work might investigate ways in which Enable servers on the same network might coordinate to control testing loads on shared paths.
9.0 Acknowledgments This work was supported by the Director, Office of Science. Office of Advanced Scientific Computing Research. Mathematical, Information, and Computational Sciences Division under U.S. Department of Energy. The LBNL work is under Contract No. DE-AC03-76SF00098, and the University of Kansas work is under Contract No. DE-FC03-99ER25399. This is report no. LBNL-47611.
7.0 Future Work A great deal of work remains to be done on the Enable service. The next scheduled addition is the ability to give advice on the number of parallel streams to use. Our tests
7
10.0 References [1]
Allcock B., Bester, J., Bresnahan, J., Chervenak, A., Foster, I., Kesselman, C., Meder, S., Nefedova, V., Quesnel, D., Tuecke, S., “Secure, Efficient Data Transport and Replica Management for High-Performance Data-Intensive Computing”, http://www.globus.org/
[2]
Baru, C., R. Moore, A. Rajasekar, M. Wan, “The SDSC Storage Resource Broker,” Proc. CASCON'98 Conference, Nov.30-Dec.3, 1998, Toronto, Canada.
[3]
bbftp: http://ccweb.in2p3.fr/bbftp/
[4]
Bethel, W., B. Tierney, J. Lee, D. Gunter, S. Lau, “Using High-Speed WANs and Network Data Caches to Enable Remote and Distributed Visualization”, Proceeding of the IEEE Supercomputing 2000 Conference, Nov. 2000.
[5]
[6]
[21]
Mathis, M., “Pushing Up Performance for Everyone”, Talk Slides, http://www.ncne.nlanr.net/news/workshop/1999/ 991205/Talks/mathis_991205_Pushing_Up_Performance/
[22]
Nettest: “Secure Network Testing and Monitoring”, http://www-itg.lbl.gov/nettest/
[23]
“NetSpec: A Tool for Network Experimentation and Measurement”, Information & Telecommunication Technology Center, University of Kansas, http://www.ittc.ukans.edu/netspec/ NCFTP: http://www.ncftp.org/
[25]
National Transparent http://www.ntonc.org/
Chervenak, A., Foster, I., Kesselman, C., Salisbury, C. and Tuecke, S. “The Data Grid: Towards an Architecture for the Distributed Management and Analysis of Large Scientific Data Sets”. Journal of Network and Computer Applications, 2000.
[26]
pchar: http://www.employees.org/~bmah/Software/pchar/
[27]
Jin, G., Yang, G., Crowley, B., Agarwal, D., “Network Characterization Service”, Proceedings of the IEEE High Performance Distributed Computing conference, August 2001, http://www-didc.lbl.gov/NCS/
Dovrolis, C., Ramanathan P., Moore. D., “What Do PacketDispersion Techniques Measure?”, Proceedings of the 2001 Infocom, Anchorage AK, April 2001.
[28]
Particle Physics Data Grid: http://www.ppdg.org/
[29]
python: http://www.python.org/
[30]
Semke, J. Mahdavi, M. Mathis, “Automatic TCP Buffer Tuning,” Computer Communication Review, ACM SIGCOMM, volume 28, number 4, Oct. 1998.
[31]
Sivakumar, H, S. Bailey, R. L. Grossman, “PSockets: The Case for Application-level Network Striping for Data Intensive Applications using High Speed Wide Area Networks”, Proceedings of IEEE Supercomputing 2000, Nov., 2000. http://www.ncdm.uic.edu/html/psockets.html
[32]
Steenkiste, P., “Adaptation Models for Network-Aware Distributed Computations,” 3rd Workshop on Communication, Architecture, and Applications for Network-based Parallel Computing, Orlando, January, 1999.
[33]
http://www.w3.org/TR/SOAP/
[34]
SuperNet Network Testbed Projects: http://www.ngi-supernet.org/
[35]
Tierney, B. “TCP Tuning Guide for Distributed Application on Wide Area Networks”, Usenix ;login, Feb. 2001 (http://www-didc.lbl.gov/tcp-wan.html).
[36]
Tierney, B. Lee, J., Crowley, B., Holding, M., Hylton, J., Drake, F., “A Network-Aware Distributed Storage Cache for Data Intensive Environments”, Proceeding of IEEE High Performance Distributed Computing conference (HPDC-8), August 1999, LBNL-42896.
[37]
“The WEB100 Project, Facilitating Effective and Transparent Network Use”, http://www.web100.org/
[38]
Wolski, R., N. Spring, J. Hayes, “The Network Weather Service: A Distributed Resource Performance Forecasting Service for Metacomputing,” Future Generation Computing Systems, 1999. http://nws.npaci.edu/NWS/.
[39]
XML-RPC: http://www.xmlrpc.org/
Earth Systems Grid Project: http://www.scd.ucar.edu/ css/esg/
[8]
EU DataGrid Project, http://www.eu-datagrid.org/
[9]
Fisk, M., Feng, W., “Dynamic Adjustment of TCP Window Sizes”, LANL Report: LA-UR 00-3221.
[10]
GriPhyN Project: http://www.griphyn.org/
[11]
“GridFTP: Universal Data Transfer for the Grid”, White Paper, http://www.globus.org/datagrid/ Hoschek, W., Jaen-Martinez, J., Samar, A., Stockinger, H. and Stockinger, K., Data Management in an International Data Grid Project. In Proc. 1st IEEE/ACM International Workshop on Grid Computing, 2000, Springer Verlag Press. Bangalore, India, December 2000. http://www.cern.ch/grid/
[13]
HPSS, “Basics of the High Performance Storage System”, http://www.sdsc.edu/projects/HPSS/
[14]
iperf: http://dast.nlanr.net/Projects/Iperf/index.html
[15]
Kalidindi, S., Zekauskas, M., “Surveyor: An Infrastructure for Internet Performance Measurements”, Proceedings of INET ‘99, http://www.isoc.org/inet99/4h/4h_2.htm
[16]
Lee, J., D. Gunter, B. Tierney, W. Allock, J. Bester, J. Bresnahan, S. Tuecke, “Applied Techniques for High Bandwidth Data Transfers across Wide Area Networks”, Dec. 2000, http://www-didc.lbl.gov/publications.html
[17]
Jacobson, V., “Congestion Avoidance and Control,” Proceedings of ACM SIGCOMM ‘88, August 1988.
[24]
[7]
[12]
[20]
Linux 2.4 autotuning: http://www.linuxhq.com/kernel/v2.4/doc/networking/ip-sysctl.txt.html
[18]
Looking Glass: http://www.traceroute.org/
[19]
Lui J., and Ferguson, J., “Automatic TCP socket buffer tuning”, in Supercomputing 2000 Research Gems, Nov. 2000, http://dast.nlanr.net/Features/Autobuf/.
8
Optical
Network
(NTON);