18th International Conference on Ships and Shipping Research 2015, June 24th – 26th, Lecco, Italy M. Altosole and A. Francescutto (Editors)
ENERGY EFFICIENT OPERATION OF BULK CARRIERS BY TRIM OPTIMIZATION
1
2
M. M. MOUSTAFA , W. YEHIA , Arwa W. HUSSEIN
1 2 3
3
Port Said University, Pot Said, Egypt,
[email protected]
Port Said University, Pot Said, Egypt,
[email protected] Port Said University, Pot Said, Egypt,
[email protected]
ABSTRACT The main Energy efficiency and environmental concerns are compelling shipping companies to consider improving vessels fuel efficiency. Reducing fuel consumption which is almost considered as the largest part of operating cost has a beneficial environmental impact by reducing greenhouse gas emissions. There are many ways for optimizing shipboard energy efficiency, but sometimes the simplest changes offer the largest gains. This study is focusing on operating a ship at optimum trim in order to keep fuel consumption at minimum. Trim optimization studies are not limited to new ship designs; it can easily be implemented on existing ships. In this study, a bulk carrier is targeted for research in order to optimal trim configuration which leads to less resistance to minimize fuel usage. The results showed that even small adjustment of the trim will lead to significant fuel savings due to large resistance variation. The relation between the resistance variations and ship speed at three loading condition is studied. In order to interpret the change in resistance, the physics behind less fuel consumption due to changed propulsive power when trimming a vessel has been analyzed. The reference bulk carrier has been investigated at three loading conditions at different speed range. It was concluded that a resistance can be reduced by about 14% only due to a slight afterward trim.
1. INTRODUCTION The transport sector is under considerable pressure to increase fuel efficiency. While CO2 emissions are falling in many other sectors, transport emissions are expected to rise in the future. Shipping currently accounts for about 3% of global CO2 emissions, but its share is expected to grow as a result of increased transportation, in combination with difficulties in implementing effective fuel efficiency measures and replacing fossil fuels. On the other hand, high fuel prices are compelling shipping companies to consider how the fuel efficiency of vessels can be improved in order to reduce cost. Since the fuel cost is by far the largest portion of the operating cost of a vessel, a fractional savings in fuel usage can result in considerable savings in operational costs. Many operational optimizations measures for marine vessels focus on minimizing the fuel consumption by optimizing the vessel speed. However, during a typical cruise, the captain of the ship must meet a predefined schedule which limits the scope for speed optimizations. Technical measures that reduce fuel consumption in a cost-efficient way have resulted in highly efficient marine engines and power trains, optimized flow profiles around hull, rudder and propeller, and innovations such as the bulbous bow. Still, it is not unusual for individual ships to
© 2015 Organising Committee NAV 2015 ISBN 978-88-940557-1-9
484
M. M. MOUSTAFA, W. YEHIA, Arwa W. HUSSEIN
consume up to 30% more fuel than necessary due to imperfect design, badly used propulsive arrangements, or a poorly maintained hull and propeller. High expectations of improved energy performance from technical improvements are also found in a report for the Marine Environment Protection Committee of IMO, which estimates that design measures could potentially reduce CO2 emissions by 10% to 50% per transport work. Nevertheless, there are still gaps remaining between current knowledge and the implementation of energy efficiency measures by shipping companies, (Pétursson,2009). In 2011 The Marine Environment Protection Committee (MEPC) of the UN International Maritime Organization (IMO) adopted mandatory measures to reduce emissions of greenhouse gases (GHG’s) from international shipping. That decision marked the first ever mandatory global greenhouse gas reduction regime for an international industry sector. The amendments to the International Convention for the Prevention of Pollution from Ships (MARPOL) add a new chapter on energy efficiency regulation for ships. That chapter makes the Energy Efficiency Design Index (EEDI) mandatory for new ships, and the Ship Energy Efficiency Management Plan (SEEMP) mandatory for all ships,(IMO,2011) . The Energy Efficiency Design Index (EEDI) provides a figure, expressed in grams of CO2 per ton mile that measures the attainable energy efficiency of a specific ship design. It enables the designer to optimize the various parameters at his disposal and provides an energy rating for the ship before it is built. The Index will, therefore, stimulate technical development of all the components influencing fuel efficiency. Through the application of this Index, ships in the near future will have to be designed and constructed intrinsically energy-efficient. Trim optimization is one of the effective measures to reduce fuel consumption. Trim optimisation studies are not limited to new ship designs; it can easily be implemented on existing ships. Many researchers and parties started to study this issue. (Larsen et al. 2012), studied the physics behind changed propulsive power when trimming a vessel in order to detect the origin of the changes. It was concluded that the major effect resulting in changed propulsive power when a vessel is trimmed is the residuary resistance coefficient acting on the hull resistance. However, the propulsive coefficients were at a level of approx. 20% of the total savings and cannot be disregarded totally if accurate power at the specific condition is needed. (Minchev et al, 2013), made a bulk carrier new design to meet the IMO EEDI Requirements. The design changes included hull lines, alternatives of main engine/propeller RPM selection, application of energy saving and other items. (Sherbaz and Duan , 2014) , made trim optimization for container ship. In that study, a CFD simulation technique was deployed for container ship hull trim optimization. Ship hull parameters, in even keel condition, at different Froude numbers are attained by computational techniques and compared to experimental values to validate mesh, boundary conditions, and solution techniques. The results showed that trim has pronounced increasing effect on resistance during bow trim. The effect on resistance is varying during stern trim. In this paper, trim optimization is studied for Bulk Carrier ship for three loading conditions. This study is purely theoretical analysis based on commercial software MAXSURF, 2007, which is an integrated suite of software for the Design, Analysis & Construction of all types of marine vessels and offshore structures. This analysis is made for three loading conditions for three speeds. Optimum trim is defined as the trim which gives minimum resistance. The minimum resistance consequently gives less fuel consumption. The effect of the trim at different variables such as: wetted surface area, water line length, frictional resistance and residuary resistance is studied to explain the change in the resistance. After defining the optimum trim, the performance of the ship at the optimum trim is also studied. 2. SHIP ENERGY EFFICIENCY The IMO has agreed that “sustainability”, the theme of World Maritime Day for this year, should be a driver in the development of the future regulatory framework. There is no doubt that the concept of sustainability will also influence the industry in areas outside the scope of the IMO. The term ‘sustainability’ includes concepts such as the ability to endure, remain productive over time, and maintain well-being. This concept is based on three ‘pillars’ relating to environmental, economic and social considerations. Sustainability can also be defined as achieving the balance between environmental challenges, safety issues and economic considerations. The shipping
© 2015 Organising Committee NAV 2015 ISBN 978-88-940557-1-9
485
M. M. MOUSTAFA, W. YEHIA, Arwa W. HUSSEIN
industry should, in the long term, be able to meet future challenges and regulations from the economic point of view. The IMO, in July 2011, adopted measures to reduce ships’ emissions of greenhouse gases (GHG) i.e. the Energy Efficiency Design Index (EEDI) and the Ship Energy Efficiency Management Plan (SEEMP). The EEDI has been made mandatory for new ships and the SEEMP for both new and existing ships, through amendments to MARPOL Annex VI (resolution MEPC.203(62)). According to the IMO1, the adoption of these mandatory measures for new ships (EEDI) and for all ships in operation (SEEMP) from 2013 onwards will lead to significant emission reductions i.e. by 2020, up to 180 million tons of CO2 annually; a figure that, by 2030, will increase to 390 million tons of CO2 annually. The reductions will be between 9 and 16% in 2020 and between 17 and 25% by 2030 compared with current practice. The emission reduction measures will also result in significant fuel cost savings to the shipping industry, although these savings will require higher investments in more efficient ships and more sophisticated technologies than today (Cazzulo,2013).
2.1 Measures for new ships – EEDI The EEDI is a complex formula but a simple concept. It is a minimum energy efficiency level, expressed in grams of carbon dioxide (CO2) per capacity-mile of the ship. In simple terms, a smaller EEDI value represents a more energy efficient ship design. The calculation of the EEDI value is based on technical design parameters for different ship types and sizes, and assumptions regarding fuel consumption (in g/kWh) compared to the power installed on the ship. The EEDI represents a measure of the design efficiency for new ships, but it does not give any indication concerning their actual operational efficiency. Two ‘sister’ ships of the same design with the same EEDI may have different emissions depending on their payload, sea conditions and the way the ships are operated. 2.2 Measures for new and existing ships – SEEMP The SEEMP is an operational measure that establishes a mechanism to improve the energy efficiency of both new ships and ships-in-service in a cost-effective manner. The SEEMP provides an approach for shipping companies to manage their fleet by using, for instance, the non-mandatory Energy Efficiency Operational Indicator (EEOI), or any other kind of index intended to provide information concerning operational efficiency, based on individual ship’s fuel consumption and transported payload (e.g. cargo tones, number of passengers, etc.). In this respect, it is important to note that CO2 emissions are directly proportional to fuel consumption (using carbon conversion factors, such as the ones established by the IMO for marine diesel, light and heavy fuel oils). The ship’s actual energy efficiency, however, does not only depend on fuel consumption but also on the amount of transport work undertaken and the level and intensity of activities. 2.3 Fuel Saving By Trim Optimization
The hydrodynamic efficiency of a vessel may be significantly affected by the trim. Awareness of the vessel performance in different trimmed conditions is therefore an essential step towards improving the operational efficiency and reducing the fuel consumption and corresponding emissions to air. Vessels are traditionally optimized for a single condition, normally the contract speed at design draft. Actual operating conditions quite often differ significantly. At other speed and draft combinations, adjusting the trim can often be used to reduce the hull resistance. Defined simply, the optimum trim is the trim angle at a given condition (displacement and speed) where the required propulsion power is lower than for any other trim angle at that condition. A trim optimization study seeks to find the optimum trim angles by investigating a range of normal operating conditions for a particular ship or class of ships. There are several ways to assess the effect of trim on hull resistance and fuel consumption, including in service measurements, model tests and numerical analyses. It is hard to get accurate results from full-scale trials due to various disturbances. Model tests are associated with scaling issues. Calculations may be carried out in many ways with different levels of accuracy.
© 2015 Organising Committee NAV 2015 ISBN 978-88-940557-1-9
486
M. M. MOUSTAFA, W. YEHIA, Arwa W. HUSSEIN
3. REFERENCE VESSEL The vessel under study in this paper is a bulk carrier. Trim is defined as the difference between the draught at AP (TA) and the draught at FP (TF). Trim = TF – TA, this results in negative trim to the aft. Table 1. Main Particulars of the Reference Vessel Item
Value
Item
Value
Length overall Breadth Full load Draft (even keel) Block coefficient Water plane area coefficient
160.56 m 23.11m 10.0 m 0.758 0.859
Length between perpendiculars Depth Full load Displacement Mid-ship area coefficient
149.38 m 23.11m 27682 tons 0.981
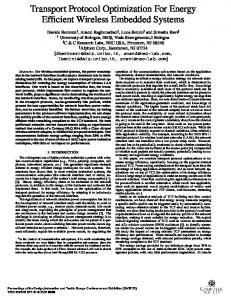
4. RELATION BETWEEN TRIM ANGLE AND RESISTANCE In this section the relation between the trim angle and ship resistance is studied. In this study, ship resistance is calculated by Holtrop-Mennen’s method, (Holtrop and Mennen, 1982) using Hullspeed-MAXSURF software. Different scenarios are assumed for trim angle. For each scenario the total resistance is determined. The calculations are made for three drafts; 8, 9 and 10 m. For each draft three speeds were studied; 14, 15 and 16 Knots. Figure 1, Figure 2 and Figure 3 show the results. One can notice from all the figures that the resistance varies with trim angle. The angle at which the resistance is minimal will be called optimum trim angle. Although the resistance increases with increasing the speed and the draft, yet, the minimum resistance occurs almost at the same angle. For draft 8m, the optimum trim is almost 2 degrees by aft, while for drafts 9 m and 10 m, the optimum trim is 1.4 and 0.6 degrees by aft respectively. Table 2 summarizes the results of optimum trim. Table 2. Optimum Trim Points in Degrees Ship Speed in knots T (m) 14 15 16 8 -1.94 -1.97 -2 9 -1.25 -1.32 -1.4 10 -0.5 -0.55 -0.6
Figure 1. Ship Total Resistance versus Trim Angle for T= 8m
© 2015 Organising Committee NAV 2015 ISBN 978-88-940557-1-9
487
M. M. MOUSTAFA, W. YEHIA, Arwa W. HUSSEIN
Figure 2. Ship Total Resistance versus Trim Angle for T= 9m
Figure 3. Ship Total Resistance versus trim angle for T= 10m 5. EFFECT OF TRIM The objective of this section is to examine what causes the change in resistance when the ship is trimmed. The possible explanations are: • Wetted surface area. • Water line length. • Frictional resistance. • Residuary resistance. 5.1 Wetted Surface Area The change in the wetted surface area during trim is studied to interpret the reduction in resistance. Figure 4 shows the relation between trim angle and the wetted surface area. The variation in wetted surface area due to trim relates mainly to the full shape of the aft part. Percentage-wise the wetted surface area variation is small. It varies from -0.4% to 1.8%. However, the effect on the total saving due to trim can be considered minimal.
© 2015 Organising Committee NAV 2015 ISBN 978-88-940557-1-9
488
M. M. MOUSTAFA, W. YEHIA, Arwa W. HUSSEIN
Figure 4. Wetted Surface Area versus Trim Angle 5.2 Water Line Length The change in the water line length will affect the frictional resistance through the change in Reynolds Number. Trim by fore will decrease the water line length while trim by aft will not affect the water line length, Figure 5. Note that the relation between the frictional resistance coefficient and the water line length is inverse proportion.
Figure 5. Water Line Length versus Trim Angle 5.3 Frictional Resistance The frictional resistance at ship speed of 15 knots is calculated using MAXSURF program for each trim. One can conclude from Figure 6 that the frictional resistance does not depend on the trim angle since the variation is very small.
© 2015 Organising Committee NAV 2015 ISBN 978-88-940557-1-9
489
M. M. MOUSTAFA, W. YEHIA, Arwa W. HUSSEIN
Figure 6. Ship Frictional Resistance versus Trim Angle 5.4 Residuary Resistance Figure 7 shows the relation between the residuary resistance at ship speed of 15 knots and the trim angle. The residuary resistance appeared to be trim-dependant. It is also obvious from the figure that when the ship trims by fore the residuary resistance will be smaller than that of aft trim. Nevertheless, for each draft there was an aft trim angle which gives minimum residuary resistance. It can be concluded that the major part of the reduction in resistance is caused by changes in the residuary resistance. It is also concluded that the maximum residuary resistance reduction occurs at draft 8m. The reduction reached 25%,
Figure 7. Residuary Resistance versus Trim Angle 6. SHIP PERFORMANCE DURING OPTIMUM TRIM In this section the performance of the ship at optimum trim angles is studied. Ship resistance of the even keel scenario is compared with the optimum trim resistance, Figure 8. It is clear from the figure that the resistance reduction increases at small draft; 8 m. While at draft 9m the reduction is smaller. Comparing the resistance at the same draft, one can conclude that the reduction in the resistance increases with increasing the speed.
© 2015 Organising Committee NAV 2015 ISBN 978-88-940557-1-9
490
M. M. MOUSTAFA, W. YEHIA, Arwa W. HUSSEIN
Figure 8. Resistance at Optimum Trim Angles Figure 9 shows the relation between the resistance coefficients and the draft at V =14 knots. It is clear from the figure that the residuary resistance coefficient changes with the drat while the frictional resistance coefficient is almost constant. The same result was concluded for v= 15 and16 knots.
Figure 9. Ship Resistance Coefficients versus Draft at V = 14 knots The reduction of the resistance is calculated for the three drafts at three speeds. Figure 10 shows the results. It is concluded that the reduction in the resistance depends on the draft and the speed. The relation is linear and decreases with increasing the draft. The higher the speed, the higher the reduction. The highest reduction in the resistance occurs when the speed is 16 Knots at 8 m draft, which almost reached 14%.
© 2015 Organising Committee NAV 2015 ISBN 978-88-940557-1-9
491
M. M. MOUSTAFA, W. YEHIA, Arwa W. HUSSEIN
Figure 10. Resistance Reduction at Optimum Trim Angle 7. CONCLUSIONS In this paper energy efficient operation of bulk carrier is studied. The efficient operation is achieved by trim optimization to give minimum resistance. The calculations were made for three loading conditions at three speeds. From the calculations it was concluded the following: • When the ship trims, the wetted surface area, the waterline length and the resistance changes. • The change in the wetted surface area is minimal while there is noticeable change in the waterline length. • Although the waterline length changes, the change in the frictional resistance is minimum. • There is significant change in the residuary resistance which explains the change of the total resistance. An important conclusion is that the change in the resistance during trim is interpreted by the change of the residuary resistance. At the optimum trim, it was concluded that the change in the resistance is draft and the speed dependant. The higher the speed, the higher the reduction. The maximum reduction occurs at small drafts. The highest reduction in the resistance occurs when the speed is 16 Knots at 8 m draft, which almost reached 14%. Trim optimization is a perfect option to save fuel: it is not limited to new ship designs but it can easily be implemented on existing ships. The results of this paper showed that the simplest changes offer the largest gains with minimum cost. REFERENCES Stefán Pétursson, 2009,“Predicting Optimal Trim Configuration of Marine Vessels with respect to Fuel Usage”, Master thesis, Faculty of Industrial Engineering, Mechanical Engineering and Computer Science School of Engineering and Natural Sciences University of Iceland Reykjavik. International Maritime Organization IMO, “Marine Environment Protection Committee”, Report of the marine environment protection committee on its sixty-second session, MEPC 62/24/Add.1, 26 July 2011. Nikolaj Lemb Larsen, Claus Daniel Simonsen, Christian Klimt Nielsen, Christian Råe Holm, 2012 th “Understanding The Physics of Trim”, 9 annual Green Ship Technology (GST) conference Copenhagen, March 2012.
© 2015 Organising Committee NAV 2015 ISBN 978-88-940557-1-9
492
M. M. MOUSTAFA, W. YEHIA, Arwa W. HUSSEIN
Anton Minchev, Michael Schmidt, Soeren Schnack, 2013, “Contemporary Bulk Carrier Design to Meet IMO EEDI Requirements” , Third International Symposium on Marine Propulsors smp’13, Launceston, Tasmania, May 2013. Salma Sherbaz and Wenyang Duan, 2014,“Ship Trim Optimization: Assessment of Influence of Trim on Resistance of MOERI Container Ship”, The Scientific World Journal , Volume 2014 (2014), Article ID 603695, 6 pages. User Manual, MAXSURF Software, Windows Version 13, Formation Design System Pty Ltd 1984-2007. Roberto P. Cazzulo, 2013 “Energy Efficiency and Implementation of New Technologies in the Context of Sustainable Shipping”, IMO World Maritime Day Symposium on Sustainable Maritime Transportation System, IMO Headquarters, London, 26 September 2013. Holtrop J., Mennen G.G.J., 1982, “An Approximate Power Prediction Method”, International Shipbuilding Progress, 29 (335), 1983.
© 2015 Organising Committee NAV 2015 ISBN 978-88-940557-1-9
493