Proceedings of the 16th International IEEE Annual Conference on Intelligent Transportation Systems (ITSC 2013), The Hague, The Netherlands, October 6-9, 2013
TuC1.5
Enhanced Obstacle Detection based on Data Fusion for ADAS Applications Fernando García, Arturo de la Escalera and José María Armingol Intelligent Systems Lab. Universidad Carlos III of Madrid
[email protected] Abstract² Fusion is a common topic nowadays in Advanced Driver Assistance Systems (ADAS). The demanding requirements of safety applications require trustable sensing technologies. Fusion allows to provide trustable detections by combining different sensor devices, fulfilling the requirements of safety applications. High level fusion scheme is presented; able to improve classic ADAS systems by combining different sensing technologies i.e. laser scanner and computer vision. By means of powerful Data Fusion (DF) algorithms, the performance of classic ADAS detection systems is enhanced. Fusion is performed in a decentralized scheme (high level), allowing scalability; hence new sensing technologies can easily be added to increase the trustability and the accuracy of the overall system. Present work focus in the Data Fusion scheme used to combine the information of the sensors at high level. Although for completeness some details of the different detection algorithms (low level) of the different sensors is provided. The proposed work adapts a powerful Data Association technique for Multiple Targets Tracking (MTT): Joint Probabilistic Data Association (JPDA) to improve the trustability of the ADAS detection systems. The final application provides real time detection of road users (pedestrians and vehicles) in real road situations. The tests performed proved the improvement of the use of Data Fusion algorithms. Furthermore, comparison with other classic algorithms such as Global Nearest Neighbors (GNN) proved the performance of the overall architecture.
I. INTRODUCTION Safety applications require the most trustable sensor systems, able to provide accurate and reliable detections. In recent years, sensor fusion is becoming frequent in road safety applications. By means of sensor fusion, limitations inherent to each sensor technology can be overcome, fulfilling the strong demands of road safety applications. Data Fusion techniques deal with the process of fusing information for multiple devices. On this proposal, a data fusion architecture is presented, where two typical sensors in ADAS applications are used, laser scanner and computer vision, to detect roads users i.e. pedestrians and vehicles. By means of advance association and tracking algorithms the performance of classic ADAS systems is augmented.
The proposed work represents a combination of powerful Data Fusion (DF) techniques using two well known automotive sensors. The architecture is based on a decentralized scheme with two independent low level systems (laser scanner and computer vision) and a final
978-1-4799-2914-613/$31.00 ©2013 IEEE
approach based on a Multiple Target Tracking (MTT) algorithm, Joint Probabilistic Data Association (JPDA). By combining, at high level, the detections from different sources, trustability is increased. The scalability of the system allows the easy integration of future sensing devices. Furthermore, the independence of both subsystems, helps to provide detection even in extreme situations (e.g. if any of the sensors is not available). Finally, the JPDA approach represents a highly adaptable algorithm, able to overcome difficult situations in the tracking stage, such as occlusions, crossings, etcetera. The paper is divided as follows: section II depicts the state of the art, regarding data fusion applications for pedestrian or vehicle detection and tracking. Section III provides a general overview of the proposal. Section IV gives a brief explanation of the low level algorithms used. In section V the Data Fusion scheme is detailed. Finally in section VI results of the different tests are shown and in section VII some conclusions are discussed. II. RELATED WORKS Fusion approaches in Intelligent Transport Systems can be divided according to the fusion architecture used: In centralized architectures, the fusion is performed by an unique decisor. It provides classification based on the features obtained from a set of information that includes information of all sources. A preprocessing stage is usually mandatory, to build the features vector. Premebida et al. ([1] and [2]) present different works based on sets of features from laser scanner and computer vision, the final pedestrian detection is based on different configurations: Naïve Bayes, Gaussian Mixture Model Clasifiers, Neural Networks, Fuzzy Logic Decision Algorithm, and Support Vector Machines, the results of the different approaches are compared. Decentralized architectures require different classifiers that have limited information, generally based on a single sensor. A higher stage combines the information based on the information from the different subsystems. Premebida et al. present a work based on decentralized fusion [3] for pedestrian detection, based on visual Adaboost detection and Gaussian Mixture Model (GMM) for laser scanner, a Bayesian decisor is used to combine detections at high level. In [4] Spinello and Siegwart perform pedestrian detection based on multidimensional features for laser scanner detection. Histograms of Oriented Gradients (HOG) features and Support Vector Matching (SVM) are used for computer vision detection. Finally a Bayesian model provides high level fusion. In [5] Garcia et al. provide pattern matching for
1370
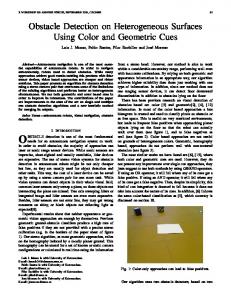
Figure 1. General desciption of Data Fusion Architecture.
laser scanner, and stereovision detection based on the vertical projection of the human silhouette, the fusion stage is based on Global Nearest Neighbor (GNN) association algorithm. Other approaches combine the information according to the possibilities or the technology of each sensor. Broggi et al. [6] use information from laser scanner to detect zones of the environment, where pedestrians can be located, and with reduced visibility (e.g. space between two vehicles), a final computer vision based approach for pedestrian detection is used in these regions. Labayrade et al. [7] combine information from a stereovision camera and a laser scanner, removing those obstacles not relevant for the application (outside the road). A set of obstacles is created using the information from both sensors; finally tracking is performed based on laser scanner information and Kalman Filter (KF). III. GENERAL DESCRIPTION As previously explained, the present work proposes an innovative system that combines different information sources (i.e. laser scanner, computer vision, inertial system and context information), capable of providing trustable road environment detection and classification. This detection focuses on road users i.e. pedestrians and other vehicles (Figure 1). A. Low level detections Low level is related to the detection and classification of obstacles using the different sensors independently (i.e. laser scanner and camera).
In order to reduce false positives and to provide reliable detections, the laser scanner was considered for obstacle detection for both subsystems, providing Regions of Interest (ROIs). The reliability and accuracy of the laser scanner for obstacle detection make it the best option for this task. In order to provide accurate position of the obstacles in the camera field of view, data alignment is mandatory. This process transforms the information from the laser scanner coordinate system to the camera coordinate system. Pin-hole model and accurate extrinsic on-line calibration was used for this coordinate change. After creating the ROIs, classification of the obstacles is performed by both subsystems independently. As both regions of interest are acquired from the same sensor (laser scanner), the inter-sensor association is inherent to the ROI creation algorithm. Laser based detection uses the exceptional behavior of the laser scanner and the pattern of the movements of the objects for classification. Limited information and some common errors due to strong pitching movements, dust, etc., make this classification difficult. Here, fusion plays an important role to avoid these misdetections. Vision based detection is based on classical vision algorithms, which proved to be useful and trustable in different applications. B. Data Fusion Finally, the fusion procedure deals with the low level detections, creating fused tracks. It involves track management (creation, deletion and update), movement estimation and data association. Joint Probabilistic Data Association Filter (JPDAF) is used to perform the data association and movement estimation. IV. LOW LEVEL DETECTION
Figure 2. IVVI 2.0 platform with a detail of the laser scanner used and the innertial sensor used.
The data received by the laser is corrected according to the movement of the vehicle. Misdetection due to time differences between the spots are avoided, allowing accurate shape reconstruction. The clouds of points are clustered using Euclidean distance. Once the segments are created, the points contained
978-1-4799-2914-613/$31.00 ©2013 IEEE
1371
within each segment are merged using lines known as polylines [8]. These obstacles are used for classification, creating sets of ROIs according to the sizes that match pedestrians or vehicles. Later both vision subsystem and laser scanner subsystem performs obstacle classification. A. Laser scanner classification According to the polyline reconstruction, six obstacles can be differentiated: L-shaped, road borders, big obstacles, possible pedestrians, pedestrians and vehicles [8]. Present work deals with two of them: Pedestrians [5] and vehicles [8]. Which are those obstacles that match the pattern, size and movement of the corresponding obstacle. Pedestrian classification First, according to the size of the polylines reconstructed, the obstacles with sizes similar to a human being are selected as possible pedestrians. This set of Regions Of Interest is later checked by both laser scanner and computer vision system. The size of the pedestrian is selected according to anthropometric researches ([9] and [10]), that defines human being as an ellipsis with certain size.
(a)
(b)
(c)
Figure 4. Laser scanner based vehicle detection. (a) Representation of the pattern provided by the laser scanner with a moving vehicle. (b) polyline reconstruction (c). Example in a real sequence.
Thanks to the pattern of the moving vehicle (Figure 4), the angles of the polylines and the distance among points, the velocity of the detected vehicle and its direction can be calculated. Tracking Stage Due to the limited information provided by the laser scanner, false positives are expected. In order to solve this inconvenient, a tracking stage was designed to observe the behavior of different obstacles during a specific period of time. Obstacles are searched within a window, according to the size and the movement of the obstacles from previous scans. Before the final classification, several movement based filters are used to correct false positives. These filters are associated with impossible movements, changes of sizes, etcetera. The final classification is provided based on the last ten detections for a given obstacle, using a voting scheme.
Figure 3. Laser scanner pedestrian detection examples.
Pedestrian classification is performed according to a pattern based on legs movement [5] (Figure 3). The approach was selected among others available for laser scanner pedestrian identification: [11] is based on static location of several single layer laser scanners. Detection is based on the definition of the movement of the legs, and the swing of the legs pivoting in the other one. This model is limited to approaches with multiple scanners, in static locations and at close distances. Other approaches ([1] and [2]) perform pedestrian detection based on statistical knowledge and machine learning algorithms. These approaches have the problem of the difficulty of statistical generalization of the multiple patterns and spots given by the pedestrians. Finally an alternative solution is provided in [12], detection is performed based on torso identification. The selected implementation is the most suitable according to the location of the laser scanner, in the bumper of the vehicle (Figure 2), the information available and nature of the application. Vehicle classification Vehicle classification is based on the specific behavior of the laser LMS 291 S-05 from SICK (Figure 2). It allows the identification for a specific pattern that is dependent on the movement of the vehicle, allowing also the detection of the velocity and tracking of the vehicle [8].
978-1-4799-2914-613/$31.00 ©2013 IEEE
B. Computer Vision Classification Obstacles detected by the laser scanner are provided to the computer vision algorithm, using pin-hole model, and with an accurate extrinsic parameter calibration (Figure 5).
Figure 5. Laser scanner detections (polyline reconstruction) extrapolated to the camera with accurate precision.
Two sets of (ROIs) are provided to the camera system, for pedestrians and vehicles respectively. Each of the sets correspond to obstacles with sizes similar to the obstacles to be identified (Figure 6). Finally computer vision classification is performed in two different ways, according to the obstacle to be identified: - Vehicles. Haar-Like features with cascade classifiers was used for vehicle detection. This fast algorithm, originally used for face detection [13] , is based on the fast detection of certain features easy to be identified in an image. In vehicles, common features can be found in the back or front of the vehicle (e.g. lights or license plates). Thus this approach is a very suitable and time efficient solution for vehicle detection.
1372
where ê 6 "áë y ê 6 "áì are the standard deviation for the measurements in x, y coordinates. :à is the state vector of the KF, H the observation model and F the state transition model. The errors are modeled by Q and R which are the covariance of the process noise and the covariance of the measurement noise respectively. B. Data Association Data Association algorithm implementation is based on JPDA technique, adapted here for ADAS application, it allows tracking pedestrians and vehicles in road environments. It is an extension of Probabilistic Data Association algorithm ([15] and [16]), developed for single target tracking, to a MTT environment. Figure 6. Examples of region of interest creation (up) and the final detection (down).
- Pedestrian. Based on Histogram of Oriented Gradients (HOG) features with Support Vector Machine (SVM) for classification. This is a classical approach for pedestrian detection, presented for the first time in [14]. V. FUSION PROCEDURE Fusion procedure is based on a powerful MTT approach, JPDAF. It is the adaptation of the Joint Probabilistic Data Association with an estimation filter, in this case based on the KF. The movement of the targets is based on a constant velocity target model. A. Estimation As it was remarked before, estimation filter for both targets is based on constant velocity model and KF (1-5): T U (1) :à L NR O ë Rì s *LB r
r s
r r
r C r
(2)
s r ( L Nr r
r s r r
P r r P s rO r s
(3)
4LF
ê
6
r
"áë
r
ê
6
"áì
G
(4)
The detections provided by the subsystems at time k are Ý denoted as VÞ L [VÞ _ , where j goes from 0 to mk. A clutter (j=0) is introduced (artificial measurement that represents no association, to provide mathematical completeness). Assuming a Markovian process and using Bayes theorem, the joint association probability of an association can be described as follows. /HW GHQRWH WKH MRLQW DVVRFLDWLRQ HYHQW DQG Ei kh the particular event that associates measurement m to a track j. The joint association probabilities are defined as:
2:E
i;
L
i;
s ’:œi Eá
:E
= P Í ë u Î Î 6 6 3 L Î =ë P Î t Î r Î r Ï
6 6
=ë P t
r
=ë r r
6
r =ì 6 P 7 u =ì 6 P 6 t
978-1-4799-2914-613/$31.00 ©2013 IEEE
Ð Ñ r Ñ Ñ =ì 6 P 6 Ñ t Ñ =ì 6 Ñ Ò
(6)
where K is a normalization constant, Xk is the target state vector. :E i ; is the probability of the assignment E conditioned to the sequence of the target sequence states vector which is defined as:
:E
i;
L
H
Q?l
:s F
ka ?:Q?l; l H ; JE
(7)
where PD is the detection probability, PFA is the false alarm probability. n is the number of assignments to the clutter, mk is the number of detections and M is the number of targets. Finally the association likehood (’:œi Eá i ; ) is defined assuming a 2 dimensional gaussian association likelihood, for all the measurements to the target. The joint probability of a single measurement j to the target i would be:
‰ gáh L
s :tN;R 6 §+ gh +
‡
?
b_á` . 6
(8)
where di,j is the Euclidean distance between the prediction and the observation. Si,j is the residual covariance matrix. Since a Cartesian approach was used§+
6 7
i;
Thus finally the resulting 2:E
r
(5)
2:E
i;
L
H
Q?l
:s F
H;
l
i;
JE
gh +
L Pv Pw and N=2.
is:
ka ?:5?Q;
ka
Ñ ‰ gáh
(9)
h@5
Finally all the association hypotheses are weighted in the updating stage of the KF. The innovation is calculated using all possible combination weighted for the likehood for this association.
1373
k
i
L Íc2:E g@5
i ;k
gái F
á i i i?5 og
(10)
where Ik is the innovation covariance for the KF of a given track. C. Track management Two kinds of tracks were defined, consolidated and non consolidated tracks. Consolidated tracks refer to those tracks with positive detection reported by both sensors subsystems. Non consolidated tracks are the tracks that were detected by a single sensors, thus with not enough certainty to be reported. Track creation and deletion policy has a key role in the algorithm: A new track is created when a given detection falls out of the gates of all the available tracks i.e. there is no match for the given detection. A track is eliminated if no detection is included within the gate after a given number of frames. This process is defined as track maintenance. Track maintenance refers to the process of maintaining a track, when a given detection falls in the gate of the track. In order to assure the stability of the system, detections are only allowed to provide maintenance to a single track. Thus when a given detection falls within the gate of more than one track, it is used for maintenance only for the highest match. However in the updating process of the estimation filter, this detection is used in all the tracks on which gate the detection falls, as it is defined by JPDA algorithm as shown in equation 10. The presented algorithm could, in certain situations, reach to unstable behavior, when several tracks compete for a single observation. In these situations, the cluster is always the most powerful option, due to the weight of the joined probabilities of the other options than the one to be calculated in a given time. To avoid this situation, where all the new detections would imply the creation of a new track, reaching to an unstable behavior, a special rule was defined: Once a given association is assigned, the associated pair (track and detection) is eliminated from the assignation process, and all the joined probabilities are recalculated with the remaining tracks. This way the weight of the already assigned solutions is not included in subsequent assignations. Hence in these potentially unstable situations, this solution would first assign cluster to the less probable detection, and eliminate the weight of this detection in subsequent assignations, until one of them is selected as more likely than the cluster. The proposed solution allows the convergence of the system to the best solution, with the cost of the recalculation of the likelihoods, which proved to be negligible in the overall process.
comparison involves low level results and two fusion approaches. Two fusion approaches were JPDA algorithm presented in this proposal and a GNN approach, based on the presented in [5], which was implemented for the test. The results proved that the system was able to enhance the low level results, providing better performance. Regarding to low level detections, it was very interesting the high positive rate obtained, with the limited information provided, by the laser scanner. On the other hand, the amount of misdetections for the laser was also very high, as it was expected due to repetitiveness of the patterns caused by the limited information available.
Figure 7. Low level Detection Examples. Red detections are vision detections, blue squares correspond to laser scanner pedestrian detection and yellow are the laser scanner vehicle detections.
It has to be remarked that the training process used for the camera approaches were performed taking into account the results of the laser scanner subsystem. Due to the high amount of false positives given by the laser scanner system, the vision system was trained to obtain the lowest false positive rate possible. Besides, the camera systems did not include a tracking stage, thus the positive results expected were lower. This situation is visible in the case of vision based vehicle detection. Although the amount of no-detection errors for vehicles was high, it was proved that all the vehicles in the images were positively detected. Thus even in the worst case scenario, any vehicle is detected after one or two frames. Hence the low amount of false positives in the visual approaches allowed to overcome the excessive number of errors in the laser scanner approach. It is also very interesting the improvement of the results provided by the JPDA system, in comparison to other fusion approaches, already available, such as GNN. The improvements were remarkable for false positive rate, which considerable decreased for JPDA in comparison with GNN. This is mainly due to the best behavior of JPDA in challenging situations, such as merging groups of pedestrians, false detections or occlusions.
VI. TEST AND RESULTS Different test were performed in both urban and interurban scenarios, with more than 10,000 frames, in real road situations. Results are depicted in table 1. Results 978-1-4799-2914-613/$31.00 ©2013 IEEE
VII. CONCLUSIONS Finally we can conclude, given the results presented in table 1, that the fusion process allows to combine information
1374
% Pos
Camera % Err
Laser Scanner % Pos % Err
% Pos
Pedestrians
72.97
Vehicles
47.72
GNN % Err
% Pos
% Err
5.27
74.56
13.3
77.69
3.11
82.29
1.11
1.13
91.03
8.19
88.25
2.59
92.03
0.59
JPDA
Table 1. Test results for low level detection (Camera and Laser Scanner) and fusion system, GNN and the JPDA presented here. Err for false positive errors in the detections per frame.
from the camera and the laser scanner and helps to overcome the limitations of the system, enhancing the capacities of classic ADAS obstacle detection algorithms and providing reliable detection. Limitations inherent to each sensor and their algorithms are overcome thanks to the use of data fusion approach. First, computer vision has the trustworthiness limitations due to the unstructured information. Laser scanner detection is used to overcome this problem. On the other hand, the limited information given by the laser scanner is completed thanks to the high amount of data given by the computer vision sensor.
[4]
[5]
[6]
[7]
[8]
[9]
[10] [11]
[12]
[13]
[14]
Figure 8. Tracking examples in challenging situations. Left two pedestrian crossing, righ vehicle turning in a roundabout. Black points represents a pedestrian detection, red the not match detections. Axis represent distance in meteres for Cartesian coordinates.
[15] [16]
ACKNOWLEDGMENTS This work was supported by the Spanish Government through the Cicyt projects (GRANT TRA2010-20225-C0301) and (GRANT TRA 2011-29454-C03-02). CAM through SEGAUTO-II ( S2009/DPI-1509) . REFERENCES [1]
[2]
[3]
& 3UHPHELGD 2 /XGZLJ 0 6LOYD DQG 8 1XQHV ³$ &DVFDGH Classifier applied in Pedestrian Detection using Laser and ImageEDVHG )HDWXUHV ´ Transportation, pp. 1153-1159, 2010. & 3UHPHELGD 2 /XGZLJ DQG 8 1XQHV ³/,'$5 DQG 9LVLRQ-Based PedestULDQ 'HWHFWLRQ 6\VWHP ´ Journal of Field Robotics, vol. 26, no. Iv, pp. 696-711, 2009. & 3UHPHELGD * 0RQWHLUR 8 1XQHV DQG 3 3HL[RWR ³$ /LGDU DQG Vision-based Approach for Pedestrian and Vehicle Detection and
978-1-4799-2914-613/$31.00 ©2013 IEEE
1375
7UDFNLQJ ´ IEEE Intelligent Transportation Systems Conference ITSC, pp. 1044-1049, 2007. / 6SLQHOOR DQG 5 6LHJZDUW ³+XPDQ 'HWHFWLRQ 8VLQJ 0XOWLPRGDO DQG 0XOWLGLPHQVLRQDO )HDWXUHV ´ 2008 IEEE International Conference on Robotics and Automation, pp. 3264-3269, 2008. F. Garcia, B. MuVOHK $ ' (VFDOHUD DQG - 0 $UPLQJRO ³)XVLRQ Procedure for Pedestrian Detection Based on Laser Scanner and 9RPSXWHU 9LVLRQ ´ LQ 2011 14th International IEEE Conference on Intelligent Transportation Systems ITSC, 2011, pp. 1325-1330. A. Broggi, P. Cerri, S. Ghidoni, P. Grisleri, and H. G. Jung, ³/RFDOL]DWLRQ DQG DQDO\VLV RI FULWLFDO DUHDV LQ XUEDQ VFHQDULRV ´ LQ Intelligent Vehicles Symposium, 2008 IEEE, 2008, pp. 1074-1079. 5 /DED\UDGH & 5R\HUH ' *UX\HU DQG ' $XEHUW ³&RRSHUDWLYH Fusion for Multi-Obstacles Detection With Use of Stereovision and /DVHU 6FDQQHU ´ Autonomous Robots, vol. 19, no. 2, pp. 117-140, 2005. ) *DUFtD HW DO ³(QYLURQPHQW 3HUFHSWLRQ %DVHG RQ /,'$5 6HQVRUV IRU 5HDO 5RDG $SSOLFDWLRQV ´ Robotica, vol. 30, no. 2, pp. 185-193, 2012. 5 - 6NHKLOO 0 %DUU\ DQG 6 0FJUDWK ³0RELOLW\ 0RGHOOLQJ ZLWK (PSLULFDO 3HGHVWULDQ DQG 9HKLFXODU 7UDIILF &KDUDFWHULVWLFV ´ WSEAS Transactions on Communications, vol. 4, no. 10, 2005. Highway Capacity Manual 2000, no. 193. Transportation Research Board, National Academy of Sciences, 2000. + = + =KDR DQG 5 6KLEDVDNL ³$ 1RYHO 6\VWHP IRU 7UDFNLQJ Pedestrians Using Multiple Single-Row Laser-5DQJH 6FDQQHUV ´ IEEE Transactions on Systems Man and Cybernetics Part A Systems and Humans, vol. 35, no. 2, pp. 283-291, 2005. / 2OLYHLUD DQG 8 1XQHV ³&RQWH[W-Aware Pedestrian Detection 8VLQJ /,'$5 ´ LQ Intelligent Vehicles Symposium IV 2010 IEEE, 2010, pp. 773-778. 3 9LROD DQG 0 -RQHV ³5DSLG 2EMHFW 'HWHFWLRQ 8VLQJ D %RRVted &DVFDGH RI 6LPSOH )HDWXUHV ´ Proceedings of the 2001 IEEE Computer Society Conference on Computer Vision and Pattern Recognition CVPR 2001, vol. 1, no. C, p. I-511-I-518, 2001. 1 'DODO DQG : 7ULJJV ³+LVWRJUDPV RI 2ULHQWHG *UDGLHQWV IRU Human DeWHFWLRQ ´ 2005 IEEE Computer Society Conference on Computer Vision and Pattern Recognition CVPR05, vol. 1, no. 3, pp. 886-893, 2004. Y. Bar-Shalom and X.-R. Li, Estimation and tracking - Principles, techniques, and software. Boston: Artech House. S. Blackman and R. Popoli, Design and analysis of modern tracking systems(Book). 1999.