XIX IMEKO World Congress Fundamental and Applied Metrology September 6−11, 2009, Lisbon, Portugal
ENHANCING THE INTERPRETABILITY OF TERAHERTZ DATA THROUGH UNSUPERVISED CLASSIFICATION Henrike Stephani 1, Michael Herrmann 2, Karin Wiesauer 3 , Stefan Katletz 3 , Bettina Heise 4 1
Fraunhofer Institute for Industrial Mathematics (ITWM), Kaiserslautern, Germany,
[email protected] 2 Fraunhofer Institute for Physical Measurement Techniques (IPM), Kaiserslautern, Germany,
[email protected] 3 RECENDT GmbH, Linz, Austria,
[email protected],
[email protected] 4 Johannes Kepler University (JKU), Department of Knowledge-Based Mathematical Systems, Linz, Austria,
[email protected]
Abstract − We present the applicability of hierarchical agglomerative cluster algorithms to terahertz (THz) spectroscopic analysis. We show the influence of different windowing and filtering methods in the spectral data preprocessing to enhance the clustering results. Two distance measures are compared. Classical Euclidean distance on the full frequency range and a distance working only on the minima of the spectra. We further show the adaptability of our clustering methods for THz hyper-spectral image classification and visualization.
Keywords: Clustering, THz Spectroscopy, THz Imaging 1. INTRODUCTION The faster data is generated the faster one is confronted with the necessity of computer aided data organization. The goal of cluster analysis is to categorize a given amount of data without prior knowledge about the resulting classes. With the development of efficient emitters and detectors both THz spectroscopy as well as THz hyper-spectral imaging are becoming important scientific and practical topics [1]. These technologies are particularly interesting for non-invasive testing and security control. Most chemical compounds, such as drugs and explosives, have characteristic absorption lines in the THz spectral range. Therefore their fingerprint regions can be found in the transmission spectra. THz spectroscopy and hyper-spectral imaging are mainly based on pulsed THz systems, where time-domain signals (pulses) are recorded. To obtain the transmittance from the measured data a number of calculations have to be executed, such as Fourier transform to the frequency domain and considering a set of reference data. Consequently, small flaws in the original measurements can have big impact on the resulting transmittance. To cope with that problem, it is advisable to execute pre-processing and filtering steps before applying a
ISBN 978-963-88410-0-1 © 2009 IMEKO
cluster algorithm. The cluster algorithm itself mainly depends on the similarity measure and the features it works on [2]. While in spectroscopy those are a subset or a transform of the transmittance over the respective frequencies, in imaging, information from the time resolved as well as frequency resolved spectra is combined. Thus similarities expressed in different dimensions can be visualized. 2. METHODS To suppress the influence of side effects due to the finiteness of the measurement, of artefacts such as overlap or echoes of pulses, and of measurement noise, various preprocessing steps are applied. These are windowing in the time domain, filtering out frequencies with a low spectral density, and smoothing in the spectral domain. An important step of clustering itself is the determination of an appropriate distance measure. We compare Euclidean distance on all frequencies with clustering on a preselected number of frequencies. 2.1. Pre-processing and Filtering It is a common method to apply apodization functions prior to the Fourier transform to eliminate undesirable effects. In nearly all time resolved measurements one has to deal with the fact that the Fourier transform acts on the assumption of infinite periodic signals while experimentally given data usually is finite. Thus the effect of spectral leakage has to be considered. In addition to that, especially in THz measurements one can have the problem of more than one pulse appearing in one signal. This is commonly observed due to multiple reflections of the THz pulse within the sample or the optics, resulting in echo pulses succeeding the original pulse. However this can also appear for laterally inhomogeneous samples, when due to the relatively low lateral resolution in the millimetre-range two regions with different properties are within the focus of the THz beam.
2329
Then, both regions contribute to the measured signal and if the THz pulse experiences different time-delays, doublepulse features are observed. The calculated spectra will then contain the overlapping frequencies of both pulses and not show characteristics of each one of them separately. The problem of identifying different pulses within one spectrum is non trivial as their amplitudes might have similar heights and they might be close together and therefore not only overlap in the frequency domain but already in the time domain. A first approach used here is to assume the maximal amplitude to be the one of interest, i.e. the sample pulse, and to neglect any other pulses. The latter is considered to be undesired information and therefore filtered away. For that a Nuttall window with a support chosen depending on the width of the reference pulse is used. To eliminate the effect of spectral leakage a broad Hamming window is used [3]. Before calculating the transmittance, the noise floor and the dynamic range given by the reference measurement are used to determine the relevant frequency range. Measurements outside the dynamic range are not considered, spectral densities below the noise floor are smoothed generously [4]. The transmittance in general is smoothed lightly to suppress measurement noise. Two filtering methods are compared, namely Wavelet shrinkage and a Savitzky-Golay filter. The latter is one of the most prominent filters in chemometrics. This is due to its easy and fast calculability as well as its capacity to preserve peaks [5]. The other approach is Wavelet shrinkage [6]. The main idea of Wavelet transformation is a loss free hierarchical decomposition of a signal on a basis of so called Wavelets which can be considered band pass filters with certain desirable properties. The main advantage compared to the Fourier transform is the possibility to express characteristics with respect to frequency as well as time. In that way it is possible to control the degree of influence certain frequencies have on the signal depending on the interval they occur in. Although the amount of information one gets is quite sophisticated the discrete Wavelet transform is computationally very efficient thanks to a down-sampling mechanism that is applied during the procedure [7]. 2.2. Clustering One of the main problems in organizing a big amount of spectra especially in hyper-spectral imaging is that while the information per pixel contains hundreds of channels the final visualization is reduced to a two or at most three dimensional image. An approach often used to give a first impression of the content is to show single features such as the time delay or the main amplitude of the THz pulse. Changing to the spectral domain the integral over the valid frequency range might be used as a feature or the integral over the relevant part of the frequency range. To do the latter the region of interest of the spectrum must be known beforehand, e.g. looking for lactose in a THz spectrum one would chose only the frequencies around 0.5 THz as the characteristic peak can be found in that region. A problem with that method arises if a number of unknown compounds
are expected to appear. The integral over the whole relevant frequency range might be equal although the spectra are not. Furthermore if the characteristic regions of a spectrum are not known beforehand one cannot specify the region of interest. Therefore rather than taking only the absolute integral of each spectrum as a feature it is advisable to calculate distances between the spectra, thus validating them with respect to each other, and organizing the data according to that distance. This is achieved by using clustering algorithms. Clustering is also known as unsupervised classification. Classification in general deals with assigning classes to a given set of data. In supervised classification the desired classes are known beforehand and a sufficiently characterizing set of samples from each class is given. In clustering, only the data is given and is being ordered with respect to a certain distance measure. The distance between samples in one class is to be minimized while the distance between clusters is to be maximized. Clustering algorithms are divided in at least two groups: partitional and hierarchical algorithms. While in partitional clustering the data is distributed to classes on one level, in hierarchical approaches the clustering is carried out iteratively. Though hierarchical algorithms are slower than partitional ones they do not need initial parameters and thus work more adaptively. Furthermore they provide the user not only with the clusters but also with information about the distance between these clusters [8]. Therefore clustering the spectra is executed with a hierarchical method. The procedure of classical agglomerative clustering operates in the following way: Starting with one sample per cluster in each iteration the closest clusters are united. Assuming a given distance between the samples the closeness of the cluster is defined by the link function. There is a generalized form of this function [9]. When merging the clusters C j and Ck the distance of the resulting cluster
C jk to another cluster Cl will be:
D(Cjk , Cl ) = α j D(Cj , Cl ) +αk D(Ck , Cl ) + ...
(1)
... β D(C j , Ck ) + γ | D(C j , Cl ) − D(Ck , Cl ) | . The distance used in this paper is the complete link distance where the coefficients in (1) are set to {α j , α k , β , γ } = {1/ 2,1/ 2, 0,1/ 2} . Good results are achieved with this method when edges between clusters are unclear and need to be emphasized. 2.3. The Distance Measure The result of clustering is mainly influenced by the chosen distance measure. Most commonly used in metric spaces is the Euclidean distance or another Minkowski distance measure. The main disadvantage of this approach is the so called “curse of dimensionality” [10]. Handling many dimensions, the accumulations of small differences over all frequencies can have the same effect as one big differing peak. The proposed alternative approach is useful in coping with this. THz spectra have comparatively broad bandwidth features. Given a smooth shape of the spectra, it is therefore
2330
possible to find the peaks of each spectrum. Those peaks represent the differences between the cluster. Minima are computationally characterized by being the point where the medium gradient of an interval switches from negative to positive. The choice of the size of the interval and the smoothness of the spectra is essential in finding the relevant peaks instead of noise. The distance measure is then defined as follows: Definition 1: Let
X f = {x1 ,..., xr } be the frequencies
of the minima of sample
S X and Y f = { y1 ,..., yk } be the
frequencies of the minima of sample between
SY . The distance
SY and S X is then defined by:
D(S X , SY ) =
∑
( S X [ f ] − SY [ f ])2 .
f ∈ X f ∪Y f
As most THz spectra of solids have few but broad peaks, an immense feature space reduction is achieved and thereby the problems of high dimensionality are diminished. Furthermore the computational costs of calculating a distance matrix are shrunk considerably.
qualitatively evaluate the effect of the pre-processing steps as well as the outcome of the clustering. Evaluating clustering results is difficult due to the fact that in general one does not know which result is correct. Therefore, a method often used in cluster validation is to first try out clustering on a data set with known results and to then compare the outcome of the clustering with this known result. The aim in clustering the five chemical compounds is to be able to automatically distinguish the compounds from each other without prior knowledge about their form. In this application the transmittance is the basis for clustering. Our second set of test data consists of hyper-spectral images of a plastic toy figure and an envelope containing highly absorbing parts as well as chemicals. 3.1. Spectra of Chemical Compounds Prior to clustering, pre-processing is done in the above mentioned way. In Fig. 1 (bottom) the transmittance of the original and windowed time signals of lactose is shown. The windowing mainly serves to confine the time window so that any echoes or double-pulses are removed. In each spectrum the maximal peak is determined and depending on the resolution the windows are applied. The windowed spectra have clearer peaks and contain less noise - with respect to similarity - than the un-windowed ones.
3. APPLICATION
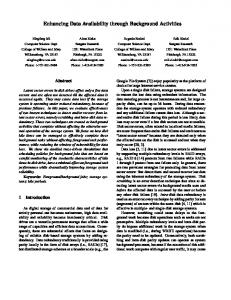
Fig. 2. Reference spectrum, spectrum of lactose and noise. The cyan colored line is the noise floor. The cut off frequency is set to where the spectral information stays within the noise-floor.
To calculate the transmittance from the spectra, the reference pulse, sample pulse, and noise floor are taken into consideration. In Fig. 2 this is presented. Using the dynamic range of the reference, regions with useful information can be found. As the level where a measurement approaches the noise floor differs for each sample, the respective regions are smoothed generously rather than cut off. To further enhance the finding of relevant minima and maxima, it is advisable to apply smoothing filters.
Fig. 1. One signal with two pulses (shown in the upper left) is filtered in a way that only the main pulse remains. The effect on the spectra is shown below.
We apply clustering on two different kinds of test data: firstly on high resolution spectra of five chemical compounds, namely PABA (4-aminobenzoic acid), acetyl salicylic acid, salicylic acid, lactose, and tartaric acid, recording nine spectra of each compound. This is done to
2331
An example of the result can be seen in Fig. 3, where a Savitzky-Golay filter has been used.
Fig. 3. Lactose spectrum filtered and unfiltered.
The Savitzky-Golay filter produces similar results as the Wavelet shrinkage. The peak preservation is slightly better in Wavelet shrinkage while in finding minima and maxima both perform similar. For our further calculations we choose the Savitzky-Golay filter, because it is computationally faster.
Fig. 5. Tree graph showing (parts of) the clustering result. The higher the uniting point of two clusters the bigger the distance between them. The distance between salicylic acid (samples 19-24) and acetyl salicylic acid (samples 1- 6) is bigger in the top level picture, while the misclassification of sample 14 is suppressed at the bottom level and the clusters are clearer.
The classification of the pre-processed and filtered spectra leads to a good result; the outcome of classifying all five components in different groups is achieved with less than 5% misclassification. In Fig. 5 on the top level the clustering result of the whole valid frequency range is shown while the bottom level of Fig. 5 shows the clustering result of the distance measure proposed by Definition 1. The latter produces higher inter-cluster distances, as visualized by the length of the edges but also classifies ASS and Salicylic acid close together, making it hard to distinguish these compounds. In terms of computational time, depending on the respective spectrum the number of minima varied between two and five. Therefore for each two spectra a maximum of ten frequencies is taken to calculate the distance. In comparison to that, for the usual distance calculation about 300 frequencies per spectrum are used. Fig. 4. Logarithmic transmittance of five chemical compounds after pre-processing and windowing
In Fig. 4 example spectra of the five compounds after pre-processing can be seen. These spectra are the basis for the clustering. They show the typical form of THz spectra of solids with only few but broad peaks. As proposed before, classical agglomerative clustering is performed. The evaluation is done by considering misclassifications and quality of clusters in terms of interand intra-cluster distance. Clustering the raw transmittance spectra results in more than 30% misclassification depending on the clustering level.
3.2. Imaging Data Two THz images are used here. The first is a plastic toy figure. The goal of a visualization should be to show the varying thickness of the figure. The second one is a measurement of an envelope containing chemicals as well as highly absorbing material. The different components should be made visible. In both cases the proposed pre-processing steps are applied and improve the visualization considerably. The above mentioned distance measure fails to reduce the dimensionality of the spectra as the majority of the spectra does not have characteristically absorbing peaks.
2332
Amplitude of Signal
Clustered Spectra
100
100
90
90
80
80
70
70
60
60
50
50
40
40
30
30
20
20
10
10
0 0
20
40
60
0 0
20
40
60
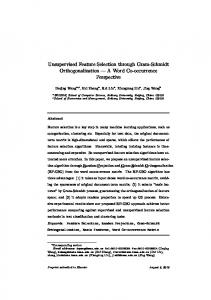
Fig. 6. The left hand side shows the plot of the maximal amplitude in the time domain. The right hand side shows a clustering (of level three) of the pre-processed spectra. In addition to the contour of the figure, the different thicknesses can be seen.
Fig. 8. Segmentation of the envelope by clustering with the amplitude height and position as features. The top shows a clustering at level two, the bottom one of the foreground at level five.
In Fig. 6 a 100x50 pixel measurement of he plastic toy figure is shown. The left hand side shows the main amplitude of the measured signals. The figure can be distinguished from the background by thresholding but the differences within the figure can not be determined by this simple approach. The right hand side of Fig. 6 shows a clustering of the transmittance spectra. The clustering is carried out over the whole valid frequency range. The visualization shows the result at level three, i.e. the first three branches of the tree graph are used. In comparison to the mere amplitude image a finer segmentation in foreground and background as well as in thin and thick parts of the material can be seen.
Therefore, the named clusters as well as the yellow cluster are transformed to the frequency domain and clustered there. The result can be seen in Fig. 9. The top shows the visualization of the image and the bottom the respective spectra belonging to these clusters. The dark red part of the image contains the chemicals; this is clearly detected by the clustering. The corresponding spectra are presented in black at the bottom.
Fig. 7. Visualization of the height of the maximum amplitude of each pulse.
Fig. 7 shows a 38x76 pixel measurement of an envelope with different materials inside. In Fig. 8 a first clustering with the main amplitude height and position as features can be seen. It is used to determine regions of interest and reduce the computational cost of transforming all the pixels to the frequency domain. Only using the time domain features for clustering is limited in quality as can be seen in Fig. 8 at the bottom by the bright red, bright blue, and green clusters which appear within objects as well as at borders of different objects.
2333
Fig. 9. The cyan and dark blue pixels are clusters found by the previous time-domain-clustering (i.e. here they are not used). The grouping found by the spectral clustering at level three is presented. The bottom shows the transmittance spectra of these three groups. The dark red pixel correspond to the black spectra.
REFERENCES [1]
4. CONCLUSION AND FURTHER WORK In this paper it was shown that clustering algorithms are well applicable on THz data. With pre-processing and filtering, spectra of chemical compounds could be organized automatically. Especially in applications where the number of samples has high-volume, clustering is a useful tool. The pre-processing steps used here are windowing functions, spectral density evaluation and filtering methods. All of these steps improved the clustering result. The two compared filtering methods Savitzky-Golay smoothing and Wavelet shrinkage performed comparably well. SavitzkyGolay filtering was chosen for the applications because of its computational efficiency. Wavelet shrinkage has further advantages that were not taken into consideration yet. Those are for example possibilities of dimension reduction and better peak preservation which can be more relevant for other compounds. The latter should be further investigated [11] as should be the possibilities of improving the clustering performance by using incremental methods [12, 13]. Clustering is particularly interesting in hyper-spectral THz imaging, where for a large number of measurements the significant information of the spectra has to be extracted and visualized automatically. Here the clustering was carried out on time-domain features as well as the frequency domain. The clustering presented enriched visualization possibilities in comparison with the traditional approaches which consider the sum over certain frequencies or the main amplitude as features. The proposed distance measure improved the clustering of chemical compounds but was unstable when no characteristic peaks could be found within the spectra. The latter is typical for hyper-spectral images. Other approaches to finding relevant regions as for example using Wavelets should be considered.
[2] [3]
[4]
[5]
[6]
[7] [8]
[9]
[10]
[11]
[12]
[13]
ACKNOWLEDGMENTS H.S. and B.H. thank the colleagues of the Department of Knowledge-Based Mathematical Systems at the JKU, especially Erich Peter Klement for discussion and support. K.W. and S.K. thank M. Koch and B. Scherger from the Institute for High-Frequency Technology, University Braunschweig, for their support in THz imaging and F. Katletz for providing samples. Part of this work has been supported by the BMWi German Federal Ministry of Economics and Technology (THESEUS program, use case ORDO) and the FFG Oesterreichische Forschungsfoerderungsgesellschaft (CIR-CE Project 814906), the Austrian Science Fund (FWF), project number L-507-N20, the European Regional Development Fund (EFRE) and the federal state Upper Austria.
2334
C.A. Schmuttenmaer, "Exploring dynamics in the farinfrared with THz spectroscopy", Chemical Reviews, 104(4), pp. 1759-1780, 2004. T. Warren Liao, "Clustering of time series data - a survey", Pattern Recognition, 38, pp.1857-1874, 2005. J.G. Proakis and D.G. Manolakis, Digital signal processing: principles, algorithms, and applications, Prentice Hall, Inc. Upper Saddle River, NJ, USA, 2007. P. Jepsen and B.M. Fischer, "Dynamic range in terahertz time-domain transmission and reflection spectroscopy", Optics Letters, 30(1), pp. 29-31, 2005. M. Golay and A. Savitzky, "Smoothing and differentiation of data by simplified least square procedures", Analytical Chemistry, 36, pp. 1627-1639, 1964. F. Ehrenteich, SG. Nikolov, M. Wolkenstein, and H. Hutter, "The wavelet transform: A new preprocessing method for peak recognition of infrared spectra", Microchimica Acta, 128(3), pp. 241-250, 1998. S. Mallat, A Wavelet Tour of Signal Processing, Academic Press, 1999. A.K. Jain, M.N. Murty, and P.J. Flynn, "Data clustering: a review", ACM Comput. Surv., 31(3), pp. 264-323, September 1999. R. Xu and D. Wunsch, "Survey of clustering algorithms", IEEE Transactions on Neural Networks, 16(3), pp. 645- 678, 2005. P. Berkhin, "Grouping Multidimensional Data, chapter" , A Survey of Clustering Data Mining Techniques", pp. 25-71, Springer Berlin Heidelberg, 2006. R.K.H. Galvão and T. Yoneyama, "A competitive wavelet network for signal clustering", IEEE Transactions on Systems, Man, and Cybernetics Part B, 34(2), pp. 12821288, 2004. T. Zhang, R. Ramakrishnan, and M. Livny, "Birch: an efficient data clustering method for very large data bases", SIGMOD Rec., 25(2), pp. 103-114, 1996. S. Guha, R. Rastogi, and K. Shim, "Cure: and efficient clustering algorithm for large databases", Information Systems, 26(1), pp. 35-58, 2001.