ENTERPRISE MICROSIMULATION MODELS AND DATA CHALLENGES PRELIMINARY RESULTS FROM THE DIECOFIS PROJECT• Filippo Oropallo○ Abstract: Microsimulation models to study the fiscal impact and the development of micro-founded indicators on enterprise performance require a great deal of information. This is normally scattered in various statistical surveys and administrative sources. Each different data source is conceived to serve different purposes and, in many instances, may refer to different units or different definitions may be used for the same unit. Any attempt to bring together data from different sources has to overcome complex problems in terms of sheer access, and integration and systematisation. The paper shows the analysis of the integration problems that have been faced, the architecture of the integration process that has been adopted. First results bring to the construction of micro-founded indicators and a microsimulation study is carried out to analyze the tax burden on enterprise linked with a performance indicator. Keywords: Data integration, micro-simulation, micro-founded indicators Disclaimer: The views expressed in this paper are that of the author. They cannot and should not be attributed to his employer.
• The work is developed under the DIECOFIS (Development of a system of Indicators on Economic COmpetitiveness and FIScal impact on enterprise performance) project, financed by the Information Society Technologies Programme (5th Research Programme of the European Union) (contract n. IST-2000-31125) coordinated by Paolo Roberti and Maria Grazia Calza, ISTAT, website www.istat.it/diecofis. I am grateful to Alessandro Fazio, Lorenzo Lo Cascio and Danilo Orsini for the valuable contribution to the activities of the Diecofis Project and to the fulfilment of the paper. I would like to express my gratitude to Roberto Monducci, Carlo De Gregorio, Giovanna Dabbicco, Alessandro Zeli, Giampiero Siesto, Cristina Casciano, Giulio Perani, Pasquale Papa (Business Statistics - ISTAT), Manlio Calzaroni, Giuseppe Garofalo, Caterina Viviano, Danila Filipponi, Monica Consalvi and Enrica Morganti (Business Census and Archives - ISTAT) for their availability in collaborating to Diecofis achievements. ° ISTAT (National Statistical Institute of Italy), email
[email protected].
1
Introduction
Understanding how policies affect economic performance and developing better indicators to gauge their effects is central to endow the policy makers with a set of efficient and fair policies. Existing knowledge on policy impact analysis may be considered approximate. Usually the “facts” on the impact of policies are charted only at the aggregate level and with a high degree of approximation. Macro indicators have well-known pitfalls and drawbacks. The gap in European knowledge and capacity for policy impact analysis is patent. The DIECOFIS EU-FP5 project has taken up the challenge of reducing this gap in the field of taxation. Results have been quite encouraging and have open new vistas for future work. Particularly notable has been the development of a system of micro-founded indicators, based on factuals and counterfactuals, estimated through micro-simulation models. Micro-founded indicators on enterprise performance and fiscal microsimulation models require a great effort in integrating data at a micro level. In the construction process of the datasets for microsimulation purposes, several problems were encountered in the combination of data from different sources and the following issues were handled: (i) the reconciliation of survey data with administrative data, (ii) the treatment of missing data and (iii) the sample weights adjustment. This paper presents, in paragraph 2, the multi-source integrated and systematised data base of enterprise data that was created, describing the sources utilised, the architecture of the integration process and the solutions that has were adopted. In paragraph 3 it exposes first results regarding a microsimulation analysis on the distribution of the performance and of the tax burden.
2
DIECOFIS Database1
In order to build the Enterprise Integrated and Systematized Information System (EISIS) the first step is the selection of the “spine” information that will be used as a basis for the integration process. At ISTAT, the “spine” is constituted by the statistical register of Italian active enterprises (ASIA) 2. 1
See Denk, Oropallo F. (2003) Overview of the issues in longitudinal and cross-sectional multi-source databases – www.istat.it/deicofis 2 The ASIA project started in 1995, its goal is to improve and update the register of all Italian enterprises. It is the result of the integration of external sources with ISTAT Archives (old Sirio-nai archive, 7° Industry Census and survey SK). External sources are: VAT Register of
2
Deleted: Oropallo F. Deleted: and Deleted: Denk Deleted: M Deleted: , Deleted: cross.sectional
This is the result of an integration process of different administrative sources and represents the best “hanger” for data integration purposes. On this hanger, information from the following sources can be put. Large Enterprise Accounts (SCI); Small and Medium Enterprise Survey with less than 100 workers (PMI); Manufacturing Product Survey (Prodcom); Foreign Trade Archive (COE); Other surveys such as the Community Innovation Survey (CIS) and the ICT Survey. All of the above ISTAT surveys are based on common EUROSTAT standards and classifications (as shown in chart 1). Chart 1 – General Framework T-n T-1 Survey Sources Industrial Production
Other Surveys: CIS - ICT
Foreign
Company
Tax Returns
Trade d
Accounts c
Data b
T Social Security Data
a
SPINE (Business Register - Census)
Small and medium
Large
Structural Business Statistics
Administrative Sources
f
Enterprises
e
100 percent coverage Sample (a) Enterprise with employees only - This database is shaped by the National Social Security Legislation (b) All enterprises - This database is shaped by the National Tax Legislation (c) Incorporated enterprises only (Their account system is regulated by EU directives) (d) Exporting enterprises only (e) These Sources are governed by: (i) Council Regulations: no 3924/91 - survey of industrial production; (ii) n. 696/93 statistical units for the analysis of the production system; (iii) n. 58/97 - structural business statistics; (iv) Commission Regulation: n. 1618/99 - evaluation of quality of structural business statistics; (f) The Business Register is regulated by: (i) Council Regulation n. 2186/93 - Community Co-ordination in drawing-up business register for statistical purpouses.
This implies that the DIECOFIS database can serve to simulate at a “micro level” the impact of public policies not only in Italy but also in other countries and that a path for the creation of an EU statistical information system has been traced. The main effort which it was necessary to undertake was the development of a methodology to allow data linkage between the information of the above surveys and the whole enterprise universe, represented by the data register on enterprises. In the ASIA archive, ISTAT files all active
the Ministry of Finances; Chambers of Commerce; INAIL (National Institute of Insurance Against Accidents at Work); INPS (National Social Security Institute); Yellow Pages and other specific archives.
3
enterprises3 except for those belonging to Agriculture, Forestry and Fishing (A, B sectors according to NACE classification) and to the Public Sector (L, O91, P and Q). This can be used as a starting point or common basis for the linkage of all survey data. In the ASIA archive the following information is included: identifier (internal code, name, fiscal code, vat number, telephone, address); localisation (geographical reference); typology (economic activity and legal form); demographic (status and transformations); size (turnover and employees). The information coming from the administrative sources that have been integrated in the DIECOFIS database incl ude: Commercial Accounts (CA) data from the Chamber of Commerce annual report that complement ISTAT business survey of account system (SCI and PMI) for all corporate, cooperatives and consortium enterprises only4; Fiscal data (FISCAL) from the Revenue Agency annual tax returns; Social Security data (SSD) from the Italian Social Security Institute (INPS). These two latter sources permit to obtain precise information on tax and social contribution revenues, and thus to calculate the actual tax burden on enterprises, which can be used to test the model’s output (e.g. “counterfactuals”). Looking at the quality of the available information, enterprise size seems to be a “key” variable. In fact, exhaustive information (which covers the whole universe) is available for large enterprises that have at least 100 workers, while for small and medium ones only sample data is available. A second characteristic that appears to be very important is the legal form, as the type of tax that an enterprise is required to pay depends on it. The first problem is to identify the business unit. This means basically choosing a variable which can be a unique key and act as a natural bridge between the different sources. In almost all firms’ databases the ID code is represented by the VAT code or the fiscal code. Another important question relates to possible changes to the business5 during the enterprises’ life. In fact, the same enterprise may appear as a different unit because of transformation events. Usually two types of changes are considered: changes involving a single unit (changes in kind of business classification, in size or localisation); changes in the number of units (death, birth, divestitures and splits, mergers and acquisitions). As a consequence of changes or in the presence of new-born firms, the business register doesn’t contain all the units of a survey and it is necessary to distinguish between the case of new firms and that of transformed units. In the latter case, a problem of identifying the successor of the initial business can arise. In some cases, the VAT number of 3
cf. Eurostat 1999.
4
CA data contains a sample of corporate enterprises which have a precise a legal form. The variable legal form assumes the following values: Sole proprietorship (legal form =0), partnerships (legal form =1), corporates (legal form =2), co-operatives (legal form =3), consortium and other legal entities (legal form >3).
5
cf. Black 2001. 4
the new unit is different but the fiscal code is the same. A correspondence table containing old and new codes or a table containing the fiscal code and the many VAT numbers used by the enterprise has been used in order to solve this kind of problem. This table has been constructed on the basis of VAT code and Fiscal code archives obtained from the Italian Revenue Agency. A further study on this kind of issue and in particular on the business demography is carried out at ISTAT and first results have been published in a Eurostat statistics in focus6. The study deals with the application of exact matching technique to distinguish new born firms and death firms excluding those firms involved in a transforming event.
2.1
Data Sources
At the start the integration process is concerned with the creation of the following datasets, as shown in chart 2: (1) Business Register (years: 1996– 2000) includes basic information on the whole universe of Italian active enterprises, so that the contained characteristics can serve as auxiliary variables in the processes of imputation and estimation, these are: geographical reference, sector of economic activity, legal type, dimension (independent workers and employees) and the annual turnover (for this variable there is a small percentage of missing values). Table 1 – Business Register Year Large Ent. SME Total
1996 8,091 3,862,383 3,870,474
1997 8,684 3,761,446 3,770,130
1998 8,924 4,040,250 4,049,174
1999 9,240 4,122,853 4,132,093
2000 9,741 4,212,916 4,222,657
(2) Survey datasets (Regional datasets, year 1999) include information on 55 thousand firms, coming from Structural Business surveys; information is exhaustive for large corporate firms (roughly 9 thousand firms with 100 workers or more), sample data are available for small and medium enterprises (roughly 46 thousand firms). The 1999 SCI survey (data are available also for year 1998) contains information on 8,734 enterprises. They refer to the universe of large enterprises with 100 or more workers (with the exclusion of the J division, financial sector). Among these, there are more than 7 thousand corporate enterprises. The 1999 PMI survey (data are available also for the
6
cf. Eurostat 2003. 5
Comment [l1]: Bisognerebbe per ciascuna delle fasi dire se si tratti di exact ovvero di statistical matching. E forse anche dare rapidamente conto delle soluzioni adottate, se non proprio fare il riferimento metodologico.
year 1998) contains information on 45,867 enterprises, of which more than 15 thousand are corporate enterprises. Table 2 – Survey data Year Corporate Enterprises (legal form =2)
Non Corporate Enterprises (other legal forms)
Total
SCI (> 99 workers) 1998 1999
PMI ( 99 workers)
SME Enterprises (i
p k : Weight of the kth class;
π k : Share of the observed variable for the kth class; 24
Gini Index formula: ( N + 1) µ p 1 − G= N µ
con
µp =
∑ (N − r + 1)y
r
i
N + N ( N − 1) / 2
e µ=
∑y
r
r
N
µ p and µ show respectively: the mean weighted with the position in the ranking (r = 1 to N) according to the “y” variable and the general simple mean value. The index satisfies the axioms of: (1) Symmetry (anonymity); (2) Independence from the mean (scale); (3) Pigou Dalton’s transfer principle. 25 Decomposition is referred to Branko Milanovic “True world income distribution, 1988 and 1993: First calculation based on household surveys alone” – World Bank, Development Research Group.
20
y k : Mean value of the observed variable in the kth class;
µ : Overall mean value of the observed variable.
The within element measures the concentration level into the group k. The between part measures the contribution to the total inequality of dissimilarities among groups. The overlap component represents the residual part and it is the result of the confusion of the two combined effects: within and between. To explain the overlap effect, three classes can be supposed for the decomposition process. In a situation with a high overlap the queues of the distributions overlie: Chart 9 – High Overlap N
Mean (A) ≈ Mean (B) ≈ Mean (C)
Performance
Thus when they are separated there is no overlap: Chart 10 - No Overlap N
Mean (A)
Mean (B)
Mean (C)
Performance
Within and between components represent each one the sum of the single contribution of every class. Classes that have higher within part refer to classes with higher internal concentration. The class with the higher between part refers to the class with a high-level mean value of performance. The total Gini index and its decomposition are shown in the tables below. Three dimensions of enterprise performance have been considered (Export, 21
Employment and Value added). The concentration level of each dimension is analysed through the most important classification variables (they represent the stratification variables and are included in the Business Register data): NACE sector, Region and size in term of workers. Table 7 - Gini index and its components Gini - Export
Gini - Employment
Classes
Total
Overlap
Within
Between
Total
Overlap
Within
Between
NACE
83.2
33.6
4.9
44.7
Classes NACE
63.8
33.6
5.0
25.2
Region
83.2
50.1
12.1
21.0
Region
63.8
27.7
7.7
28.4
Size
83.2
14.9
11.9
56.4
Size
63.8
0.0
3.3
60.5
Gini - Value Added Classes
Total
Overlap
Within
Between
NACE
73.2
38.5
5.7
29.1
Region
73.2
28.8
9.4
35.0
Size
73.2
6.0
7.9
59.4
Other variables used to discriminate among enterprises are concerned with innovation features. It can be observed that export inequality is very high between enterprises with or without innovation and R&D (26.8). Table 8 - Gini index and Innovation features Gini - Export
Avg. Values (thous. of euro)
Classes
Total
Overlap
Within
Between
Yes
No
Product Innovation
83.2
22.1
39.1
22.1
35154
14266
Process Innovation
83.2
24.6
39.8
18.9
33689
15662
Innovation and R&D
83.2
9.8
46.6
26.8
70146
15939
Product Innovation
63.8
14.9
29.8
19.2
774
356
Process Innovation
63.8
14.2
29.4
20.2
794
350
Innovation and R&D
63.8
11.6
44.2
8.0
855
483
Product Innovation
73.2
18.6
34.6
20.0
51386
22775
Process Innovation
73.2
18.5
34.4
20.4
52149
22782
Innovation and R&D
73.2
13.2
51.3
8.7
57848
31327
Gini - Employment
Avg. Values (thous. of euro)
Gini – Value Added
3.2.1
Avg. Values (thous. of euro)
Performance Indicator
22
When more variables are considered, each one constitutes a particular aspect of enterprise performance. In the general case of m variables, several measures of enterprise performance can be obtained. Considering the Gini properties the between values, deriving from the m decomposition processes, are comparable to each other. A composite indicator can be calculated equal to the mean of all between values for each class. For each variable or dimension it can be written:
G d = w d + b d + Ld
d=1…m The between value of the dth variable can be decomposed in this way: K
b d = ∑ bkd
k =1 d=1…m For each class k=1…K it can be written: m
bk = ∑ bkd d =1
It synthetically represents the sum of performance values for each class. Each performance value is a dimension of the overall performance of the enterprise. The sum of K
bk is equal to: K
m
b = ∑ bk = ∑∑ bkd k =1
0 < b < 100m
k =1 d =1
It represents the sum of all the between components across the classes and the dimensions. Its range is 0 (no classes inequalities for all “dimensions”) and 100m (for all “dimensions” it is only present a inequality among classes with no diversities within the classes and with no overlap effects).
bd
Finally each k , Gini’s between of the dth dimension and of the kth class can be normalized by dividing each one with the maximum of each dimension:
bnkd =
bkd
Max(bkd )
d = 1,..m
The final idea is to gather several performance rankings with a unique ranking. In this case is proposed the mean value of the three dimensions: Composite Indicator = Mean(GINI’s between)26 In general weights for each dimension can be introduced to establish value judgment: 26
This indicator has the following properties: (1) micro-founded (2) purpose oriented (3) consistent (4) decomposable. 23
C=
1 m ∑ wd bnkd m d =1
with 0 ≤ wd ≤ 1 and
∑w
d
=1
d
Several measures of concentration can be obtained to analyse multidimensional aspects of performance. The variables considered are: (i) the value added, which is the remuneration of production factors; (ii) the employment, which is the total number of persons employed; (iii) the total value of exports of enterprises. For each variable different concentration levels can be observed and through the “decomposition process”, different performance rankings can be seen through the groups (between indicator) accordingly to the utilised variable or “dimension” of enterprise outcomes. Table 9 - Different rankings and the Composite Indicator (by business sectors) Sector
Export
Sector
Employment
Sector
Value Added
DK
100.0
I
100.0
K
100.0
DM
92.9
K
41.6
I
DG
76.9
DM
31.0
DL
42.6
DK
DJ
36.4
DB DH
Sector
Composite
I
51.4
48.5
DM
50.1
G
36.4
K
47.3
7.4
DF
28.2
DK
38.2
DG
7.4
DM
26.4
DG
35.2
22.2
G
6.5
E
24.1
DL
16.0
15.6
DA
6.3
DG
21.5
DJ
15.7
DA
14.5
H
5.9
DA
13.6
G
15.5
DF
10.9
DJ
3.7
DK
7.3
DF
13.1 11.5
DI
8.0
E
2.7
DJ
7.0
DA
I
5.7
DL
2.7
DI
2.8
E
8.9
G
3.4
DB
1.2
DL
2.6
DB
8.0
DC
3.4
DH
0.8
DE
1.7
DH
6.0
DN
2.6
DI
0.8
DH
1.5
DI
3.9
DE
2.6
DE
0.4
DB
0.7
H
2.1
DD
0.5
DF
0.1
H
0.4
DE
1.6
K
0.5
DN
0.0
C
0.2
DC
1.1
C
0.0
DD
0.0
DD
0.0
DN
0.9
H
0.0
DC
0.0
DN
0.0
DD
0.2
E
0.0
C
0.0
DC
0.0
C
0.1
3.2.2
Taxation and Economic Performance
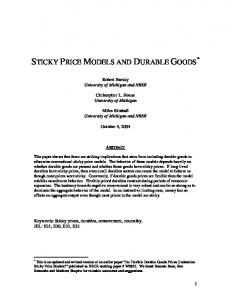
The view behind existing summary tax indicators is that they can be effectively paired with indicators of economic performance and interpreted on the basis of convictions, such as that a negative relationship exists between tax burdens and performance. The high level of aggregation and heterogeneities of various data and often bar the inferences that can be drawn 24
from them. Moreover, averages always hide the dispersion in the distributions from which they are calculated. Summary indicators are no different. Chart 11 - Performance and Tax Burden Simulation by business sector Composite Indicator
Ex post implicit tax rate (IRPEG)
Ex post implicit tax rate (IRES)
50
36%
45 40 35 30 26%
25 20 15 10 5
C
DD
DN
DC
H
DE
DI
DH
E
DB
DA
G
DF
DJ
DL
DG
K
DK
I
16% DM
-
Diecofis has helped to progress on indicators and to shed new light throw new insight into existing relationships. It has made it possible to calculate sets of micro-founded indicators of impact and performance, characterized by high levels of homogeneity and precision (since they refer to the same populations). In turn, this has helped to finely map enterprises and their performance by, sectors, regions, size and so on, using sets of elementary and multidimensional (composite), indicators. As can be seen from Chart 11 and 12, Diecofis has paraded “dwarf” and “giant” enterprises (or groups of them), lined up from top to worst performers (with performance measured by means of a three-dimensional and composite indicator for NACE sector, and enterprises classified by region and size). Since the tax burden for each enterprise in the parade was known, the analysis plots rather precise maps and indications as to how the latter may relate to the former. In addition Chart 11 and 12 contain two different scenarios of corporate taxation: The base scenario (IRPEG) and the IRES scenario27. The first one simulates the former corporate tax system; the second one describes the new tax reform starting from 2004. In the simulation analysis it is possible to identify which business sector, or which region or which group size lose or win following the simulation of the new tax system. One important conclusion that can be drawn from these first results is that the reduction of 27
cf. Bardazzi R., Pazienza M.G., Parisi V. (2003).
25
statutory rates (from 36 to 33%) and the abolition of the dual income tax (lower rate 19% for reinvested income) should produce an increase of the tax burden in some cases. Firms operating in sectors which benefited most from the previous dual income taxation will bear most of the reform cost in terms of higher implicit rate (i.e. E="Electricity, gas and water supply"). Chart 12 - Performance and Tax Burden Simulation by Region and by Size Composite Indicator
Ex post implicit tax rate (IRPEG)
Ex post implicit tax rate (IRES)
50
36%
45 40 35 30 25
26%
20 15 10 5
Composite Indicator
CAL
SAR
MOL
UMB
SIC
VDA
PUG
TAA
CAM
BAS
MAR
TOS
VEN
ABR
EMR
LIG
FVG
LAZ
PIE
16% LOM
-
Ex post implicit tax rate (IRPEG)
Ex post implicit tax rate (IRES) 50 45 40 35 30 25 20 15 10 5
36%
26%
100-199
200-249
250-499
500-999
16% >999
-
The next chart examines the response shares (yes/no) for each innovation feature of the enterprise: product innovation, process innovation, acquisition of technology and research & development, adding the effective tax burden in the two analyzed scenarios: Irpeg (the former corporate tax system) and Ires (the reform scenario). A reduced tax burden can be remarked for those enterprises which make process/product innovations, in other cases the situation should not change. Moreover it is very interesting to observe that a very small share of enterprise acquire new technologies and invest in R&D. Chart 13 – Innovation Features and Tax Burden Simulation 26
Product Innovation
Process Innovation
Ex post implicit tax rate (IRPEG)
Ex post implicit tax rate (IRPEG)
Ex post implicit tax rate (IRES)
Ex post implicit tax rate (IRES) 60%
60% 40%
40%
26%
26%
20%
20% 0%
16% No
0%
Yes
100% 80% 60% 40% 20% 0%
Yes
Innovation and R&D Ex post implicit tax rate (IRPEG) Ex post implicit tax rate (IRES) 36%
36%
100% 80% 60% 40% 20% 0%
26%
16% No
16% No
Acquisition of tech. Ex post implicit tax rate (IRPEG) Ex post implicit tax rate (IRES)
4
36%
80%
36%
80%
26% 16% No
Yes
Yes
Conclusions
The integration of all available information on enterprises into one multisources database performed in the framework of the Diecofis project gives the system high potential and opportunities in terms of economic analysis. It satisfies the data requirements of the microsimulation model for the estimation of the effects of fiscal policies on enterprises’ performance and permits the investigation of more economic issues that can be analysed in a very detailed perspective through new demand driven methods. The use of a systematised and integrated system makes it possible to create new microfounded indicators that are more appropriate to describe different economic systems and to understand their systemic strengths and weaknesses. These first outcomes put out the potentiality of the microsimulation analysis, but many issues will be considered in future developments: adding up data sources of recent years, extend the microsimulation model to small enterprises, reconstructing reliable retrospective information for small enterprises by matching at a stratum level, simulation of consumption taxes (e.g. energy taxes) and cross country simulations. In fact one of the aims of the model is also to facilitate international comparisons of the business sector and its taxation. The Italian contribution has approached the issue from the perspective of a producer of data. Its research work has relied on both statistical surveys and administrative sources, including tax authority information. At the same time it has confirmed the difficulty of making direct comparisons across countries, since approaches are heterogeneous and databases are far from common. In addition, the composition of the business 27
sectors is quite different and tax systems are not easily comparable. Comparisons of different tax systems on a typical business basis approach are possible, but they are believed to be uninformative, since many tax heterogeneities may be hidden behind them. Further work is needed to develop the multi-sourced data and modelling described above in several countries so that, for example, detailed analysis of effective tax rates for large companies can be undertaken or, for small companies, the relationships between tax on directors remuneration and company profits can be compared. The analysis of the sources of heterogeneity across groups and countries is important and should be factored in developing integrated databases and models.
28
5
References
Abbate C. (1997), “Completeness of Information and Imputation from Donor with Minimum Mixed Distance”, Quaderni di Ricerca ISTAT, n. 4/1997, pp. 68-102 Ballin, M., Falorsi, P.D., Falorsi, S., Pallara, S. (2000) Il trattamento delle mancate risposte totali nelle indagini ISTAT sulle Famiglie e sulle Imprese (The Treatment of Total Non-Response in ISTAT) – ISTAT Methodological Studies Bardazzi, R., F., Pazienza, M.G., Parisi, V. (2003), “The Effects of the Italian Tax Reform on Corporations: a Microsimulation Approach” presented at the Public Finance and Financial Markets Conference organised by the International Institute of Public Finance (Prague August 2003) http://www.iipf.org/past.html Black, J. (2001), Changes in Sampling Units in Surveys of Businesses, In: 2001 FCSM Research Conference Papers, US Census Bureau Brick J.M., Kalton G. (1996), “Handling Missing Data in Survey Research”, Statistical Methods in Medical Research, vol. 5, pp. 215-238 Brackstone, G. (1999), “Managing Data Quality in a Statistical Agency”, Survey Methodology, December 1999, vol. 25, pp. 139-149 Denk M., Oropallo F. (2002), Overview of the Issues in Longitudinal and Cross-Sectional Multi-Source Databases, DIECOFIS Deliverable 1.1 www.istat.it/diecofis/deliverable_list.htm Deville J. C., Särndal C. E. (1992), “Calibration Estimators in Survey Sampling”, Journal of the American Statistical Association, vol. 87, pp. 376-382 D’Orazio, M., Di Zio, M., Scanu, M. (2001) Statistical Matching: a tool for integration data in National Statistical Institutes – paper ISTAT for NTTS 2001 – ETK 2001 – Crete Conference 18-22 June 2001 – Eurostat, JRC(ISIS) Estevao, V., Hidiroglou, M.A., Sarnald, C.E. (1995) Methodological Principles for a Generalized Estimation System at Statistics Canada, Journal of Official Statistics 11 (2), 181-204 Eurostat (1999) Use of Administrative Sources for Business Statistic Purposes: Handbook on Good Practices – Theme 4 (Industry, Trade and Services), Eurostat Edition Eurostat (1999), Model quality report in business statistics, Eurostat Working Group “Assessment of quality in business statistics” Eurostat (2003), Business Demography in 9 member states, results for 19972000. Luxembourg: Eurostat, 2003. (Statistics in focus)
29
FCSM – Federal Committee on Statistical Methodology (1980) Report on Exact and Statistical Matching Techniques, Statistical Policy Working Paper 5, Washington, DC: U.S. Department of Commerce Informer SA (2003), Concept of IT framework issues and development of software for the creation of a multi-source data base, DIECOFIS Work Package 2, http://www.istat.it/diecofis/deliverable_list.htm ISTAT (1999) L’innovazione tecnologica nelle imprese (Firms’ Technological Innovation) – Note Rapide – July 1999 (LE Survey) – http://www.istat.it/Imprese/Ricerca-e-/index.htm ISTAT (2000) I risultati economici delle medio-grandi imprese Anni 1998-99 (Economic Performance of Medium-Large Size Enterprises) - Statistiche in breve - July 2000 (LE Survey) - http://www.istat.it/Imprese/Struttura/index.htm. ISTAT (2001a) Indagine Prodcom (Prodcom Survey) – Indagine sulla struttura dei Costi (Cost structure Survey) http://www.istat.it/Imprese-e/index.htm ISTAT (2001b) Struttura e competitività del sistema delle imprese industriali e dei servizi nel 1998 (Structure and competitiveness of industrial and service enterprise system in 1998). - Statistiche in breve - Luglio 2001 (LE & PMI Survey) http://www.istat.it/Imprese/Struttura-/index.htm. ISTAT (2002a) Indagine sul Commercio Estero (Foreign Trade Survey). Current version available at http://www.coeweb.istat.it/ ISTAT (2002b) L’uso delle tecnologie dell’informazione e della comunicazione nelle imprese (The use of ICT in Italian firms) – Statistiche in breve http://www.istat.it/Imprese/Ricerca-e-/index.htm. ISTAT (2002c) - CONCORD v1.0 - (Generalized Data Editing Software) CONtrollo e CORrezione dei Dati – ISTAT 2002 http://www.istat.it/Metodologi/index.htm ISTAT (2002d) - GENESEES v1.0 - GENEralised software for Sampling Estimates and Errors in Surveys – ISTAT 2002 http://www.istat.it/Metodologi/index.htm Jabine, T.B., Scheuren, F.J. (1986) Record Linkages for Statistical Purposes: Methodological Issues. Journal of Official Statistics 2 (3), 255-277 Kadane, J.B. (1978) Some Statistical Problems in Merging Data Files. In: 1978 Compendium of Tax Research, US Dept. of the Treasury, 159–171. (Reprinted in Journal of Official Statistics 17 (3), 423–433 Kalton G., Kasprzik D. (1986), “The treatment of missing survey data”, Survey Methodology, vol. 12, n. 1, pp. 1-16 King M., Fullerton D. (1984), The taxation of income from capital, University of Chicago Press Little R. J. A, Rubin D. B. (1987), “Statistical Analysis with Missing Data”, Wiley & Sons, New York
30
Milanovic, B. (1999) “True world income distribution, 1988 and 1993: First calculation based on household surveys alone” – World Bank, Development Research Group Nardo M., Kioutsioukis I. (EC-JRC 2003), Development of methodologies and of a software for the measurement of statistical quality, and for comparing the robustness of alternative multi-source, integrated databases, DIECOFIS Work Package 3, http://www.istat.it/diecofis/deliverable_list.htm Orcutt G. “A New Type of Socio-economic System”, Review of Economics and Statistics, 80, 1957, pp.1081-1100. Oropallo F., Inglese F., (2004), The Development of an Integrated and Systematized Information System for Economic and Policy Impact Analysis, “The Austrian Journal of Statistics” Vol 33/2004 N. 1&2 Special Issue, www.statistik.tuwien.ac.at/oezstat/. Paass, G. (1986), "Statistical match: Evaluation of existing procedures and improvements by using additional information". G.H. Orcutt and H. Quinke (eds) Microanalytic Simulation Models to Support Social and Financial Policy. Amsterdam: Elsevier Science, pp. 401-422 Roberti P., Oropallo F., Inglese F., Lo Cascio L., de Martinis G. (2003) Towards a Systemic Analysis of Italian Industrial Texture Review “Industria” 4/2002, Il Mulino Renssen R. H. (1998), “Use of Statistical Matching Techniques in Calibration Estimation”, Survey Methodology, vol. 24, n. 2, pp. 171-183 Rodgers, W.L. (1984), An Evaluation of Statistical Matching. Journal of Business and Economic Statistics 2, 91-102 Rubin D.B. (1987), Multiple Imputation for Non-response in Surveys, Wiley & Sons, New York Schafer J.L., Olsen M.K. (1998), “Multiple imputation for multivariate missing-data problems: a data analyst's perspective”, Multivariate Behavioural Research, vol. 33, pp. 545-571 Singh A. C., Mohl C. A. (1996), “Understanding Calibration Estimators in Survey Sampling”, Survey Methodology, vol. 22, n.2, pp. 107-115 Singh, A.C, Mantel, H.J., Kinack, M.D., Rowe, G. (1993) Statistical Matching: Use of Auxiliary Information as an Alternative to the Conditional Independence Assumption, Survey Methodology, June 1993vol. 19, No.1 pp. 59-79 - Statistics Canada Winkler W. E. (1995), “Matching and Record Linkage”, in B. G. Cox et al. (ed.), Business Survey Methods, Wiley & Sons, New York, pp. 920-935 (355-384)
31
Page 16: [1] Formatted
Filippo Oropallo
8/29/2003 1:43:00 PM
Filippo Oropallo
8/29/2003 1:47:00 PM
Filippo Oropallo
8/29/2003 1:43:00 PM
Filippo Oropallo
8/29/2003 1:41:00 PM
Font: Bold Page 16: [2] Formatted
Centered, Space Before: 3 pt Page 16: [3] Formatted
Font: 8 pt Page 16: [4] Deleted
Page 16: [5] Formatted
Filippo Oropallo
8/29/2003 1:43:00 PM
Filippo Oropallo
8/29/2003 1:43:00 PM
Filippo Oropallo
8/29/2003 1:44:00 PM
Filippo Oropallo
8/29/2003 1:44:00 PM
Filippo Oropallo
8/29/2003 1:44:00 PM
Filippo Oropallo
8/29/2003 1:44:00 PM
Filippo Oropallo
8/29/2003 1:44:00 PM
Filippo Oropallo
8/29/2003 1:44:00 PM
Filippo Oropallo
8/29/2003 1:44:00 PM
Filippo Oropallo
8/29/2003 1:44:00 PM
Filippo Oropallo
8/29/2003 1:44:00 PM
lolocasc
8/29/2003 4:08:00 PM
Filippo Oropallo
8/29/2003 1:44:00 PM
Filippo Oropallo
8/29/2003 1:44:00 PM
Filippo Oropallo
8/29/2003 1:44:00 PM
lolocasc
8/29/2003 4:08:00 PM
lolocasc
8/29/2003 4:08:00 PM
Filippo Oropallo
8/29/2003 1:44:00 PM
Font: 8 pt Page 16: [6] Formatted
Font: 8 pt Page 16: [7] Formatted
Font: 8 pt Page 16: [8] Formatted
Font: 8 pt Page 16: [9] Formatted
Font: 8 pt Page 16: [10] Formatted
Font: 8 pt Page 16: [11] Formatted
Font: 8 pt, English (U.K.) Page 16: [12] Formatted
Font: 8 pt Page 16: [13] Formatted
Font: 8 pt Page 16: [14] Formatted
Font: 8 pt Page 16: [15] Deleted
Page 16: [16] Formatted
Font: 8 pt, English (U.K.) Page 16: [17] Formatted
Font: 8 pt Page 16: [18] Formatted
Font: 8 pt Page 16: [19] Formatted
Font: 8 pt Page 16: [20] Formatted
Font: 8 pt Page 16: [21] Formatted
Font: 8 pt Page 16: [22] Formatted
Font: 8 pt
Page 16: [23] Formatted
lolocasc
8/29/2003 4:08:00 PM
Filippo Oropallo
8/29/2003 1:44:00 PM
Filippo Oropallo
8/29/2003 1:44:00 PM
Filippo Oropallo
8/29/2003 1:44:00 PM
Gloria De Martinis
9/6/2003 9:59:00 AM
Filippo Oropallo
8/29/2003 1:44:00 PM
Filippo Oropallo
8/29/2003 1:44:00 PM
Filippo Oropallo
8/29/2003 1:45:00 PM
Filippo Oropallo
8/29/2003 1:45:00 PM
Font: 8 pt, English (U.K.) Page 16: [24] Formatted
Font: 8 pt Page 16: [25] Formatted
Font: 8 pt Page 16: [26] Formatted
Font: 8 pt Page 16: [27] Change
Formatted Bullets and Numbering Page 16: [28] Formatted
Font: 8 pt Page 16: [29] Formatted
Font: 8 pt Page 16: [30] Formatted
Font: Bold Page 16: [31] Formatted
Font: Bold