Environmental sensor networks and continuous data quality assurance to manage saline wetland drainage within a highly regulated river basin. Nigel W.T. Quinn1,4, Ricardo Ortega2,3, Patrick J.A. Rahilly3, Caleb W. Royer1 and Lisa M. Holm 4 1
Lawrence Berkeley National Laboratory, Berkeley, California; 2California Department of Fish and Game, Los Banos, California; 3Grassland Water District, Los Banos, California, 4US Bureau of Reclamation
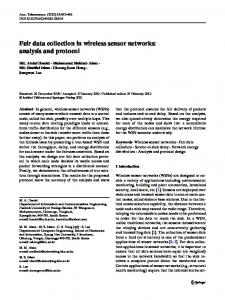
Abstract Environmental sensor networks enjoy widespread deployment as monitoring systems have become easier to design and implement in the field and installation costs have fallen. Unfortunately software systems for data quality assurance have not kept pace with the development of these sensor network technologies and risk compromising the potential of these innovative systems by making it difficult to assess the accuracy and consistency of the data. Lingering uncertainty can constrain the willingness of stakeholders to make operational decisions on the basis of the real-time sensor data – a few negative experiences can do irreparable damage to a project which is attempting to change stakeholder behavior. Successful management of river salt loads in complex and highly regulated river basins such as the San Joaquin Valley of California presents significant challenges to Information Technology infrastructure within resource management agencies that have a poor history of coordination and data sharing. Past attempts at developing web-based environmental data resources to address salinity issues have failed in large part due to a fear of loss of autonomy, quality assurance and data reliability issues. This paper describes a new approach to environmental decision support for salinity management in the San Joaquin Basin of California that focuses on web-based data sharing using YSI Econet technology and continuous data quality management using a novel software tool, Aquarius. Commercial turn-key monitoring systems such as YSI EcoNet provide real-time web-access to sensor data as well as providing the owner full control over the way the data is visualized. The same web-sites use GIS to superimpose the monitoring site locations on maps and local hydrography and allow point and click access to the data collected at each environmental monitoring site. This Information Technology suite of software and hardware work together to provide timely, reliable and high quality data in a manner that can used by stakeholder decision makers to better manage salt export to the San Joaquin River and ensure compliance with State water quality objectives.
Introduction During the past 5 years there has been a revolution in the way individuals share information. Social networking software applications such as Facebook, MySpace and U-tube continue to redefine the manner by which knowledge is acquired and shared. The US Environmental Protection Agency Office of Information Technology has suggested that the next five years will witness as significant a technical revolution in data sharing technologies as the past five have provided in the ability to search. As data sharing becomes more widespread a significant constraint to the use of the information acquired is the issue of data quality. Important decisions are often made on current or real-time data – which is why, in the past, agencies preferred to establish and maintain their own monitoring stations. However, scant attention and few resources have been devoted to sharing the data from these stations with others. Given the rapid increase in statutory environmental regulation during the past decade and the establishment of a pollutant-load regulatory framework in many countries such as the TMDL (total maximum daily load) in the US, individual organizations are hard-pressed to pay for the large extensive monitoring networks that would be required to properly manage contaminated return flows to receiving water bodies. Data sharing combined with procedures for continuous data quality assurance if implemented could become a cost effective strategy for watershed-based pollutant regulation and management. This paper describes a prototype data acquisition, sharing and data quality assurance project developed for salinity management within the San Joaquin Basin of California. Salt export from agricultural, wetland and municipalities is regulated as part of a comprehensive TMDL for the San Joaquin River Basin (EPA, 2002; Quinn and Karkoski, 1998). This paper describes the application of hardware and software technologies developed by this project to seasonally managed wetlands within the Basin (Quinn and Hanna, 2003; Quinn et al., 2005) – managed wetlands provide the most challenging problems for implementation, as will become clear shortly. The technologies developed for this application can be extended to improve compliance with TMDL water quality objectives over the entire Basin. A similar system could have applicability in any watershed where decision support systems are being developed to assist for stakeholders as part of a coordinated strategy for non-point pollutant load reduction. Management of salt loads Seasonally managed wetlands in the western San Joaquin Basin of California’s Central Valley provide overwintering habitat for migratory waterfowl and hunting opportunities during the annual duck hunting season. Wetland water supply is supplied from the Sacramento – San Joaquin River Delta and contains inorganic salts which evapoconcentrate in the man-made, seasonally managed ponds, before being drained (between late March and early May) into channels that discharge into the San Joaquin River. This seasonal wetland drainage, produced within a 50,000 hectare wetland Grasslands Ecological Area (GEA) of the San Joaquin Basin (Figure 1) must be eliminated to preserve salt balance and sustain habitat con-
Figure 1. WARMF-SJR model representation of the main-stem of the San Joaquin River, California. Current continuous environmental monitoring stations are shown (as black circles) along the River. The WARM-SJR is a watershed-based decision support system which contains a comprehensive flow and water quality simulation model of the river, its major tributaries and the land use practices that contribute contaminant loads in surface and subsurface return flows to the River. The model is in the public domain and has been used to support TMDL planning activities in the US (Chen et al., 2001). ditions that make these wetlands the most important migratory bird resource in the western United States. Unfortunately the wetland drainage (drawdown) schedule coincides, with the germination period of salt sensitive agricultural crops, irrigated with water pumped from the River approximately 100 km downstream in the South Delta. Total Maximum Daily Loads (TMDL’s) limit agricultural and wetland discharges of salt loads to the SJR. During dry and critically dry years the salt TMDL is especially restrictive curtailing salt load from irrigated agricultural land during the summer months when drainage return flows are typically highest. Under these hydrologic conditions dilution flows from the Sierran tributaries to the San Joaquin River (SJR) diminish and River assimilative capacity is likewise reduced resulting in greater frequency of violation of the State water quality objective for salinity. River assimilative capacity is established at a downstream compliance monitoring station in the South Delta - the most downstream river site not subject to tidal influence. Assimilative capacity, expressed in tonnes of salt, is the difference between the product of the current flow and numerical water quality objective and the current salt load measured at the compliance monitoring station. A
negative River assimilative capacity (Figure 2) occurs any time the numeric water quality objective is exceeded.
Figure 2. Illustration of the concept of real-time water quality management. Salt assimilative capacity (shown by the shaded grey area) is typically high during winter months when a combination of a higher salinity river objective (1,000 uS/cm) and rainfall runoff produce high diluting flows from east-side San Joaquin River tributaries. Wetland drainage salt loads from private wetlands in the Grasslands Ecological Area are sufficient to produce negative assimilative capacity during periods in late March and early April when river salt concentrations exceed State-mandated water quality objectives. Under a real-time salinity management scenario delaying wetland drainage drawdown until mid-April would re-schedule this salt loading to a period of high River assimilative capacity preventing exceedence of river salinity objectives.
Real-time water quality management Real-time water quality management (RTWQM) is a strategy for meeting downstream water quality objectives by improving coordination of upstream contaminant loading from non-point sources with dilution flows so as to maintain river assimilative capacity. In the case of the San Joaquin Basin east-side reservoir releases from tributaries carrying snow-melt from the granitic Sierra Nevada mountains and return flows from east-side irrigation districts provide dilution to a San Joaquin River that drains west-side salt laden soils. Salt loads from water im-
ported from the Delta combine with native salts leached from soils that were once an uplifted seabed in west-side drainage return flows. West-side agricultural return flows are at their highest during the summer irrigation season. Seasonal wetland salt loads are highest during the months of March and April when the majority of the seasonal wetland ponds are drawn down to promote establishment of moist soil plants and other native grasses that provide a protein source to overwintering waterfowl. Real-time salinity management (RTSM) has been advocated as a means of improving compliance with SJR salinity objectives by improving the coordination of west-side agricultural and wetland dischargers of salt with reservoir releases flows made along east-side tributaries. RTSM is a concept that relies upon access to real-time flow and electrical conductivity data from networks of sensors located along the SJR and its major tributaries (Quinn and Karkoski, 1989). RTSM involves comprehensive watershed flow and water quality monitoring, modeling, salt assimilative capacity forecasting, information dissemination and sharing as part of an Environmental Decision Support System (EDSS). RTSM provides timely decision support to agricultural water districts and seasonal wetland managers - allowing them to improve the coordination of salt load export with the available assimilative capacity of the San Joaquin River (Quinn and Hanna, 2003). Although salinity management has been practiced within west-side San Joaquin River Basin agricultural water districts for more than 100 years and salinity management has only become a concern to seasonally managed wetlands since the announcement of the salt TMDL – progress towards RTWQM is more advanced in the wetland areas. This is largely because of the more serious longterm consequences of restricted salt export in the seasonally managed wetlands. This paper focuses on implementation of RTSM in San Joaquin Basin seasonal wetlands.
Wetland salinity management Real-time salinity management applied to seasonal wetlands in the San Joaquin Basin requires alteration to the traditional wetland drawdown schedule. This drawdown schedule is typically established to promote the establishment of moist soil plant habitat that provides the optimal food resource for overwintering waterfowl. Changes to this traditional schedule come at a potential cost to the sustainability of the moist soil plant habitat resource (Frederickson and Taylor, 1982, Quinn et al. 2005). However there are few definitive studies upon which to base salinity management strategies. Past attempts to build integrated environmental monitoring and decision support systems to implement the concept of RTSM in seasonally managed wetlands, have enjoyed limited success because of technical transfer issues to implementation by wetland water managers. Most wetland managers choose their career because they enjoy working in nature and are not inclined to spend the majority of their time downloading and processing environmental data. Nonetheless the threat of future regulation of wetland salt exports, combined with the dearth of watershed water quality data with which to fully assess the salinity contribution from these managed wetlands to the SJR, created an
opportunity to experiment with new concepts in environmental decision support system design. In addition, through recent advances in data sharing technologies such as the world wide web, flow and salt load data from major drainage outlets was posted on the world wide web, providing wetland managers with an improved appreciation of the relationship between wetland salt exports and water quality conditions within the SJR.
Data sharing technologies In our managed wetlands application web delivery of the processed water quality data through YSI-EcoNet was initiated in 2005. YSI-EcoNet integrates sensor hardware (acoustic flow probes, pressure and water quality sondes) and dataloggers with software that perform local data storage, telemetry and visualization. YSI-EcoNet comprises a mesh of Data Nodes that collect data from flow and
Figure 3. Environmental sensor network showing how individual sensors at each monitoring site report to local data nodes and communicate to each other through radio frequency telemetry. Master (access) nodes poll each data node and report data from multiple data nodes to the NIVIS data center. The NIVIS Data Center posts sensor data every 15 minutes to the web – allowing near real-time retrieval of preliminary data. Continuous data processing is required to produce data suitable for public access and retrieval (YSI Inc., 2007).
water quality measuring sensors and Access Nodes that have the added capability of collecting data via a low power radio interface from surrounding Data Nodes (Figure 3). The Access Node transmits logged data to a remote DataCenter via CDMA cellular phone or satellite modem from which the data is made accessible through the Internet. A remote data storage and processing facility – the NIVIS Data Center – maintains all data collected by the monitoring network at 15 minute intervals through a service contract with YSI Inc. The wireless mesh network topology allows "point-to-point" or "peer-to-peer" connectivity and an ad hoc, multi-hop network. The mesh network is self-organizing and self-healing – hence loss of one or more nodes does not necessarily affect its operation. This increases the overall reliability of the system by allowing a fast local response to critical events in the rare event of a communication problem. Elimination of tedious data acquisition and processing procedures through adoption of YSI-EcoNet has worked well with our wetland manager client base by eliminating much of the tedium of downloading and processing environmental data. It has also allowed wetland managers more time to perform bi-weekly sensor quality assurance checks including cleaning of sensors and checking the accuracy of staff gauge data (used in the computation of flow). Wetland managers have appreciated the time saving benefit of reviewing monitoring site data ahead of routine quality assurance checks – this helps prepare field staff for contingencies such as sensor failure prior to travelling to the site. The project monitoring sites are up to 30 km apart.
Data quality control and assurance A limitation of many environmental decision support projects that rely on the telemetry of monitored data to a stakeholder community is data quality assurance. Data quality assurance protocols established for discrete environmental sampling is well established and data quality control plans are integral components of most environmental monitoring projects. However with continuously recorded and reported data - the logistics of monitoring site visitation, data management, processing and error correction become more onerous. Until recently few software tools existed to facilitate and guide these tasks - even the idea of migrating preliminary environmental data to another internet-accessible location after data quality assurance had been performed has not been routinely practiced. Inaccurate or absurd data posted to a project website can cause irreparable harm to a project and can quickly lead to a loss of confidence in the stakeholder community. In our wetland salinity management project cumulative flow calculations which were performed by our acoustic Doppler instrument were accurate when downloaded from the data collection platform but were 100 times too high when transmitted using the SDI-12 protocol to an external datalogger. This turned out to be a programming error in the firmware – a decimal point was omitted in the program and re-inserted during output processing. This error was caught by one of our important project cooperators, who had become a routine user of project real-time data. Our close working relationship prompted early feedback from this cooperator and relatively quick recognition and resolution of the problem. This is not typical –
problems such as these often fester within the stakeholder community before coming to light – by which time enthusiasm for the project and trust between project proponents and the stakeholder community has been eroded.
Software tools for continuous data quality assurance The Aquarius Environment Toolbox (Aquatic Informatics, Inc., 2009) is a suite of software object modules used to manage the entire data processing workflow from the project flow and water quality monitoring stations. The software object modules relevant to the wetland salinity management project include those responsible for: Data Pre-Processing; Data Correction; Modeling; and Output Visualization and Reporting. The Aquarius Whiteboard environment is used to assemble the sequence of object modules that comprise the data processing workflow (Figure 4). The Data Pre-Processing module comprises software objects for Signal Joining and Signal Trimming. The Signal Joining object is used to append multiple time series data files during each data download so that a complete data record can be compiled within a local database. Storing the data in a local database after performing data quality assurance allows the certified data to be uploaded routinely to the NIVIS Data Center, which previously provided access to uncensored real-time data. The Signal Trimming object is used to trim outliers and periods of incomplete data records from the data record before being stored in the database. At the beginning of the project technical problems such as bad circuit boards and poorly sealed acoustic Doppler sensors produced periods of incomplete or suspect records which had to be removed from the data record. The Data Correction object is used to apply manual adjustments to time series datasets. Autonomous collection of data results in anomalies such as biases, drifts, outliers, and non-physical data. Hence, the Data Correction object is used to apply corrections for sensor drift (not typically a problem with the YSI and MACE instruments) or sensor fouling (a significant problem in the wetland environment of the project). For example a Fouling Drift correction is used routinely to compensate for biological fouling or scaling of the water quality sensor that tend to skew readings in a progressive fashion as the biological film or scale develops. Standard practice for quality assurance is to take a single measurement from a sensor immersed in a control solution both before and after cleaning. A more time and cost effective protocol, practiced in the current project, was to calibrate a portable YSI sonde (comprising EC, temperature and pressure sensors) in the laboratory before and after each day in the field. Then the sonde at each monitoring site was calibrated to the ambient portable sonde sensors readings reading at each monitoring site. The sonde EC sensor was recalibrated if the readings differ from the value of the standard solution. Pressure transducers in both the water quality sonde and acoustic Doppler instrument remained stable requiring little adjustment. Monthly removal of biological growth surrounding the pressure transducers was sufficient to keep the transducers from drifting – except in the instances of catastrophic failure where improper sealing with epoxy allowed moisture migration into the sensor.
When using the Aquarius software each correction made to the time series data is recorded in the Correction History Manager which logs information about the correction and makes an entry in the correction history (Aquatic Informatics, 2009). Comments describing the correction appear in small text that is auto generated and can be modified, if necessary, to increase the amount of information for a subsequent correction audit. Offset adjustments were made to correct for a constant (throughout time) bias in the target time series data. Offset adjustments were necessary when a sonde had to be replaced or a sonde moved higher within the stilling well as a result of sediment accumulation around the base of the stilling well. This accumulation of sediment affected water circulation around the electrical conductivity and temperature sensors. Within the Aquarius software the Mark Region tool is used to select a section of the target time series where the offset correction can be used to adjust readings upwards or downward. The percent correction feature in the correction control pane of the software allows the user to apply a calculated known percentage correction to the signal at either the beginning of the data sequence or at the end. Data outliers can be removed using these tools and short data gaps can be interpolated without resorting to a model based correction approach. Data gap interpolation controls provide options that include the application of a linear spine, which simply draws a straight line in between the endpoints of the gap or a cubic spline, which uses up to 5 data points outside the range of the marked gap to guess at the curvature of the time series and using a best-fit curved line. The automated interpolation control options within the Aquarius toolbox are a significant technical advance over existing software and are critical for the anticipated expansion of existing sensor networks necessary to fully implement RTWQM. Manual as well as automated interpolation changes are all noted in the Correction History Manager. Each time a correction is applied to a section of target time series data the Correction History Manager is invoked to capture details about the user performing the correction and the rationale for performing the correction. The Modeling object within the Aquarius toolbox has proved useful in the application of calibration factors to discharge data derived from acoustic Doppler velocity and pressure sensors. Acoustic Doppler velocity sensors sample the flow volume either approaching or moving away from the sensor. In open channels with fluctuating stage or in culverts which can flow partially full - it is difficult to obtain a true mean area-velocity owing to the friction along the perimeter of the conveyance structure. Flow rating relationships between reported and actual flow have been developed for each monitoring site and the rating equation built into the modeling object to transform the reported flow value to an actual flow. At a number of monitoring sites weir boards (flash board risers) provide the means of controlling wetland pond stage and pond outflow – at these sites the modeling object was first used to calculate discharge using the weir equation which is a function of board width and height and water stage over the weir boards. However the difficulty of maintaining continuous records of weir board adjustments proved too onerous for wetland managers and became a bottle-neck for real-time data report-
ing. Acoustic Doppler flow sensors were retrofitted at each wetland drainage site to address this issue. The Aquarius toolbox contains a full suite of Output Visualization and Reporting tools that allow easy review and auditing of any data sequence within the time series database at each monitoring site. The Quick View object displays time series data in a spreadsheet format which facilitates plotting and charting and can be used to provide descriptive statistics of each sensor time series record. It has been used to create overlay multiple data traces within a single window in order to check the functioning of suspect sensors in the monitoring network as part of the data quality assurance program. Reporting the quality certified data back to the NIVIS website (Figure 3) was a feature initially lacking in the commercial release of YSI EcoNet. The NIVIS Data Center did not permit client access to the data except as served through the NIVIS EcoNet website – rather the Data Center provided a means of discriminating between public and private (password protected) access to the website. This had the unfortunate consequence of restricting public access to current data only, given our cooperators reluctance to share potentially flawed data with the general public, as discussed at the beginning of this paper. Only project personnel and cooperators were provided with private user access allowing these clients to download the time series data record. In late 2009 a solution was negotiated between YSI Inc. and the NIVIS Data Center that provided a data export wizard and the ability to add a second data column paired with each of the web- reported sensor outputs. The schema for the protocol appears in Figure 4. Under this protocol public access clients can view all historic data once they have been migrated into the second column after having undergone data quality assurance procedures. Private access clients are able to view both columns of data on the project website and have full access to the time series data for all monitoring sites. Automation of the data filtering and web posting process will speed-up stakeholder access time to information needed to make RTWQM decisions. These actions will help develop the assurances needed for stakeholders to fully implement RTWQM within the San Joaquin River Basin.
Water quality forecasting and decision support Successful implementation of RTWQM in the San Joaquin Basin requires that salt loads exported from managed wetlands and other west-side dischargers within the Basin never exceed the calculated assimilative capacity of the San Joaquin River. River assimilative capacity (expressed as a salt mass load) is determined by the product of river flow and the ambient water quality standard for salinity, established at the downstream compliance monitoring station. A decision support tool was developed to simulate daily river assimilative capacity and permit forecasting of allowable salt loading from managed wetlands in the Basin based on real-time flow and salinity data. The Watershed Management Framework (WARMF) model (Chen et al. 2001, Herr et. al, 2001, Herr and Chen, 2006) is comprehensive decision support tool
Figure 4. Protocol for replacing preliminary data on the NIVIS public website with data after quality assurance filtering has been completed. specifically designed to facilitate TMDL development at the watershed-level. The WARMF-SJR application simulates the hydrology of San Joaquin River Basin and performs mass balances for a broad suite of potential contaminants including total dissolved solids. The model simulates tributary inflows from the major east-side rivers, agricultural and wetland drainage return flows, riparian and appropriative diversions and uses hydrologic routing to calculate flow and water quality at approximately 1 km intervals along the main stem of the SJR. Wetland drainage from the Grassland Ecological Area was partitioned into component State, Federal and private wetland contributors to SJR salt load. A GIS-based graphical user interface (GUI) facilitates the visualization of model input flow and water quality data. Data templates expedite automated data retrieval from State and Federal agency hydrology and water quality databases and the automated updating of model input files. Water managers can enter daily schedules of diversions and discharges using the spreadsheet formatted model data interface. Standardized model output graphics aid the dissemination of flow and water quality forecasts. A wetland water quality model is under development that simulates water and salinity balances for individual (and lumped) ponded areas and which aggregates wetland discharge and salt loading from all contributing areas and enables comparison with, yet to be established, salt loading targets for the Grasslands Ecological Area. Monthly sub-basin, seasonally-adjusted salt load targets are one of a number of salinity management strategies that could be used to encourage cooperation and coordination of wetland drawdown by State, Federal and private wetland stakeholders. Coalition building between stakeholders with like interests and who are required to comply with similar environmental regulations has been effective in California as a means of retaining local control and management flexibility. The WARMF model is used as the general simulator for the wetland decision support system application. http://www.epa.gov/ATHENS/wwqtsc/html/warmf.html . The new model application will track the salt concentration within each ponded area based on estimated wetland evaporation, seepage and cumulative inflow and out
flow and the salinity concentrations of these fluxes. Output from the WARMF wetland model application will overwrite estimated values for the State, Federal and private wetland salt loads in the WARMF-SJR model – to provide a more accurate assessment of San Joaquin River assimilative capacity.
Figure 5. Data processing whiteboard within the Aquatic Informatics Aquarius software. Continuous environmental monitoring data is merged with weekly quality assurance data collected at each monitoring station to allow continuous error checking and data corrections to take place. Real-time water quality management (RTWQM) requires continuous data processing to allow daily salinity assimilative capacity forecasts to be made.
Institution building Realization of the potential of RTWQM will require the formation of a watershedlevel salinity management entity with the authority to encourage compliance with sub-basin salt load targets and to impose penalties for violation of these established salt load limits. A local coalition of entities discharging drainage to the San Joaquin River formed a “Drainage Authority” to coordinate flow and water quality monitoring requirements imposed by the Regional Water Quality Control Board (a State institution responsible for implementation of TMDL’s in the San Joaquin River Basin). This Drainage Authority is financed by stakeholder contributions and retains a staff to oversee the activities of the agricultural, wetland and municipal dischargers of salt and other contaminants into the San Joaquin River. Oversight involves maintenance of monitoring stations, responsibility for discrete sample collection and analysis and monitoring data record keeping. Implementation of RTWQM will require a similar institution though with added responsibilities of coordinating both drainage return flows and reservoir releases from east-side tributaries, synthesis of real-time data and dissemination of daily salt assimilative capacity forecasts for the San Joaquin River. At the present time a conceptual conceptual design of this new institution has not been formulated.
Summary Technical advances in data acquisition and information dissemination technologies have made possible the implementation of a real-time salinity management program in California’s San Joaquin Basin. Experience to date with respect to implementation of RTWQM in the San Joaquin Basin suggests the following principles that have been discussed in the paper : (a) necessary stakeholder participation in the design and operation of environmental monitoring stations; (b) decision support system design features need to recognize the time constraints, technical expertise and work preferences of those responsible for implementing RTWQM; (c) simulation models that form the core of decision support systems should have map-based interfaces, retrieve real-time data through automated web browsing tools and provide visualization designed to aid basin stakeholder understanding and the consequences of management decisions; (d) new commercial technologies that promise to improve measurement accuracy and reliability and streamline environmental decision support often bring along their own unique problems and challenges. Software bugs and hardware malfunctions are common and early adopters are advised not to over-promise outcomes, at least in the early stages, while these problems are being addressed. (e) sensor web technologies such as YSI-EcoNet and powerful signal processing software such as Aquarius have provided a quantum leap toward successful implementation of RTWQM The process of implementing RTWQM will further encourage innovation – successful implementation will have significant transfer value to other highly regulated river basins where water quality is a concern.
Acknowledgements The authors would like to thank the US Bureau of Reclamation , California Department of Water Resources and California Regional Water Quality Control Board who have funded research projects over the past decade directed at implementing real-time water quality management in the San Joaquin Basin of California. Thanks also to the California Department of Fish and Game, and Grassland Water District that have allowed the extension of the general concepts of RTWQM to the managed seasonal wetlands resource in the Grasslands Ecological Area and to YSI Inc. who have provided valuable technical support for deployment of the YSI-ECONET technology in California.
References Aquatic Informatics Inc.
[email protected] Aquarius Hydrologic Workstation software. 200 – 322 Water St., Vancouver, B.C. V6B 1B6, Canada.
Environmental Protection Agency, 2002. Total Maximum Daily Load for Salinity and Boron in the Lower San Joaquin River. Staff report by the Regional Water Quality Control Board, Central Valley Region, California. Chen, C.W., Herr, J., and Weintraub, L.H.Z. 2001. “Watershed Analysis Risk Management Framework: Update One: A Decision Support System for Watershed Analysis and Total Maximum Daily Load Calculation, Allocation, and Implementation,” EPRI, Palo Alto, CA. Topical Report 1005181. Fredrickson, L.H. and T.S. Taylor 1982. Management of seasonally flooded mpoundments for wildlife. Resource Publication 148. U.S. Dept. of the Interior, Fish and Wildlife Service, Washington, D.C. Herr, J., Weintraub, L.H.Z., and Chen, C.W. 2001. “User’s Guide to WARMF: Documentation of Graphical User Interface,” EPRI, Palo Alto, CA. Topical Report. Herr J. and C.W. Chen. 2006. San Joaquin River Model : Calibration Report. CALFED Project ERP-02D-P63 Monitoring and Investigations for the San Joaquin River and Tributaries Related to Dissolved Oxygen. Systech Water Resources Inc. San Ramon, CA. MACE USA LLC. http://macemeters.com/ P O Box 7144 Shawnee Mission Kansas City Kansas 66207. Quinn, N.W.T. and W.M. Hanna, 2003. A decision support system for adaptive real-time management of seasonal wetlands in California. Environmental Modelling and Software, Volume 18, Issue 6, pp. 503-511 Quinn, N.W.T. and J. Karkoski, 1998. Real-time management of water quality in the San Joaquin River Basin, California. American Water Resources Association, Vol. 34, No. 6. Quinn N.W.T., J.S. Hanlon, J.R. Burns, C.M. Taylor, T Lundquist and W.T. Stringfellow. 2005. Real-Time Water Quality Monitoring and Habitat Assessment in the San Luis National Wildlife Refuge. Lawrence Berkeley Laboratory Topical Report # 58813, Berkeley, CA. Yellow Springs International Inc. 2007. https://www.ysi.com/ 1700/1725 Brannum Lane Yellow Springs, OH 45387-1107, USA.