Oct 10, 2016 - ... Taiwan) was used to record the. ISSN: 0976-3104. G u e st e ditors: Dr. SK. G u p ta ... may pose threat to the existence of aquatic life. ... life, fisheries. (recreation and aesthetic). E. (Irrigatio n, industria ..... in Sava river water.
|SPECIAL ISSUE| ENERGY, ENVIRONMENT, AND ENGINEERING SECTION: WATER, AIR AND SOIL POLLUTION- MONITORING AND REMEDIATION ISSN: 0976-3104
ARTICLE ASSESSMENT OF SEASONAL VARIATION OF SURFACE WATER QUALITY: ENVIRONMETRIC AND INDEXING APPROACH Mayuri Chabukdhara1*, Sanjay Kumar Gupta2, Arvind Kumar Nema2 1
Dept.of Environmental Biology and Wildlife Sciences, Cotton College State University, Guwahati, Assam-INDIA Environmental Engineering Laboratory, Department of Civil Engineering, Indian Institute of Technology, Hauz Khas, New Delhi, INDIA
2
ABSTRACT The seasonal variation of water quality of the river Hindon in Ghaziabad, India was evaluated using environmetric techniques and metal pollution index. Various environmetric methods were tested for source apportionment and identifying the variables responsible for seasonal variations in river water characteristics. Source analysis indicated that in the pre-monsoon period, the metal contamination in river water was due to the disposal of industrial and urban wastewater. The order of metals as per River Metal Pollution Index (RMPI) as follows Pb > Cd > Zn > Cr > Cu > Fe > Ni. The RMPI indicated high pollution at S-3, S-5 and S-6 (IMPI > 2) and moderate pollution at S-1, S-2 and S-4 (IMPI ≤ 2). Based on IMPI ranking, the order of all the monitored sites was as follows: S-3 > S-5 ≥ S-6 > S-4 > S-1 > S-2. This finding of the present study demonstrated the necessity and usefulness of integration of environmetric analysis and pollution index method in monitoring river water quality.
INTRODUCTION KEY WORDS Environmetric techniques; Metal pollution index; Hindon; Discriminant Analysis; Industrial and urban sources
Published: 10 Oct 2016
The deterioration of river water have become a crucial environmental issue in most of the countries therefore, it is one of the most threatened freshwater resources in the present scenario. In most of the countries including India, the river water is used for domestic, agricultural and numerous industrial purposes. However, due to the disposal of untreated or partially treated domestic and industrial wastewater in to surface water, the vulnerability to the contamination is very high. Several factors including geological morphology, vegetation, atmospheric inputs, climatic conditions, anthropogenic activities directly or indirectly affects the river water quality [1-2]. Along with various physico-chemical water quality parameters, contamination of heavy metals in the water bodies is also of a serious concern. Industrial and urban discharges, agricultural activities, atmospheric deposition and geologic weathering of rocks and minerals etc are the major sources of heavy metals contamination in water bodies [3-5]. Thus, there is an urgent need to control and maintain the safe ambient river water quality because its deterioration reduces the usability of these precious resources [6]. Such maintenance requires pollution control through point and diffused sources and regular monitoring as well. However, the water quality monitoring, analysis and interpretation of the large number of measured variables and influencing factors it is a major challenge [7]. Therefore other than analytical tools, various statistical methodologies are required to obtain conclusive monitoring results for preparing appropriate management strategies. The application of environmetric methods not only helps in source apportionment but also avoid misinterpretation of monitoring data. These methods are also helpful in decision making process in terms of effective management of the water resources through appropriate strategies [7-9]. The present study was undertaken to assess the seasonal variation of Hindon river water quality in terms of physico-chemical parameters and heavy metals distributions. The probable pollution sources were identified using environmetric methods. Further, river metal pollution index (RMPI) was estimated to understand the influence of metal contamination on river water quality.
Study area
*Corresponding Author Email: mayuri_chabukdhara@ya hoo.co.in Fax: + +91-361-2733502
River Hindon originates in the lower Himalayas in Saharanpur district of Uttar Pradesh, India. This is a tributary of river Yamuna and flow through Ghaziabad district (28°40' N and 77°25' E), located in the middle of Ganga-Yamuna doab at about 1.5 km east of the river. Ghaziabad is one of the fastest growing industrial cities of the country with more than 300 industrial units in the city. Details of the industries are given elsewhere [10].The Hindon river water is predominantly used for domestic, agricultural and industrial purposes in Ghaziabad. The climate of this region is tropical to temperate and the rainfall usually starts in the end of the June and normally it rains till October.
Sampling, monitored parameters and analytical methods Total six sites [Fig. 1], along the Hindon River and an artificial canal branch (Hindon Cut, S5) were selected for sampling of river water for this study. A GPS (Garmin® eTrex® Vista Cx, Taiwan) was used to record the
16 www.iioab.org
| Chabukdhara et al. 2016 | IIOABJ | Vol. 7 | 11 | 16–24 |
Guest editors: Dr. SK Gupta and Prof. Mukesh Khare
MATERIALS AND METHODS
|SPECIAL ISSUE| ENERGY, ENVIRONMENT, AND ENGINEERING SECTION: WATER, AIR AND SOIL POLLUTION- MONITORING AND REMEDIATION
location (longitudes and latitudes) of each site. Water samples were collected in pre-cleaned polypropylene bottles and stored at 40C during the transit period. Selected physico-chemical parameters were analyzed following standards method of water and wastewater analysis (APHA). Heavy metals analysis was performed by atomic absorption spectrophotometer (ECIL, India) following acid digestion method as described by APHA [11].
Fig. 1: Map showing sampling sites …………………………………………………………………………………………….
Reagents and standards Throughout the study, analytical grade chemicals were used. All the reagents and standards were prepared by ultrapure water (TKA, Germany). The metal standards were prepared from certified stock solution of 1000 mg/l (E-Merck, Germany) and used for the calibration purposes. All the analysis was carried out in triplicate.
Data treatment and environmetric methods The water quality monitoring data were analyzed using a statistical package SPSS® (Window Version 17.0) and with XlStat, an add-in package of Microsoft Excel 2011. Correlation analyses were performed on the different datasets depending upon the nature of data. Environmetric multivariate analyses including principal component analysis (PCA), and discriminant analysis (DA) was used for selected data sets. Detailed information about environmetric techniques is given elsewhere [10]. The normality of data for all metals was checked prior to multivariate analysis and logarithmic transformation was used wherever required.
River metal pollution index The metal pollution index is applied to compare seasonal variations of metals at different sites in Hindon River. River metal pollution index (RMPI) was calculated as per following equation. RMPI=Crmc/Csmc
(1)
where RMPI is the river metal pollution index; Crmc is the measured metal concentration(µg/l) in river water; Csmc is the standard metal concentration (µg/l) in surface water. All the standard values (µg/l) were adopted from USEPA acute values [12] for protection of freshwater aquatic life which are as follows: 13 for Cu, 2 for Cd, 120 for Zn, 1000 for Fe and 470 for Ni, respectively. The standard values adopted for Cr was 11 and 32
17 www.iioab.org
| Chabukdhara et al. 2016 | IIOABJ | Vol. 7 | 11 | 16–24 |
|SPECIAL ISSUE| ENERGY, ENVIRONMENT, AND ENGINEERING SECTION: WATER, AIR AND SOIL POLLUTION- MONITORING AND REMEDIATION
for Pb [13]. The monitoring site is regarded as polluted if RMPI > 1; otherwise, non-polluted. Integrated Metal Pollution Index (IMPI) is defined as the mean values for all the Pollution Indexes (PI) of all considered metals [14] and calculated as follows. IMPI= ΣRMPI/n (2) where, n is the number of metals considered in the study. The river water at different sites were classified as low contaminated if the IMPI ≤ 1.0, moderate contaminated if the 1.0 < IMPI ≤ 2.0 or high contaminated when IMPI > 2.0 [15].
RESULTS AND DISCUSSION Basic physico-chemical characteristics of river The physico-chemical parameter represents the quality of river water. Statistical summary of analyzed parameters in pre- and post-monsoon season are shown in [Table 1]. Compared to the Central Pollution Control Board (CPCB) guideline values for inland surface water [15], BOD and NO3- levels were found above the safe limits. High load of NO3- in the surface water may cause eutrophication. The total dissolved solids (TDS) levels in both the pre and post-monsoon seasons exceeded the CPCB’ class A guideline value whereas the mean DO value was lower than the prescribed limit for inland surface water [Table 1]. Low DO in river may pose threat to the existence of aquatic life. TDS in water originates from both natural sources as well as anthropogenic sources such as urban and industrial discharges. Table 1: Summary of physico-chemical characteristics of river Hindon and its comparsion with the CPCB guideline values Physicochemical paramete rs*
Pre-monsoon
Post-monsoon
Overa ll mean
CPCB, 1995 Inland Surface water Classification (ClassA-E)*
Range
Mean
A (Drinking water without conventio nal treatment but after design)
B (Outdo or bathing )
C (Drinking water with conventio nal treatment and after design)
D (Propagati on wild life, fisheries (recreation and aesthetic)
7.25−8. 55 0.22−0. 74 10.8−68
7.56
6.5−8.5
6.5−8.5
6.5−8.5
0.53
-
6.5−8. 5 -
E (Irrigatio n, industria l cooling and controlle d waste disposal ) 6.5−8.5
-
1
2.25
30.0
-
8.0−58
32.4
400
400
10.5−40
27.5
20
50
186−41 0 132−30 4 30−80
299.4
-
-
-
-
-
230.3
-
-
-
-
-
58.1
-
-
-
-
-
26−351
162.2
250
3.97
6
5
4
4
90.3±23.7
2.74−6. 14 44−132
113.6
-
-
-
-
-
26.5±7.17 458.7±26 6.3
14−40 200−12 78
31.5 451
2 500
3 -
3 1500
-
2100
Mean ± SD
Range
Mean SD
pH
7.32±0.3
6.8−7.85
7.8±0.36
EC (mS/cm) Turbidity (NTU) SO42(mg/l) NO3-(mg/l)
0.68±0.34
0.31−1.4 2 11−82.6
0.37±0.11
TA(mg/l)
314.6±138. 31 245.3±83.2 8 63.4±22.81
TH(mg/l) Ca(mg/l) Cl-(mg/l) DO(mg/l) COD(mg/l) BOD(mg/l) TDS(mg/l)
30.3±18.99 40.2±25.35 30.1±15.08
236.5±260. 07 3.3±1.20 136.8±66.8 9 36.4±16.44 443.2±195
14.6−108 .5 10.6−77. 8 48−556 148−412 32−110 46.6−788 1.04−5.0 9 58−270.5 12−78 170−874
±
29.4±13.3 5 24.6±15.5 3 24.9±7.25 284.2± 79.87 215.2±62. 6 52.7±16.5 3 88.0±89.7 8 4.61±1.28
1000
600
600
Metals concentrations in river water Statistical summary of the mean metals concentrations in the river water for both the seasons are shown in [Table 2]. The Mean values of all metals were lower in post-monsoon season which could be due to dilution effect of rainwater. The results heavy metals analysis clearly demonstrated that among different sites, the site 3 (S-3) was most polluted whereas site-1 (S-1) was least polluted. The total metal concentrations in
18 www.iioab.org
| Chabukdhara et al. 2016 | IIOABJ | Vol. 7 | 11 | 16–24 |
|SPECIAL ISSUE| ENERGY, ENVIRONMENT, AND ENGINEERING SECTION: WATER, AIR AND SOIL POLLUTION- MONITORING AND REMEDIATION
water was recorded in the order of Fe > Zn > Pb > Mn > Ni > Cr > Cu > Cd [Table 3]. During the monitoring, it was noticed that a drain carrying industrial and urban wastewater was getting mixed with the Hindon river near the sampling point no. S-3. This could be reason for higher metal concentrations in water at S-3 location. The concentration of copper (Cu) was above the maximum permitted limits [12] for protection of aquatic life at S-3, S-4, S-5 and S-6 [Table 3]. Similarly, the lead (Pb) and cadmium (Cd) concentrations were also found higher at all sites than the prescribed limits Pb and Cd for protection of aquatic life [12].Throughout all the sampling sites, the zinc (Zn) concentrations were also exceeded the USEPA permitted limits however it was well within CPCB prescribed safe limits [14]. Further, except one sampling location (S1), the iron (Fe) concentrations were also above the USEPA maximum permitted concentrations at all sites. Table 2: Metal concentrations (µg/l) in river Hindon in two different seasons Metals
Pre-monsoon
Cu Cr Pb Cd Zn Mn Fe
Mean ± SD 30.2 ± 19.85 31.7 ± 10.38 193.4 ±115.17 10.5 ± 11.44 423.5 ± 251.62 128.5 ± 65.09 1541 ± 676.46
Range 7−76 12−47 55−435 1.5−37 137−1067 30.5−256 838−2780
Mean 6.4 ± 3.83 12.1 ± 14.32 160.6 ± 79.35 3.6 ± 1.25 311.5 ± 179.94 106.5 ± 43.01 1036.8 ± 498.27
Range 2−18 2−57 55−314 2−6.5 48−719 3−164 400−2024
Ni
106.7 ± 64.61
42−249
33.6 ± 29.1
2−94
Post-monsoon
Table 3: Summary of site-wise metal concentrations (µg/l) in river Hindon Site S-1
Cu 10.3
Cr 13.8
Pb 210.8
Cd 3.9
Zn 313.4
Mn 89.8
Fe 972
Ni 31.4
S-2 S-3 S-4 S-5 S-6 Acute values for protection of freshwater aquatic life
8.8 24.6 13.6 21.1 31.4 13
11.9 35.5 20.7 20.3 29.2 -
137.3 252.7 167.3 119.3 174.6 -
3.3 12.9 3.5 10.7 7.9 2
351 273.3 436.7 594.7 236 120
79.1 194.1 117.2 108 116.9 -
1192 1488.5 1141 1766 1723 1000
40.6 118.7 67.4 98.1 64.8 470
[12]
**
1500
-
100
-
15000
-
300
-
[14]*
Class B
-
-
-
Class C
1500
-
100
-
-
-
Class A
Class D Class E * CPCB Class
-
-
-
-
15000
-
50000
-
-
-
-
-
Ref.
**CPCB classes are same as given in [Table 1]
Correlation analysis of the physico-chemical parameters and metals The Spearman’s rank correlation analysis enabled the identification of possible common characteristics of physico-chemical parameters (not shown) and heavy metals in river water [Table 4]. During pre-monsoon period, the electrical conductivity (EC) values showed strong positive correlations with pH, turbidity, Sulphate (SO42-), nitrate (NO3-), total alkalinity (TA), total hardness (TH), chloride (Cl-), chemical oxygen demand (COD) and total dissolved solids (TDS). The conductivity indicates the presence of positive and negative ions in water therefore the existing relationship is expectable. However, in post-monsoon season, the EC did not show any positive relation with other observed physico-chemical parameters. This could be due to dilution effect in post-monsoon. A significant correlation (p < 0.01, 0.05) was found among SO42-, NO3-, TA, TH, Cland TDS in pre and post- monsoon season indicating the pollution due to a common wastewater discharges. The BOD and COD showed significant relationships with TA, TH and Cl- in both, pre and post-monsoons. Among various heavy metals, except Zn, other metals were found closely associated with each other in premonsoon season whereas in post-monsoon, Cu showed significant correlation with Cr, Pb and Mn while Cr with Cd and Ni and Pb with Zn, Mn and Fe [Table 4]. Table 4: Spearman’s rank correlation matrix for metals in river Hindon
Pre-monsoon Cu Cr Pb
Cu
Cr
Pb
1 0.83** 0.59**
1 0.54**
1.000
Cd
Zn
Mn
Fe
Ni
19 www.iioab.org
| Chabukdhara et al. 2016 | IIOABJ | Vol. 7 | 11 | 16–24 |
|SPECIAL ISSUE| ENERGY, ENVIRONMENT, AND ENGINEERING SECTION: WATER, AIR AND SOIL POLLUTION- MONITORING AND REMEDIATION Cd Zn Mn Fe Ni Post-monsoon Cu Cr Pb Cd Zn Mn Fe Ni
0.84** -0.29 0.37* 0.68** 0.72**
0.76** -0.23 0.57** 0.66** 0.78**
0.47** -0.58** 0.07 0.39* 0.36*
1 -0.29 0.45** 0.46** 0.69**
1 0.22 -0.3 0.15
1 0.33 0.66**
1 0.57**
1
1 0.49** 0.34* 0.28 0.09 0.47** 0.26 0.25
1 -0.06 0.48** -0.32 0.31 -0.16 0.51**
1 0.2 0.68** 0.56** 0.87** -0.67**
1 -0.18 0.19 0.16 0.11
1 0.27 0.59** -0.71**
1 0.58** -0.25
1 -0.7**
1
**Correlation is significant at the 0.01 level (2-tailed). *Correlation is significant at the 0.05 level (2-tailed). .
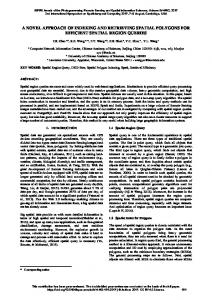
PCA for physico-chemical parameters and metals in river Hindon The PCA analysis revealed that in pre-monsoon EC, turbidity, NO3-, Cl-, TH and TDS showed strong positive loadings and moderate loadings for SO42- in PC1 that explained 36.4% of the total variance. Similarly, PC2 explaining 22% of the total variance which showed strong loadings for COD and BOD and moderate loadings for Cl- and SO42-. The source of PC1 parameters could be mainly from industrial discharges while PC2 may have dominant domestic sources, SO42- and Cl- may have come from mixed sources. The pH, TA and DO were dominated in PC3 that explained 19.8% of the total variance. In post-monsoon EC, SO42-, TA, Cl-, TH, TDS COD and BOD were dominated in the first component (PC1) explaining 43% of the total variance. In PC2, turbidity and NO3- showed strong positive loadings while SO42-, Cl- and BOD showed moderate loadings indicating mixed origin for these parameters. The DO showed negative loadings in PC2 whereas PC3 is dominated by EC. The physico-chemical parameters such as EC, TA, TH and TDS may have dominant contribution from industrial sources while COD and BOD may have major contribution from municipal or urban discharges. The SO42- and Cl-may have come from mixed sources [Table 5]. In order to have clear visualization of the data trends, PCA results of metals is depicted by loadings and score plot. The scores and loadings of the principal components of metals for both the seasons are presented in [Fig. 2a and b]. In pre-monsoon, PC1 explaining 52.6% of the total variance [Fig. 2a] which showed the strong positive loadings for Cu, Cr, Cd, Fe and Ni suggesting different anthropogenic sources for these metals. The results also depicted that Cu, Cr, Fe and Ni may have mainly come from industrial sources such as textiles, foundries, electroplating or galvanizing industries, tanneries, pharmaceutical industries etc. The Cd might have come from electroplating and galvanizing, metal processing industries, dye and dyes, urban discharges etc. The Pb and Zn were dominated in PC2 that explained 24.5% of the total variance [Fig. 2a] but Pb showed negative loading in PC2 indicating an unique source for this metal. Beside various metal processing and pesticide industries, several lead re-processing (>25 units) and induction and foundries (>75 units) are situated there in Ghaziabad industrial area. The wastewater discharges from these industries in to the Hindon river could be responsible for very high Pb contamination. A portion of the industrial particulate emissions of heavy metals directly reaches to the river whereas its substantial amount get settle down on the nearby soil surface and finally get mixed with river water through run-off. The Zn contribution is particularly from electroplating and galvanizing, metal processing, pharmaceutical, textiles, pulp and paper, and pesticide industries as well as from urban wastes also. The Mn showed moderate loadings in PC1 and PC2 indicating mixed sources. In post-monsoon, Pb, Zn and Fe showed strong positive loadings in PC1 (explains 43.1% of total variance) and negative loadings for Ni suggesting unique source for Ni [Fig. 2b]. These metals may have dominant anthropogenic sources even in post-monsoon period. The Cu, Cr and Cd were dominated in PC2 explaining 28.8% of the total variance and these metals might have come from natural sources as the concentration were much lower in post-monsoon due to dilution effect. Table 5: Variance explained and components for physico-chemical parameters in river Hindon
Physicochemical Parameters pH EC
Pre-monsoon PC1 PC2
PC3
Post-monsoon PC1 PC2
PC3
-0.15
-0.14
0.88
0.73
-0.45
0.31
0.32
0.55
-0.05
0.18
0.96
a
0.76
20 www.iioab.org
| Chabukdhara et al. 2016 | IIOABJ | Vol. 7 | 11 | 16–24 |
|SPECIAL ISSUE| ENERGY, ENVIRONMENT, AND ENGINEERING SECTION: WATER, AIR AND SOIL POLLUTION- MONITORING AND REMEDIATION Turbidity
0.77
-0.1
-0.05
0.44
0.75
-0.02
SO42-
0.52
0.43
0.24
0.7
0.64
0.08
NO3-
0.8
0.19
-0.08
-0.03
0.83
0.13
TA
0.2
0.16
0.76
0.93
0.25
-0.05
TH
0.81
0.31
0.37
0.91
0.05
-0.11
-
0.74
0.52
0.33
0.65
0.59
0.4
COD
0.06
0.93
0.19
0.86
0.24
-0.09
BOD
0.09
0.94
-0.11
0.64
0.51
-0.08
TDS
0.9
-0.02
0.09
0.82
0.1
0.41
DO
-0.45
-0.39
-0.6
-0.07
-0.77
-0.52
Eigen values
4.37
2.64
2.38
5.17
3.23
1.66
Total variance % Cumulative %
36.4
22
19.8
43
27
13.8
36.4
58.8
78.3
43
70
83.8
Cl
Extraction Method: Principal Component Analysis aBold values indicate strong and moderate loadings, respectively
Fig. 2: (a). PCA loadings and score plots of heavy metals in (a) pre-monsoon period ……………………………………………………………………………………………………………
21 www.iioab.org
| Chabukdhara et al. 2016 | IIOABJ | Vol. 7 | 11 | 16–24 |
|SPECIAL ISSUE| ENERGY, ENVIRONMENT, AND ENGINEERING SECTION: WATER, AIR AND SOIL POLLUTION- MONITORING AND REMEDIATION
Fig. 2: (b). PCA loadings and score plots of heavy metals in post-monsoon period ……………………………………………………………………………………………………………
Seasonal dissimilarity using DA for physico-chemical parameters and metals To evaluate seasonal variation of different parameters including heavy metals in river water, DA was applied on the raw data matrix by using the standard and backward stepwise modes. The raw data set was classified into two groups comprising pre and post-monsoon. The seasons were the grouping (dependent) variables, while physico-chemical parameters and heavy metals were considered as independent variables. Discriminant functions coefficients obtained from the standard and backward stepwise modes of DA are shown in [Table 6]. The standard and backward stepwise DA showed that among physico-chemical parameters, pH, SO42-, TH, Ca, COD and BOD were significant discriminant variables of seasonal variation among two seasons while among metals Cu, Cr, Pb, Mn, Fe and Ni were the significant discriminant variables of seasonal variation [Table 6]. The DA showed significant differences between two seasons, which were represented in terms of 8 discriminating parameters. Such seasonal variation of various physico-chemical parameters could be due to urban and industrial discharges at various points along the river. Hence, DA rendered a reduction in dimensionality of data set by identification of the most important discriminating variables responsible for seasonal variability. Table 6: Classification function coefficients for seasonal variations of physico-chemical parameters and heavy metals in Hindon river
pH EC Turbidity SO42NO3TA TH Ca ClCOD BOD TDS DO Cu
Standard mode Pre-monsoon 347.148 627.916 -0.078 8.420 9.139 -1.328 1.285 -5.234 -0.263 -1.049 4.874
Post-monsoon 361.847 628.128 -0.131 8.996 8.846 -1.355 1.417 -5.838 -0.242 -1.407 5.583
63.229 7.142
64.599 7.564
Backward stepwise mode Pre-monsoon Post-monsoon 193.086 206.590
1.142
1.385
0.145 -0.395
0.261 -0.919
-1.374 1.730
-1.656 2.316
2.293
2.584
22 www.iioab.org
| Chabukdhara et al. 2016 | IIOABJ | Vol. 7 | 11 | 16–24 |
|SPECIAL ISSUE| ENERGY, ENVIRONMENT, AND ENGINEERING SECTION: WATER, AIR AND SOIL POLLUTION- MONITORING AND REMEDIATION Cr Pb Cd Zn Mn Fe Ni
-5.679 0.126 -22.866 0.381 0.417 -0.186 1.252
-6.365 0.083 -23.160 0.381 0.530 -0.199 1.093
-0.925 -0.339
-1.475 -0.380
0.825 -0.092 -0.689
0.924 -0.105 -0.847
Constant
-1597.663
-1678.211
-654.611
-733.713
Metal pollution index (RMPI) analysis The RMPI depicts the suitability of river water quality for its various uses and also indicates the level of pollution. The RMPI values of pre-monsoon indicated that all sites were contaminated with metals (RMPI > 1) except for Ni at all sites and Cu at S-2. In post-monsoon, all the sites were comparatively less contaminated. Overall metal pollution was found in order of Pb > Cd > Zn > Cr > Cu > Fe > Ni. The IMPI also indicated that the metal pollution degree was comparatively higher in pre-monsoon season and the highest at S-3 [Fig.3]. Based on the IMPI, three sites i.e. S-1, S-2 and S-4 showed moderate pollution (IMPI ≤ 2) whereas the rest of the three sites i.e. S-3, S-5 and S-6 showed high pollution level (IMPI > 2). Based on IMPI, the order of the polluted site was as follows S-3 > S-5 ≥ S-6 > S-4 > S-1 > S-2. The maximum IMPI was noted for S-3 which could be due to mixing of the urban-industrial wastewater to the river while S-5 is the diverted canal from the main river and S-6 is the downstream site of the river that could receive additional metals from various sources all along the river and lesser dilution due to diversion at S-5.
Fig.3: Seasonal trend of integrated metal pollution index (IMPI) in the river Hindon ……………………………………………………………………………………………………………
CONCLUSION Present study showed that application of environmetric techniques for the evaluation of various types of pollutants and characterizing its sources. The physico-chemical analysis and heavy metals data were segregated and useful information were extracted on possible sources of contamination, seasonal variation patterns and characterization of river water quality with the help of environmentric techniques. Integrated metal pollution index (IMPI) was used for the assessment of the heavy metal contamination at various sites of Hindon river and the IMPI indicated severe pollution in pre-monsoon season compared to post-monsoon. The findings of this study clearly revealed that the water quality of Hindon river is very poor and cannot used for domestic purposes. The high load of selected metals may even pose threat to the aquatic life. This kind of integrated study is very important for regular monitoring of rivers water quality and evaluation of pollution load as well as sources. Such type of integrated monitoring programs may help to take effective measures to control pollution in time and managing the water bodies.
23 www.iioab.org
| Chabukdhara et al. 2016 | IIOABJ | Vol. 7 | 11 | 16–24 |
|SPECIAL ISSUE| ENERGY, ENVIRONMENT, AND ENGINEERING SECTION: WATER, AIR AND SOIL POLLUTION- MONITORING AND REMEDIATION
CONFLICT OF INTEREST
There is no conflict of interest.
ACKNOWLEDGEMENTS
The authors acknowledge the support of the Department of Civil Engineering, Indian Institute of Technology Delhi, for providing laboratory facilities for this study.
FINANCIAL DISCLOSURE None.
REFERENCES [1]
[2]
[3] [4] [5] [6]
[7]
Purohit Jarvie HP, Whitton BA, Neal C. [1998] Nitrogen and phosphorus in east-coast British rivers: Speciation, sources and biological significance. Sci Tot Environ 210: 79–109. Brezonic P, Hatch K., Mulla L, Perry D. [1999] Management of diffuse pollution in agricultural watersheds lessons from the Minnesota river basin. Water Sci Tech 39: 323–330. Li S, Xu Z, Cheng X, Zhang Q. [2008] Dissolved trace elements and heavy metals in the Danjiangkou Reservoir, China. Environ Geol 55: 997– 983. Dragun Z, Roje V, Mikac N, Raspor B [2009] Preliminary assessment of total dissolved trace metal concentrations in Sava river water. Environ Monit Assess 159: 99–110 Yilmaz S, Sadikoglu M. [2011] Study of heavy metal pollution in seawater of Kepez harbor of Canakkale (Turkey). Environ Monit Assess 173: 899–904 Fulazzaky MA [2005] Assessment of river water quality degradation of the Citarum and Brantas rivers by using a new developed water quality index system. In: The 2nd Southeast Asia Water Forum: Better Water Management Through Public Participation, Proceeding, Bali, Indonesia Simeonov V, Einax JW, Stanimirova I, Kraft J. [2002] Envirometric modeling and interpretation of river water monitoring data. Analy Bioanal Chem 374: 898–905.
[8] [9] [10]
[11] [12] [13]
[14] [15]
Lambrakis N, Antonakos A, Panagopoulos G. [2004] The use of multicomponent statistical analysis in hydrological environmental research. Wat Res 38: 1862–1872. Kotti ME, Vlessidis AG, Thanasoulias NC, Evmiridis NP. [2005] Assessment of river water quality in Northwestern Greece. Wat Res Manage 19: 77–94. Chabukdhara M and Nema AK. [2012] Assessment of heavy metal contamination in Hindon River sediments: A chemometric and geochemical approach. Chemosphere 87: 945–953. APHA [1998] Standard methods for the examination of water and wastewater analysis (20th ed.) APHA, AWWA USEPA [2006] National Recommended Water Quality Criteria. United States Environmental Protection Agency. Office of Water, Office of Science and Technology Rios-Arana JV, Walsh EJ, Gardea-Torresdey JL. [2003] Assessment of arsenic and heavy metal concentrations in water and sediments of the Rio Grande at El Paso–Juarez metroplex region. Environ Int 29:957–971. Chen TB, Zheng YM, Lei M et al. [2005] Assessment of heavy metal pollution in surface soils of urban parks in Beijing, China. Chemosphere 60: 542–551. Central Pollution Control Board, CPCB [1995]. Classification of Inland surface waters (CPCB Standards) Water Quality Parivesh 1(4), 29-26.
24 www.iioab.org
| Chabukdhara et al. 2016 | IIOABJ | Vol. 7 | 11 | 16–24 |